

Predictive Metabolomic Markers in Early to Mid-pregnancy for Gestational Diabetes Mellitus: A Prospective Test and Validation Study
- PMID: 35532743
- PMCID: PMC9490360
- DOI: 10.2337/db21-1093
Predictive Metabolomic Markers in Early to Mid-pregnancy for Gestational Diabetes Mellitus: A Prospective Test and Validation Study
Abstract
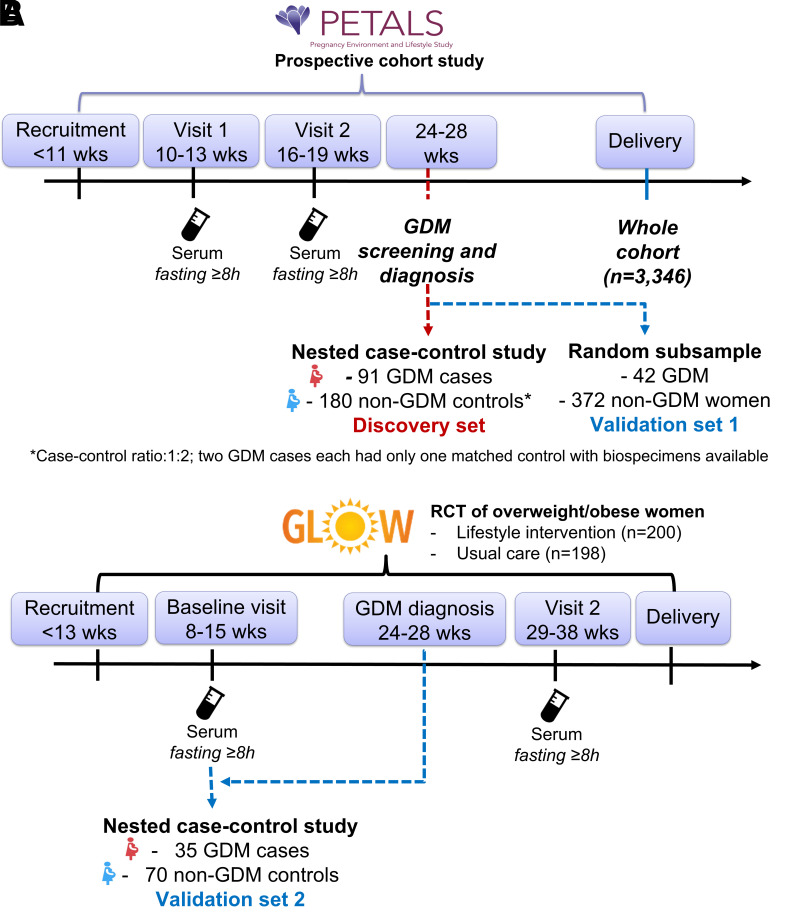
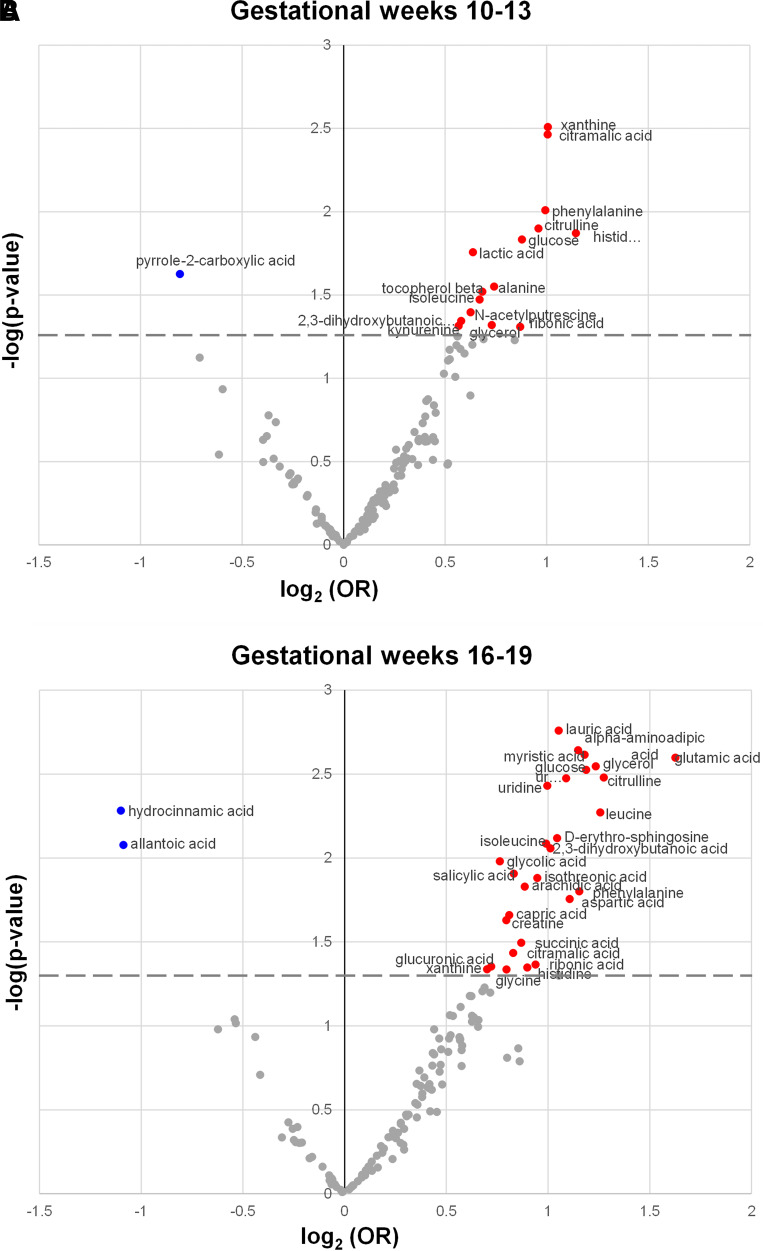
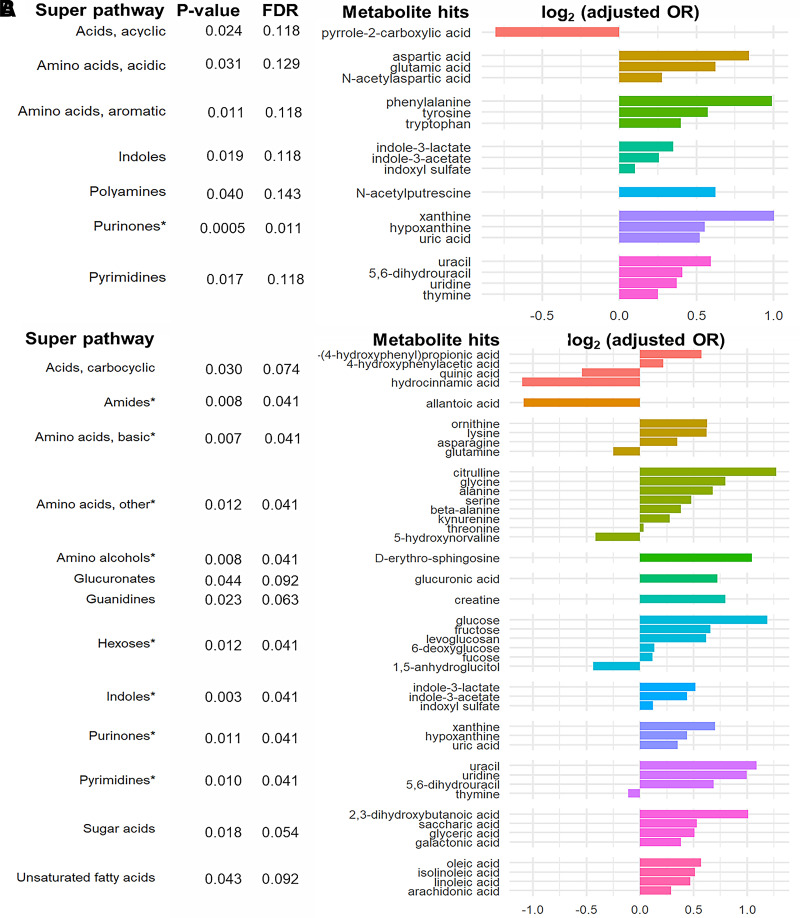
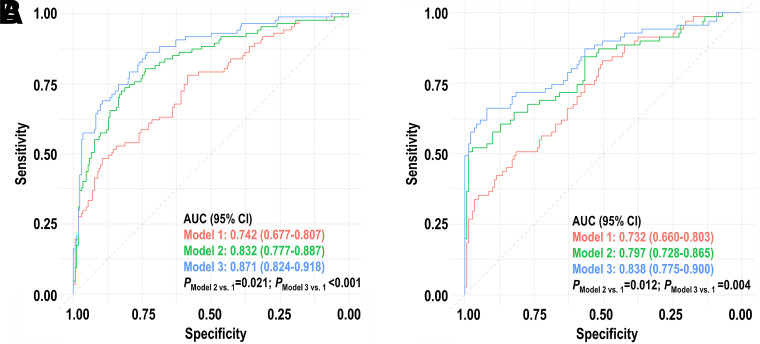
Gestational diabetes mellitus (GDM) predisposes pregnant individuals to perinatal complications and long-term diabetes and cardiovascular diseases. We developed and validated metabolomic markers for GDM in a prospective test-validation study. In a case-control sample within the PETALS cohort (GDM n = 91 and non-GDM n = 180; discovery set), a random PETALS subsample (GDM n = 42 and non-GDM n = 372; validation set 1), and a case-control sample within the GLOW trial (GDM n = 35 and non-GDM n = 70; validation set 2), fasting serum untargeted metabolomics were measured by gas chromatography/time-of-flight mass spectrometry. Multivariate enrichment analysis examined associations between metabolites and GDM. Ten-fold cross-validated LASSO regression identified predictive metabolomic markers at gestational weeks (GW) 10-13 and 16-19 for GDM. Purinone metabolites at GW 10-13 and 16-19 and amino acids, amino alcohols, hexoses, indoles, and pyrimidine metabolites at GW 16-19 were positively associated with GDM risk (false discovery rate <0.05). A 17-metabolite panel at GW 10-13 outperformed the model using conventional risk factors, including fasting glycemia (area under the curve: discovery 0.871 vs. 0.742, validation 1 0.869 vs. 0.731, and validation 2 0.972 vs. 0.742; P < 0.01). Similar results were observed with a 13-metabolite panel at GW 17-19. Dysmetabolism is present early in pregnancy among individuals progressing to GDM. Multimetabolite panels in early pregnancy can predict GDM risk beyond conventional risk factors.
© 2022 by the American Diabetes Association.
Figures
Comment in
-
Metabolomic Markers in Early Pregnancy for Gestational Diabetes Mellitus.Diabetes. 2022 Aug 1;71(8):1620-1622. doi: 10.2337/dbi22-0015. Diabetes. 2022. PMID: 35881833 Free PMC article. No abstract available.
Similar articles
-
Microbiome-derived metabolites in early to mid-pregnancy and risk of gestational diabetes: a metabolome-wide association study.BMC Med. 2024 Oct 11;22(1):449. doi: 10.1186/s12916-024-03606-6. BMC Med. 2024. PMID: 39394552 Free PMC article.
-
In utero metabolomic signatures of refined grain intake and risk of gestational diabetes: A metabolome-wide association study.Am J Clin Nutr. 2023 Apr;117(4):731-740. doi: 10.1016/j.ajcnut.2023.02.009. Epub 2023 Feb 11. Am J Clin Nutr. 2023. PMID: 36781127 Free PMC article.
-
Metabolomic profiling reveals early biomarkers of gestational diabetes mellitus and associated hepatic steatosis.Cardiovasc Diabetol. 2025 Mar 20;24(1):125. doi: 10.1186/s12933-025-02645-4. Cardiovasc Diabetol. 2025. PMID: 40114104 Free PMC article.
-
Metabolomics in gestational diabetes.Clin Chim Acta. 2017 Dec;475:116-127. doi: 10.1016/j.cca.2017.10.019. Epub 2017 Oct 21. Clin Chim Acta. 2017. PMID: 29066210 Review.
-
Metabolomic Biomarkers in Gestational Diabetes Mellitus: A Review of the Evidence.Int J Mol Sci. 2021 May 24;22(11):5512. doi: 10.3390/ijms22115512. Int J Mol Sci. 2021. PMID: 34073737 Free PMC article. Review.
Cited by
-
The role of lipid dysregulation in gestational diabetes mellitus: Early prediction and postpartum prognosis.J Diabetes Investig. 2024 Jan;15(1):15-25. doi: 10.1111/jdi.14119. Epub 2023 Dec 14. J Diabetes Investig. 2024. PMID: 38095269 Free PMC article. Review.
-
Combined Exposures and Mixtures Research: An Enduring NIEHS Priority.Environ Health Perspect. 2024 Jul;132(7):75001. doi: 10.1289/EHP14340. Epub 2024 Jul 5. Environ Health Perspect. 2024. PMID: 38968090 Free PMC article.
-
From Glucotoxicity to Lung Injury: Emerging Perspectives on Diabetes-Associated Respiratory Complications.Lung. 2025 Jul 15;203(1):80. doi: 10.1007/s00408-025-00834-2. Lung. 2025. PMID: 40665066 Review.
-
Interaction and Metabolic Pathways: Elucidating the Role of Gut Microbiota in Gestational Diabetes Mellitus Pathogenesis.Metabolites. 2024 Jan 10;14(1):43. doi: 10.3390/metabo14010043. Metabolites. 2024. PMID: 38248846 Free PMC article. Review.
-
Urinary Aromatic Amino Acid Metabolites Associated With Postoperative Emergence Agitation in Paediatric Patients After General Anaesthesia: Urine Metabolomics Study.Front Pharmacol. 2022 Jul 19;13:932776. doi: 10.3389/fphar.2022.932776. eCollection 2022. Front Pharmacol. 2022. PMID: 35928271 Free PMC article.
References
-
- Ferrara A, Kahn HS, Quesenberry CP, Riley C, Hedderson MM. An increase in the incidence of gestational diabetes mellitus: northern California, 1991-2000. Obstet Gynecol 2004;103:526–533 - PubMed
-
- McIntyre HD, Catalano P, Zhang C, Desoye G, Mathiesen ER, Damm P. Gestational diabetes mellitus. Nat Rev Dis Primers 2019;5:47. - PubMed
-
- Powe CE. Early pregnancy biochemical predictors of gestational diabetes mellitus. Curr Diab Rep 2017;17:1–10 - PubMed
