Review
. 2022 May;130(5):57005.
doi: 10.1289/EHP6779. Epub 2022 May 9.

On the Utility of ToxCast-Based Predictive Models to Evaluate Potential Metabolic Disruption by Environmental Chemicals

Affiliations
Review

On the Utility of ToxCast-Based Predictive Models to Evaluate Potential Metabolic Disruption by Environmental Chemicals

Dayne L Filer et al. Environ Health Perspect. 2022 May.

Abstract

Background: Research suggests environmental contaminants can impact metabolic health; however, high costs prohibit in vivo screening of putative metabolic disruptors. High-throughput screening programs, such as ToxCast, hold promise to reduce testing gaps and prioritize higher-order (in vivo) testing.

Objectives: We sought to a) examine the concordance of in vitro testing in 3T3-L1 cells to a targeted literature review for 38 semivolatile environmental chemicals, and b) assess the predictive utility of various expert models using ToxCast data against the set of 38 reference chemicals.

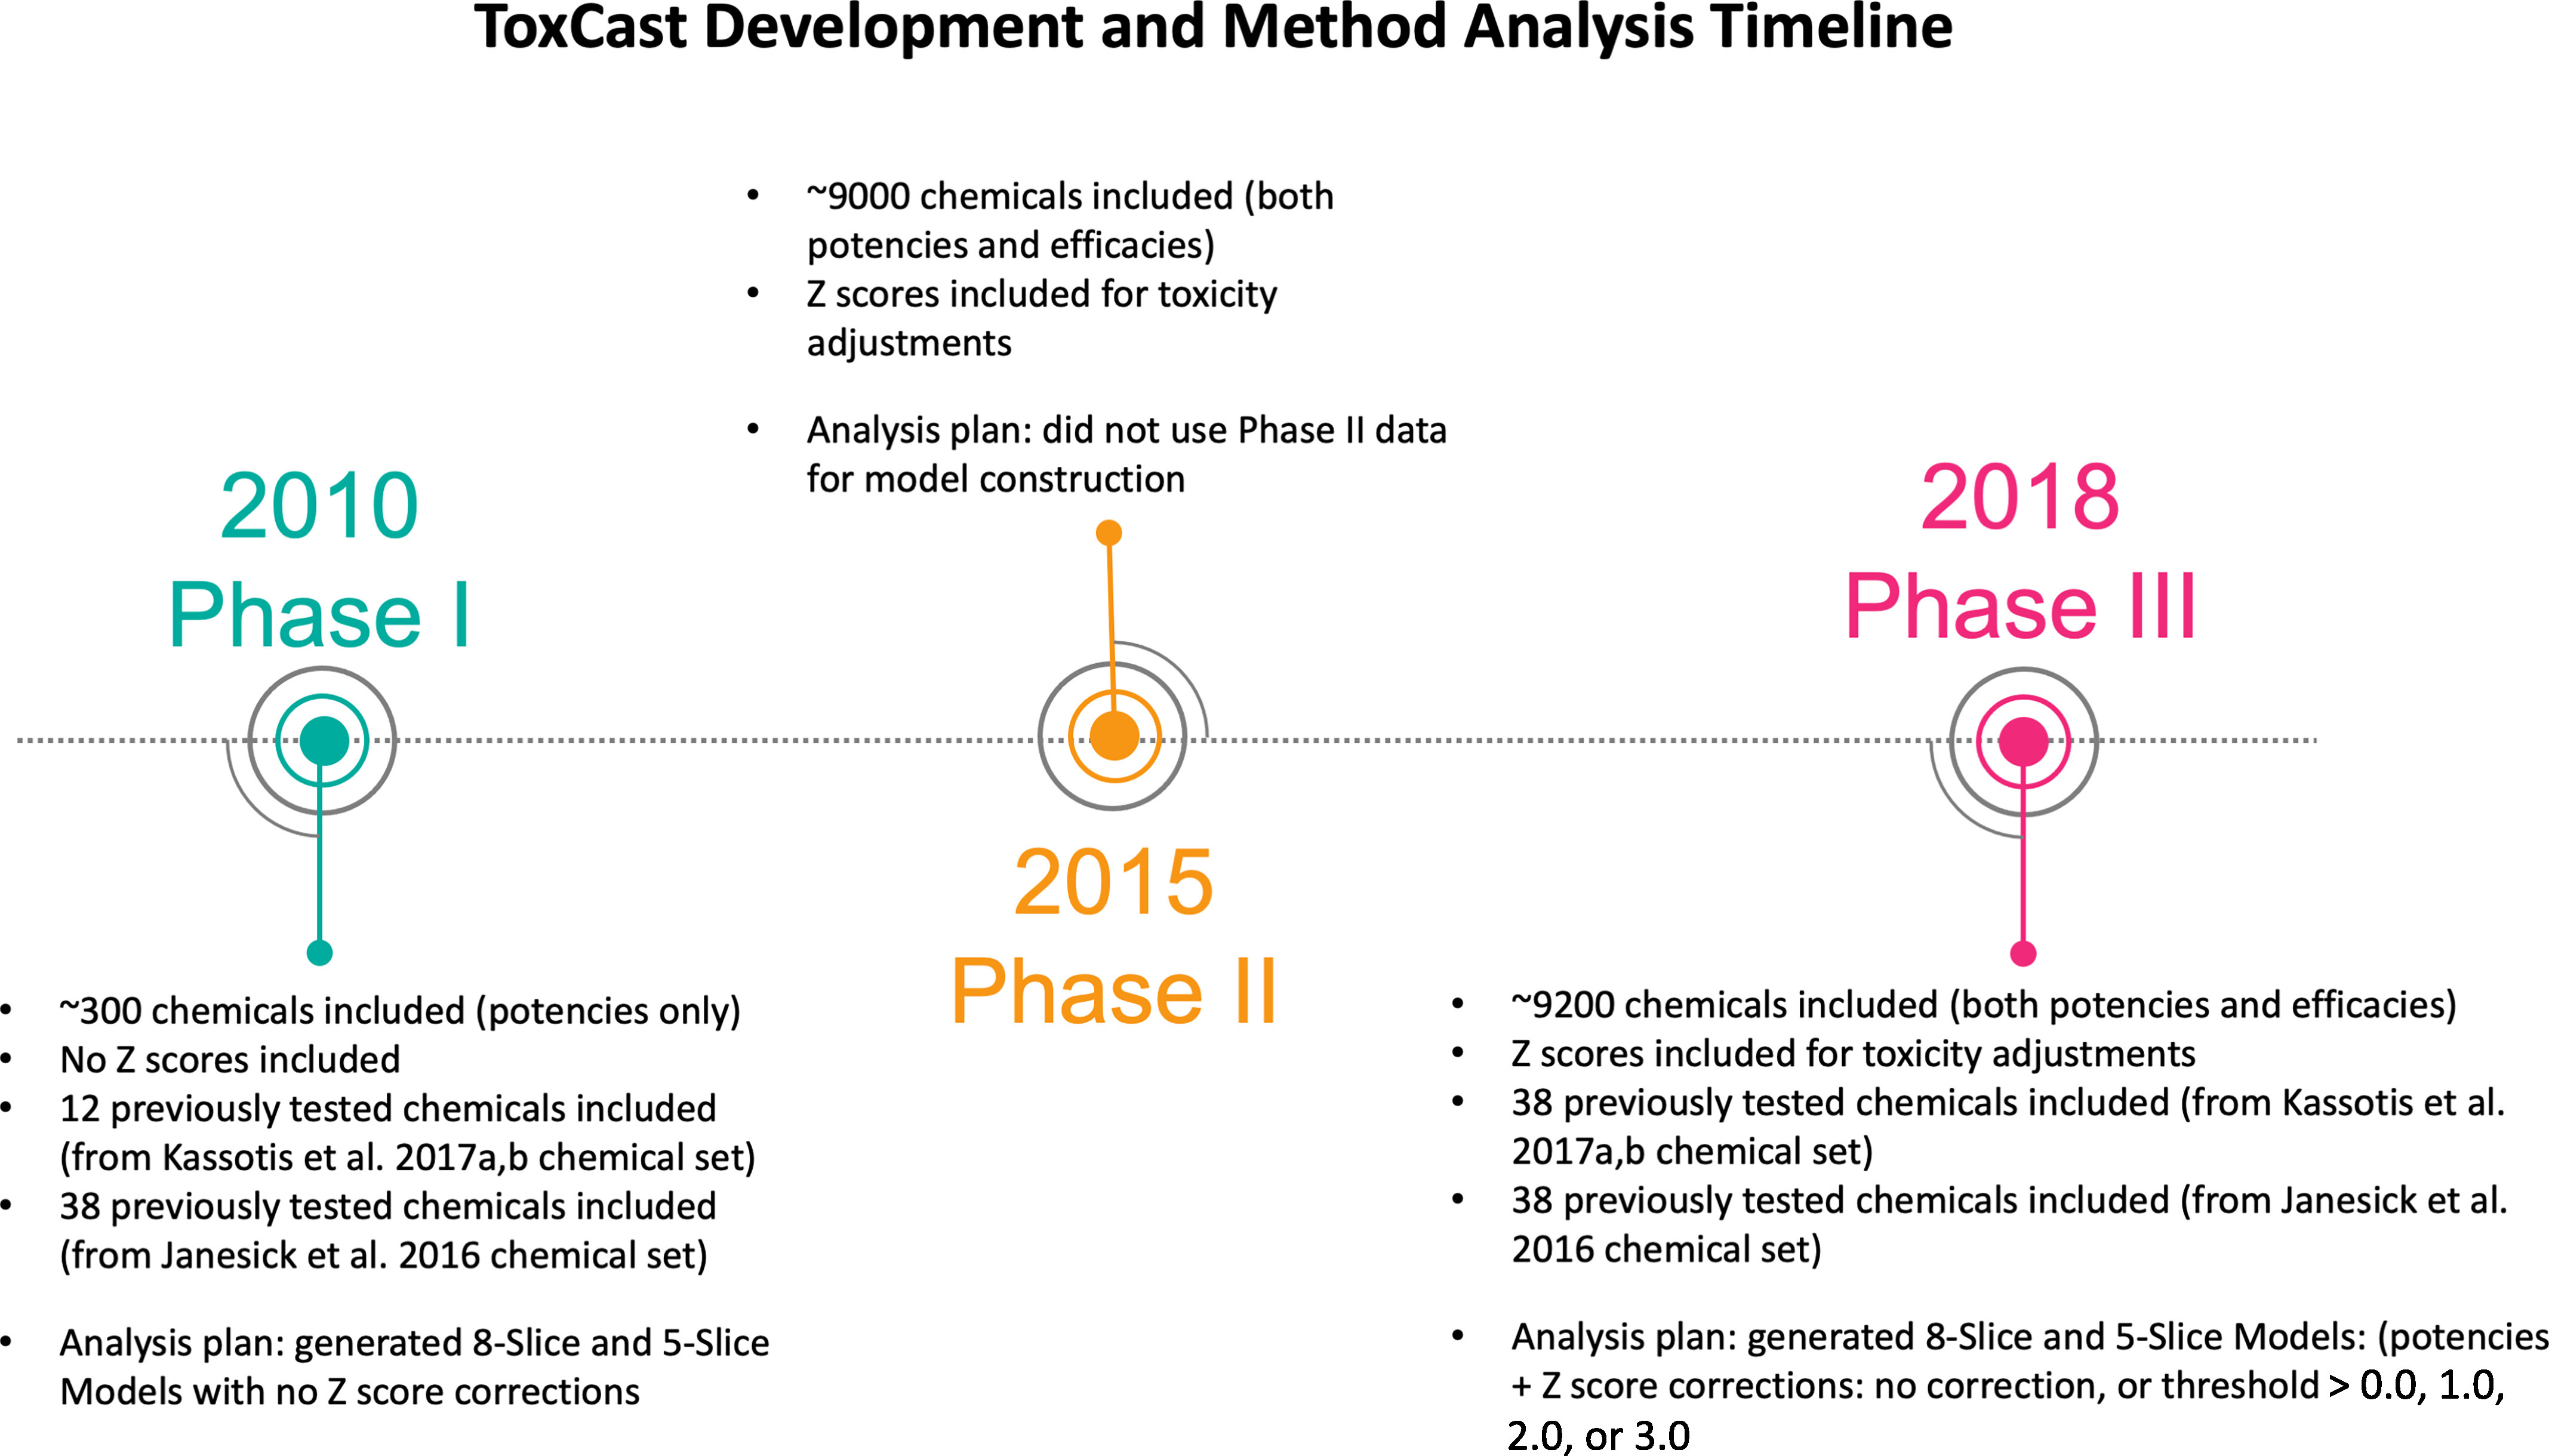
Methods: Using a set of 38 chemicals with previously published results in 3T3-L1 cells, we performed a metabolism-targeted literature review to determine consensus activity determinations. To assess ToxCast predictive utility, we used two published ToxPi models: a) the 8-Slice model published by Janesick et al. (2016) and b) the 5-Slice model published by Auerbach et al. (2016). We examined the performance of the two models against the Janesick in vitro results and our own 38-chemical reference set. We further evaluated the predictive performance of various modifications to these models using cytotoxicity filtering approaches and validated our best-performing model with new chemical testing in 3T3-L1 cells.

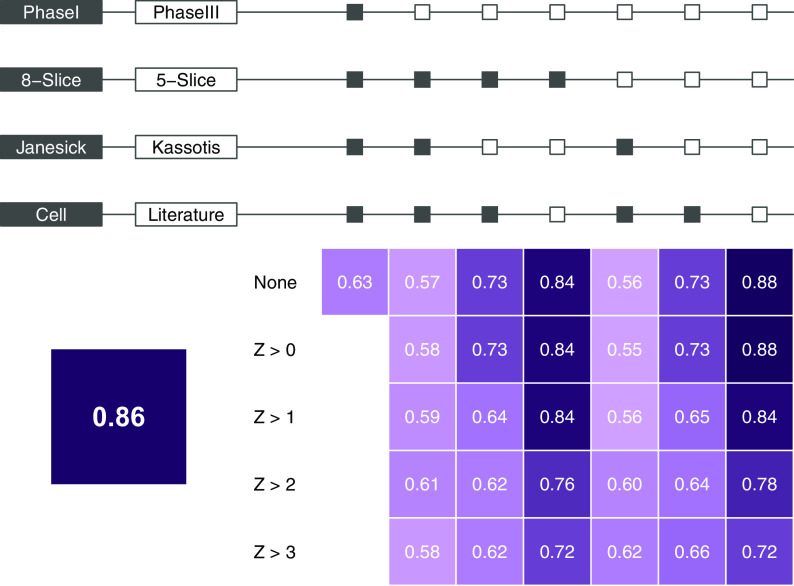
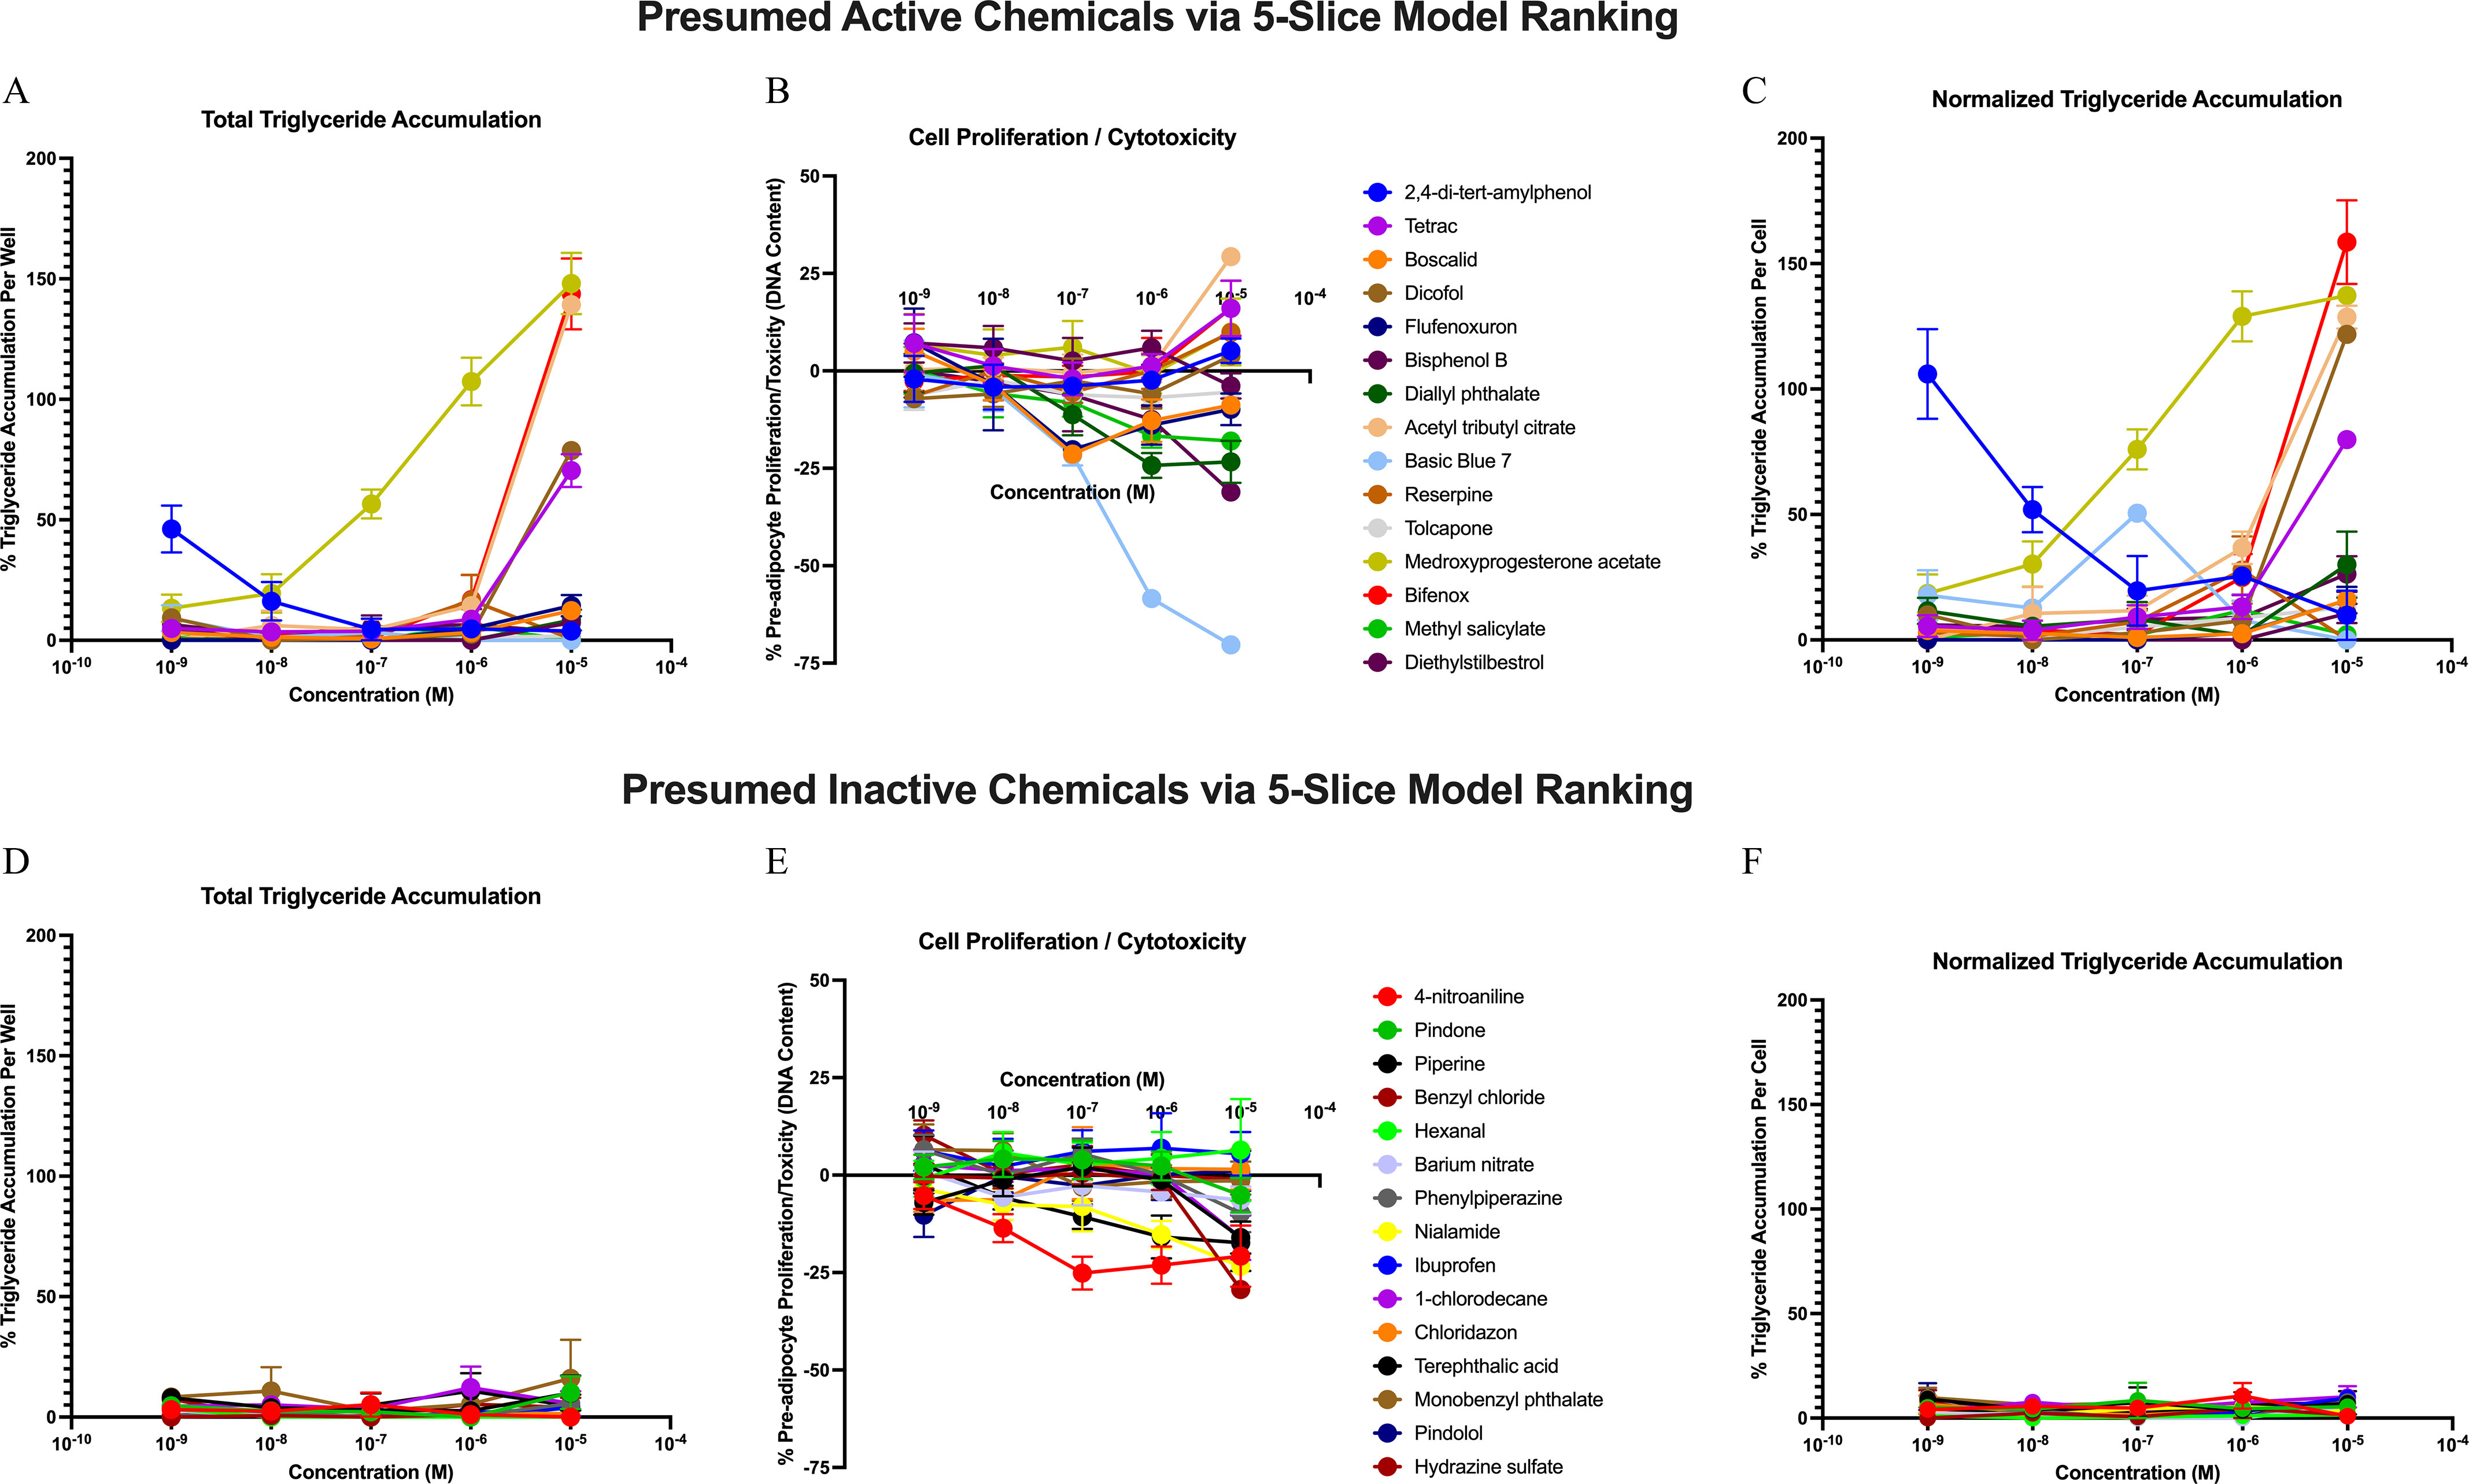
Results: The literature review revealed relevant publications for 30 out of the 38 chemicals (the remaining 8 chemicals were only examined in our previous 3T3-L1 testing). We observed a balanced accuracy (average of sensitivity and specificity) of 0.86 comparing our previous in vitro results to the literature-derived calls. ToxPi models provided balanced accuracies ranging from 0.55 to 0.88, depending on the model specifications and reference set. Validation chemical testing correctly predicted 29 of 30 chemicals as per 3T3-L1 testing, suggesting good adipogenic prediction performance for our best adapted model.

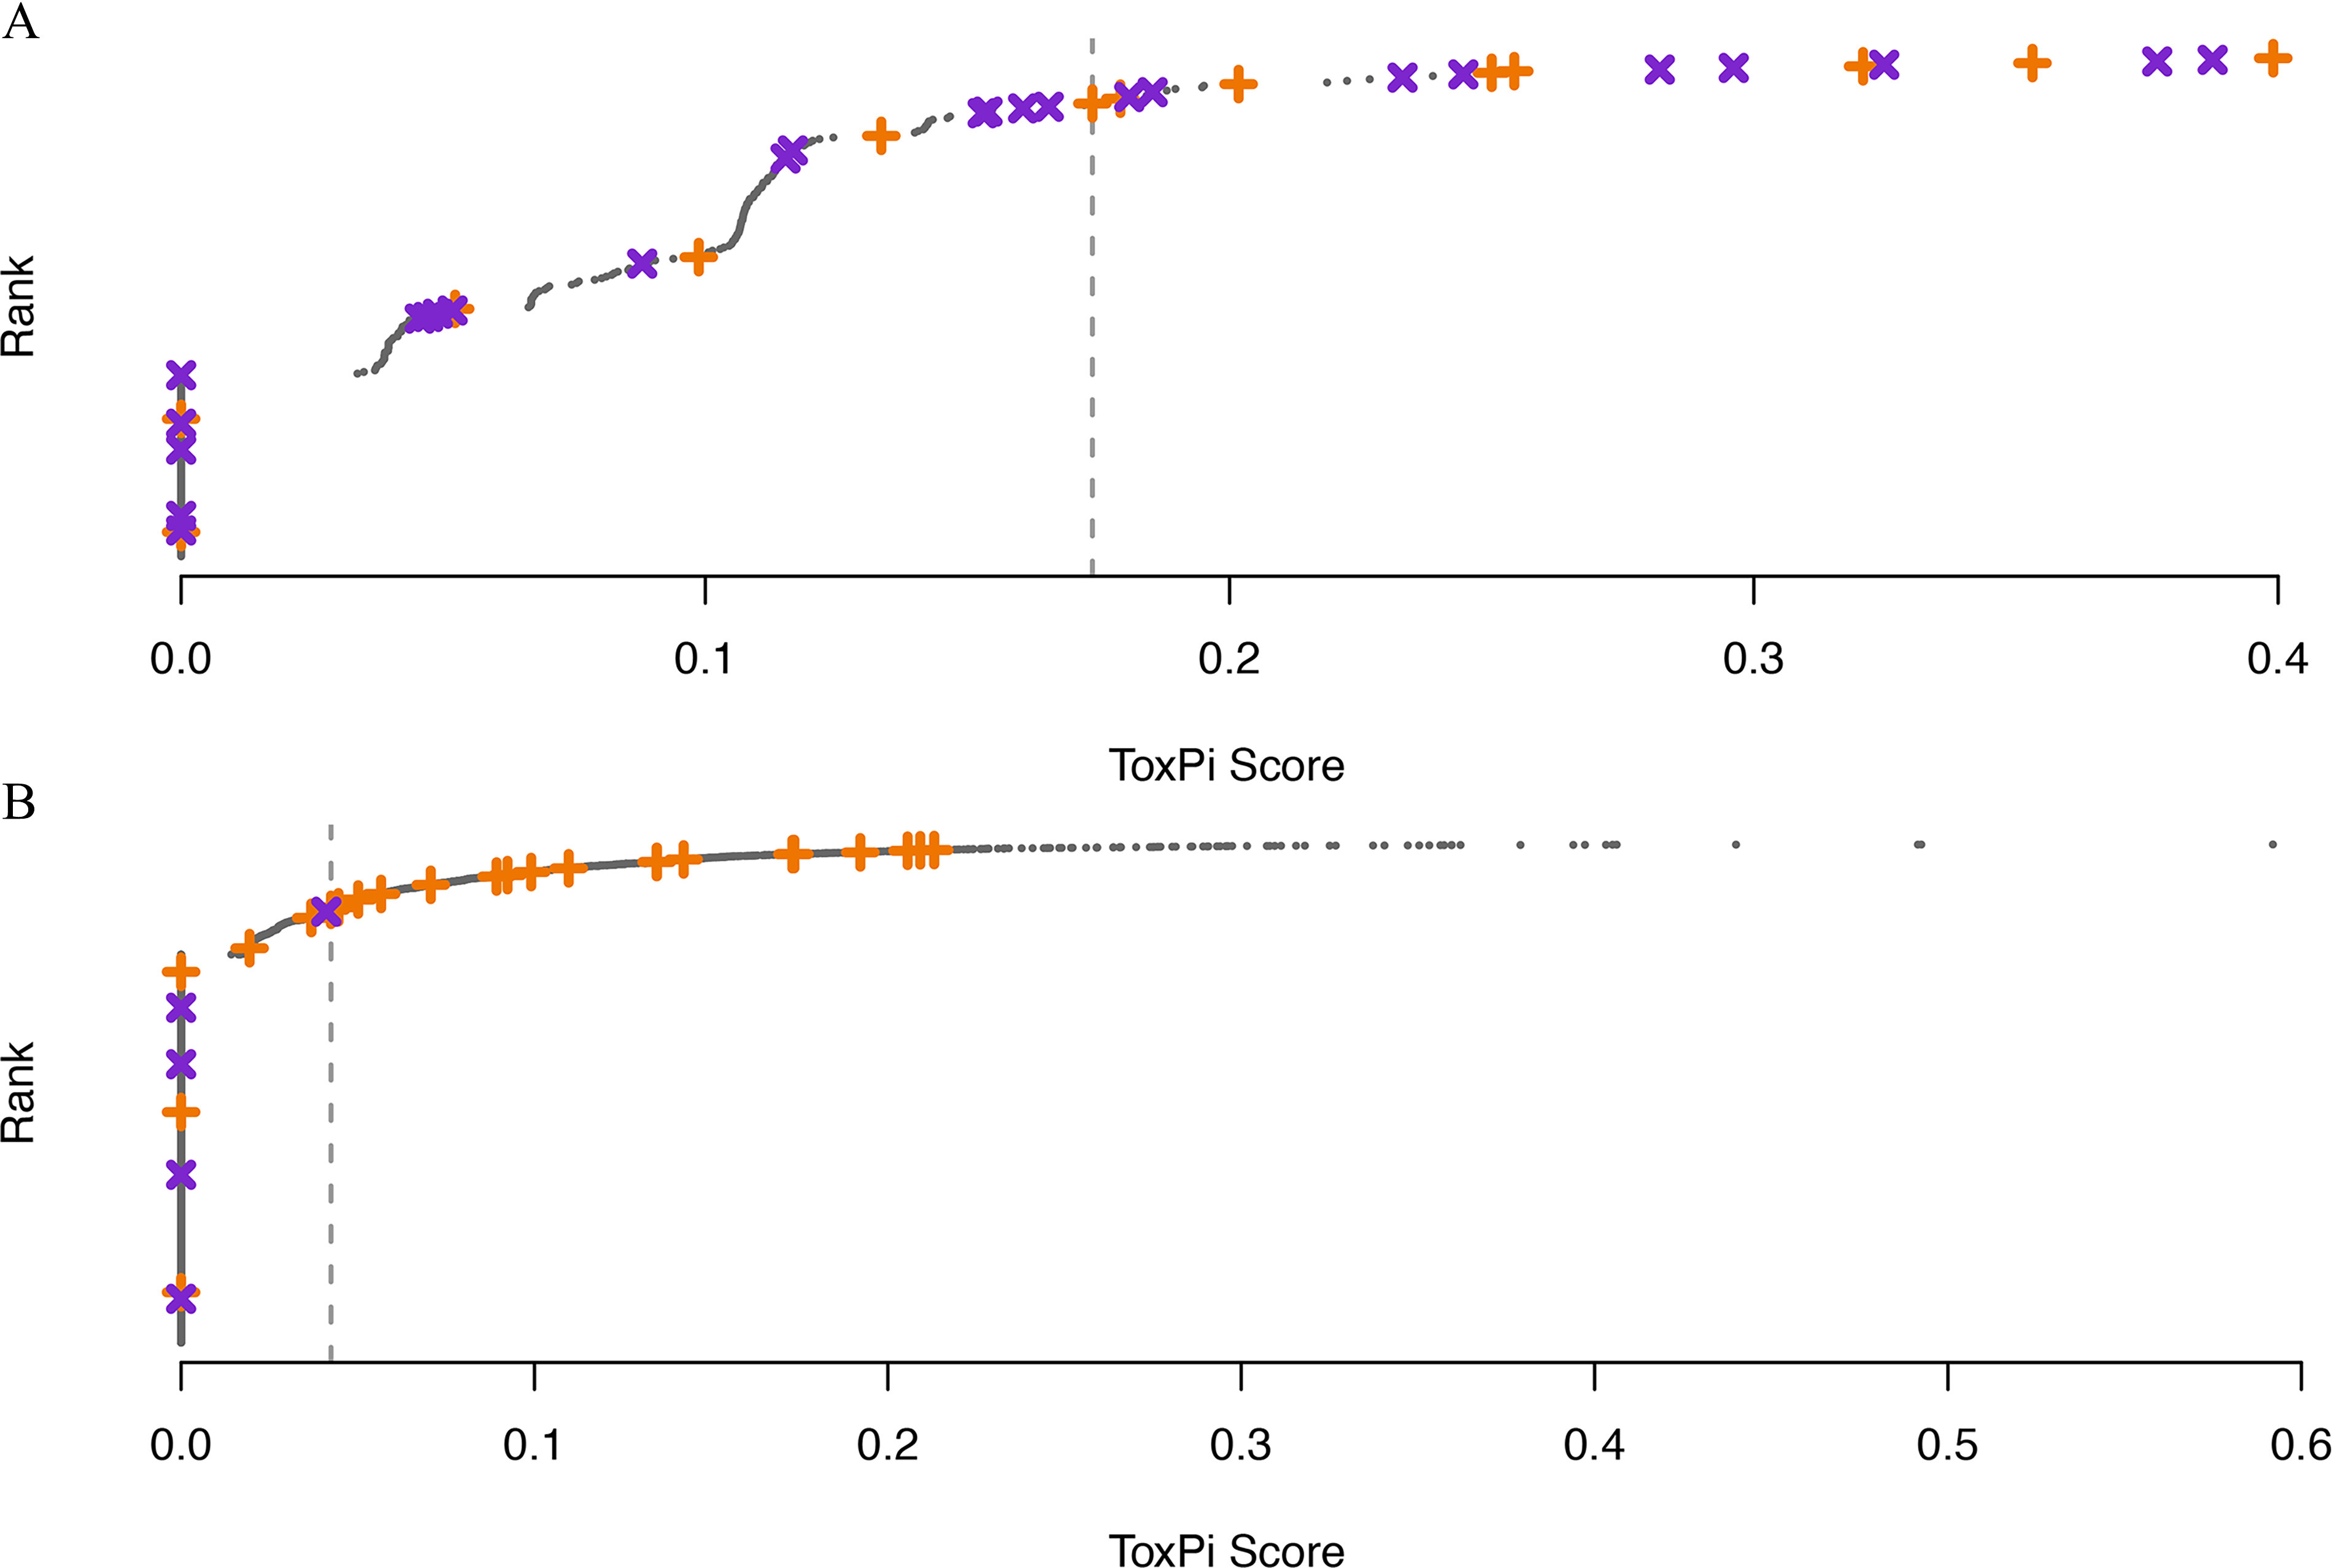
Discussion: Using the most recent ToxCast data and an updated ToxPi model, we found ToxCast performed similarly to that of our own 3T3-L1 testing in predicting consensus calls. Furthermore, we provide the full ranked list of largely untested chemicals with ToxPi scores that predict adipogenic activity and that require further investigation. https://doi.org/10.1289/EHP6779.


Figures

Figure 1 is a timeline depicting ToxCast Development and Method Analysis. The timeline displays the following information: 2010, Phase 1: Approximately 300 chemicals included (potencies only); No Z scores included 12 previously tested chemicals included (from Kassotis and others 2017a, 2017b chemical set); 38 previously tested chemicals included (from Janesick and others 2016 chemical set); and Analysis plan: generated 8-Slice and 5-Slice models with no Z score corrections. 2015, Phase 2: Approximately 9000 chemicals included (both potencies and efficacies); Z scores included for toxicity adjustments; and Analysis plan: did not use phase 2 data for model construction. 2018, Phase 3: Approximately 9200 chemicals included (both potencies and efficacies; Z scores included for toxicity adjustments; 38 previously tested chemicals included (from Kassotis and others 2017a, 2017b chemical set); 38 previously tested chemicals included (from Janesick and others 2016 chemical set); and Analysis plan: generated 8-Slice and 5-Slice models; (potencies plus Z score corrections: no correction, or threshold greater than 0.0, 1.0, 2.0, or 3.0).
Figure 1.
ToxCast Development and Method Analysis Timeline. Timeline of the varying phases of ToxCast data releases, the overall data provided by those data releases, and the subsequent predictive models generated for each phase of data release.
Figure 2 is a set of one table and one box matrix. The tabular representation depicts the model and reference set in nine columns. The first two columns, lists parameters for the various models and the last seven columns, lists positives and negatives. The box matrix has eight columns, depicting input parameters for the various models and five rows, depicting cytotoxicity filtering levels. The box on the bottom left with a text that reads 0.86 depicts the balanced accuracy.
Figure 2.
Balanced accuracy for all combinations of model and reference set. The large box (bottom left) gives the balanced accuracy (the average of sensitivity and specificity; correcting accuracy for the imbalance in classes, e.g., positives and negatives), using the Kassotis et al. 2017 3T3-L1 results to predict the literature consensus calls for reference. Each row in the box matrix represents cytotoxicity filtering levels; “None” represents no filtering/adjustment, and z-score>n represents the z-score cutoff for the filter-and-add adjustment (see “Methods” section). Each column represents (from top to bottom) the other input parameters for the various models, including ToxCast release (Phase I vs. III), model (8-Slice vs. 5-Slice), reference set source (Janesick et al. 2016 chemical set vs. Kassotis et al. 2017 chemical set), and reference set type (cell assay results vs. literature results). The dark and light boxes above the matrix indicate characteristics of the model specified. For example, the entry in row 1 and column 5 represents Phase III data, the 5-Slice model, and using the Janesick et al. 2016 cell 3T3-L1 results without any z-score filtering. Darker boxes indicate higher balanced accuracy values. Blank entries were not computed.
Figures 3A and 3B are dot graphs, plotting rank (y-axis) across ToxPi Scores, ranging from 0.0 to 0.2 in increments of 0.1 (x-axis). The vertical dashed line in both the graphs depict the optimal cut point which is based on the reference set.
Figure 3.
Ranked ToxPi scores showing the distribution of reference chemicals. Orange “+” indicates a positive reference chemical; purple “x” indicates a negative reference chemical. Vertical dashed line shows the optimal cut point (maximizing the sum of sensitivity and specificity) based on the reference set; any chemicals to the right of the dashed line are predicted to be positive via the ToxPi model. (A) 8-Slice model calculated on Phase I data compared with Janesick et al. 2016 3T3-L1 results. (B) 5-Slice model calculated on Phase III data without cytotoxicity filtering compared with literature consensus calls. Data used to generate these figures can be found in supplemental Excel Tables S6 (A) and S12 (B) and supplemental files: 1, “Data Download and Setup”; 2, “Create Models”; and 3, “Model Results.” “Worked” example of this code is also made available at https://daynefiler.com/kassotis2020/.
Figures 4A to 4C are line graphs titled Total triglyceride Accumulation, Cell proliferation or Cytotoxicity, Normalized triglyceride Accumulation under Presumed active chemicals via 5-Slice model ranking, plotting percentage triglyceride Accumulation per well, ranging from 0 to 200 in increments of 50; percentage pre-adipocyte proliferation per toxicity (D N A content), ranging from negative 75 to 50 in increments of 25; and percentage triglyceride Accumulation per cell, ranging from 0 to 200 in increments of 50 (y-axis) across Concentration (molar), ranging as 10 begin superscript negative 10 end superscript, 10 begin superscript negative 9 end superscript, 10 begin superscript negative 8 end superscript, 10 begin superscript negative 7 end superscript, 10 begin superscript negative 6 end superscript, 10 begin superscript negative 5 end superscript, and 10 begin superscript negative 4 end superscript; 10 begin superscript negative 9 end superscript, 10 begin superscript negative 8 end superscript, 10 begin superscript negative 7 end superscript, 10 begin superscript negative 6 end superscript, 10 begin superscript negative 5 end superscript, and 10 begin superscript negative 4 end superscript; and 10 begin superscript negative 10 end superscript, 10 begin superscript negative 9 end superscript, 10 begin superscript negative 8 end superscript, 10 begin superscript negative 7 end superscript, 10 begin superscript negative 6 end superscript, and 10 begin superscript negative 5 end superscript (x-axis) for 2,4-di-tert-amylphenol; Tetrac; Boscalid; Dicofol; Flufenoxuron, Bisphenol B, Diallyl phthalate, Acetyl tributyl citrate, Basic Blue 7, Reserpine, Tolcapone, Medroxyprogesterone acetate, Bifenox, Methyl salicylate, and Diethylstilbestrol, respectively. Figures 4D to 4F are line graphs titled Total triglyceride Accumulation, Cell proliferation or Cytotoxicity, Normalized triglyceride Accumulation under Presumed inactive chemicals via 5-Slice model ranking, plotting percentage triglyceride Accumulation per well, ranging from 0 to 200 in increments of 50; percentage pre-adipocyte proliferation per toxicity (D N A content), ranging from negative 75 to 50 in increments of 25; and percentage triglyceride Accumulation per cell, ranging from 0 to 200 in increments of 50 (y-axis) across Concentration (molar), ranging as 10 begin superscript negative 10 end superscript, 10 begin superscript negative 9 end superscript, 10 begin superscript negative 8 end superscript, 10 begin superscript negative 7 end superscript, 10 begin superscript negative 6 end superscript, 10 begin superscript negative 5 end superscript, and 10 begin superscript negative 4 end superscript; 10 begin superscript negative 9 end superscript, 10 begin superscript negative 8 end superscript, 10 begin superscript negative 7 end superscript, 10 begin superscript negative 6 end superscript, 10 begin superscript negative 5 end superscript, and 10 begin superscript negative 4 end superscript; and 10 begin superscript negative 10 end superscript, 10 begin superscript negative 9 end superscript, 10 begin superscript negative 8 end superscript, 10 begin superscript negative 7 end superscript, 10 begin superscript negative 6 end superscript, 10 begin superscript negative 5 end superscript, and 10 begin superscript negative 4 end superscript (x-axis) for 4-nitroaniline, Pindone, Piperine, Benzyl chloride, Hexanal, Barium Nitrate, Phenylpiperazine, Nialamide, Ibuprofen, 1-Chlorodecane, Choridazon, Terephthalic acid, Monobenzyl phthalate, Pindolol, and Hydrazine sulfate, respectively.
Figure 4.
Adipogenic Testing of Validated Test Chemical Set. 3T3-L1 cells were differentiated as described in the “Methods” section and exposed to dose responses of 30 ranked ToxCast chemicals, then assayed to assess triglyceride accumulation relative to the maximal rosiglitazone positive control response and preadipocyte proliferation (DNA content) relative to the average differentiated solvent control response. Results provided are average responses±standard error of the mean based on three biological replicates and four technical replicates within each. (A–C) adipogenic activity testing for the 15 predicted active chemicals based on 5-Slice model rankings; (A) total triglyceride accumulation per well relative to maximal rosiglitazone-induced response; (B) DNA content relative to differentiated solvent control (increase from zero denotes proliferation, whereas a decrease denotes cytotoxicity); (C) normalized triglyceride accumulation (normalized to DNA content) relative to maximal rosiglitazone-induced response. (D–F) adipogenic activity testing for the 15 predicted inactive chemicals based on 5-Slice model rankings. Gross activity outcomes (active/inactive) for triglyceride accumulation and/or proliferation are provided in Table 2. Source data for each chemical at each concentration is provided in Excel Table S18.

Similar articles

Cited by

References

    1. Albers PH, Klein PN, Green DE, Melancon MJ, Bradley BP, Noguchi G. 2006. Chlorfenapyr and mallard ducks: overview, study design, macroscopic effects, and analytical chemistry. Environ Toxicol Chem 25(2):438–445, PMID: , 10.1897/05-004r.1. - DOI - PubMed
    1. Anderson LA, McTernan PG, Barnett AH, Kumar S. 2001. The effects of androgens and estrogens on preadipocyte proliferation in human adipose tissue: influence of gender and site. J Clin Endocrinol Metab 86(10):5045–5051, PMID: , 10.1210/jcem.86.10.7955. - DOI - PubMed
    1. Andrews FV, Kim SM, Edwards L, Schlezinger JJ. 2020. Identifying adipogenic chemicals: disparate effects in 3T3-L1, OP9 and primary mesenchymal multipotent cell models. Toxicol in Vitro 67:104904, PMID: , 10.1016/j.tiv.2020.104904. - DOI - PMC - PubMed
    1. Angle BM, Do RP, Ponzi D, Stahlhut RW, Drury BE, Nagel SC, et al. . 2013. Metabolic disruption in male mice due to fetal exposure to low but not high doses of bisphenol A (BPA): evidence for effects on body weight, food intake, adipocytes, leptin, adiponectin, insulin and glucose regulation. Reprod Toxicol 42:13, PMID: , 10.1016/j.reprotox.2013.07.017. - DOI - PMC - PubMed
    1. Attene-Ramos MS, Miller N, Huang R, Michael S, Itkin M, Kavlock RJ, et al. . 2013. The Tox21 robotic platform for the assessment of environmental chemicals–from vision to reality. Drug Discov Today 18(15–16):716–723, PMID: , 10.1016/j.drudis.2013.05.015. - DOI - PMC - PubMed

LinkOut - more resources