rECHOmmend: An ECG-Based Machine Learning Approach for Identifying Patients at Increased Risk of Undiagnosed Structural Heart Disease Detectable by Echocardiography
- PMID: 35533093
- PMCID: PMC9241668
- DOI: 10.1161/CIRCULATIONAHA.121.057869
rECHOmmend: An ECG-Based Machine Learning Approach for Identifying Patients at Increased Risk of Undiagnosed Structural Heart Disease Detectable by Echocardiography
Abstract
Background: Timely diagnosis of structural heart disease improves patient outcomes, yet many remain underdiagnosed. While population screening with echocardiography is impractical, ECG-based prediction models can help target high-risk patients. We developed a novel ECG-based machine learning approach to predict multiple structural heart conditions, hypothesizing that a composite model would yield higher prevalence and positive predictive values to facilitate meaningful recommendations for echocardiography.
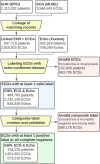
Methods: Using 2 232 130 ECGs linked to electronic health records and echocardiography reports from 484 765 adults between 1984 to 2021, we trained machine learning models to predict the presence or absence of any of 7 echocardiography-confirmed diseases within 1 year. This composite label included the following: moderate or severe valvular disease (aortic/mitral stenosis or regurgitation, tricuspid regurgitation), reduced ejection fraction <50%, or interventricular septal thickness >15 mm. We tested various combinations of input features (demographics, laboratory values, structured ECG data, ECG traces) and evaluated model performance using 5-fold cross-validation, multisite validation trained on 1 site and tested on 10 independent sites, and simulated retrospective deployment trained on pre-2010 data and deployed in 2010.
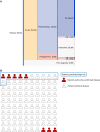
Results: Our composite rECHOmmend model used age, sex, and ECG traces and had a 0.91 area under the receiver operating characteristic curve and a 42% positive predictive value at 90% sensitivity, with a composite label prevalence of 17.9%. Individual disease models had area under the receiver operating characteristic curves from 0.86 to 0.93 and lower positive predictive values from 1% to 31%. Area under the receiver operating characteristic curves for models using different input features ranged from 0.80 to 0.93, increasing with additional features. Multisite validation showed similar results to cross-validation, with an aggregate area under the receiver operating characteristic curve of 0.91 across our independent test set of 10 clinical sites after training on a separate site. Our simulated retrospective deployment showed that for ECGs acquired in patients without preexisting structural heart disease in the year 2010, 11% were classified as high risk and 41% (4.5% of total patients) developed true echocardiography-confirmed disease within 1 year.
Conclusions: An ECG-based machine learning model using a composite end point can identify a high-risk population for having undiagnosed, clinically significant structural heart disease while outperforming single-disease models and improving practical utility with higher positive predictive values. This approach can facilitate targeted screening with echocardiography to improve underdiagnosis of structural heart disease.
Keywords: cardiomyopathies; echocardiography; electrocardiography; heart valve diseases; machine learning; ventricular dysfunction.
Figures


References
-
- Ross J, Jr, Braunwald E. Aortic stenosis. Circulation. 1968;38(1 Suppl):61–67. doi: 10.1161/01.cir.38.1s5.v-61 - PubMed
-
- Cheitlin MD, Gertz EW, Brundage BH, Carlson CJ, Quash JA, Bode RS, Jr. Rate of progression of severity of valvular aortic stenosis in the adult. Am Heart J. 1979;98:689–700. doi: 10.1016/0002-8703(79)90465-4 - PubMed
-
- Davies SW, Gershlick AH, Balcon R. Progression of valvar aortic stenosis: a long-term retrospective study. Eur Heart J. 1991;12:10–14. doi: 10.1093/oxfordjournals.eurheartj.a059815 - PubMed
-
- Curtis JP, Sokol SI, Wang Y, Rathore SS, Ko DT, Jadbabaie F, Portnay EL, Marshalko SJ, Radford MJ, Krumholz HM. The association of left ventricular ejection fraction, mortality, and cause of death in stable outpatients with heart failure. J Am Coll Cardiol. 2003;42:736–742. doi: 10.1016/s0735-1097(03)00789-7 - PubMed
-
- Martinez-Naharro A, Baksi AJ, Hawkins PN, Fontana M. Diagnostic imaging of cardiac amyloidosis. Nat Rev Cardiol. 2020;17:413–426. doi: 10.1038/s41569-020-0334-7 - PubMed
Publication types
MeSH terms
LinkOut - more resources
Full Text Sources
Other Literature Sources
Medical

