. 2022 May 9;18(5):e1010494.
doi: 10.1371/journal.ppat.1010494. eCollection 2022 May.

Multi-omics analysis of the cervical epithelial integrity of women using depot medroxyprogesterone acetate

Affiliations

Multi-omics analysis of the cervical epithelial integrity of women using depot medroxyprogesterone acetate

Frideborg Bradley et al. PLoS Pathog. .

Abstract

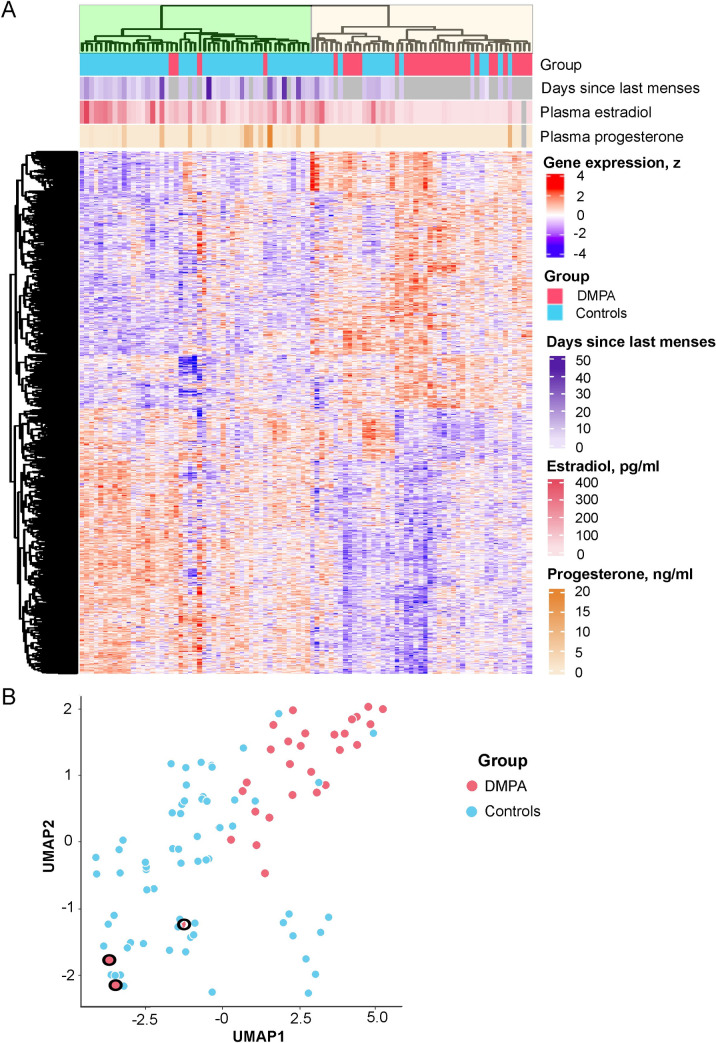
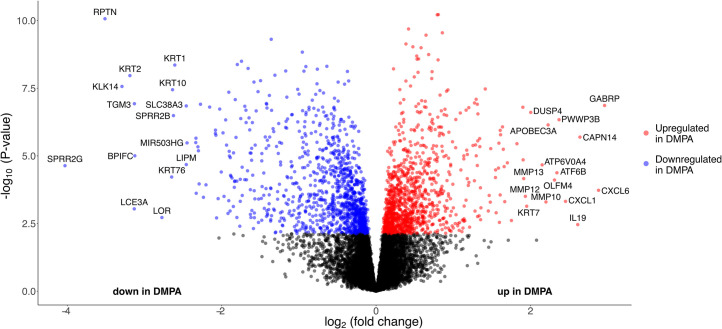
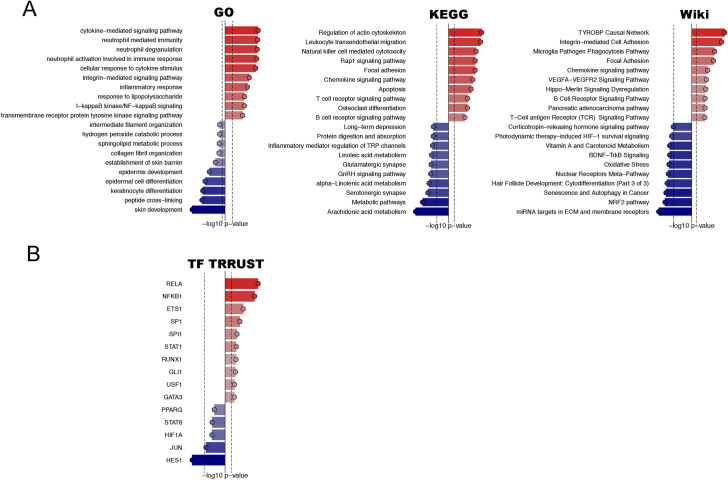
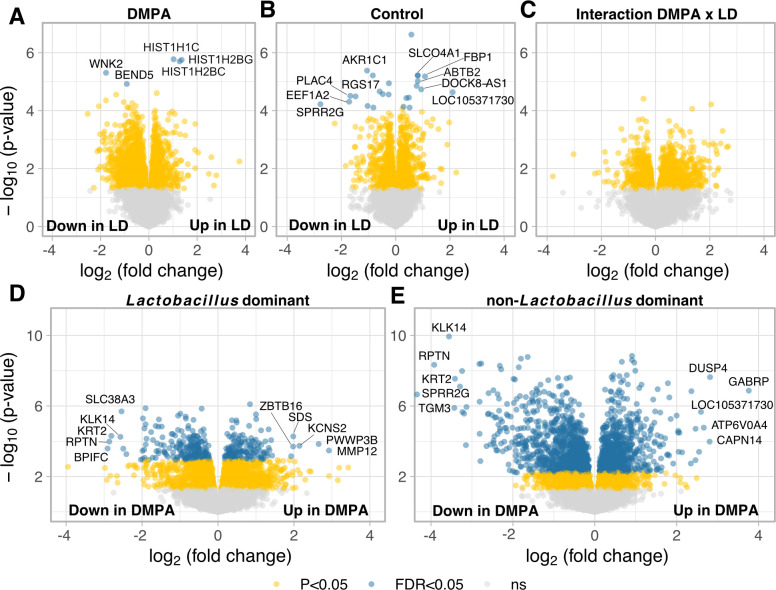
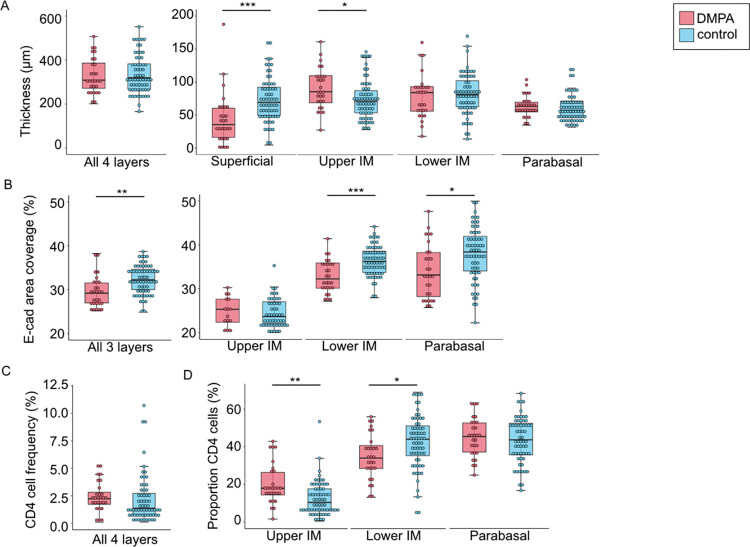
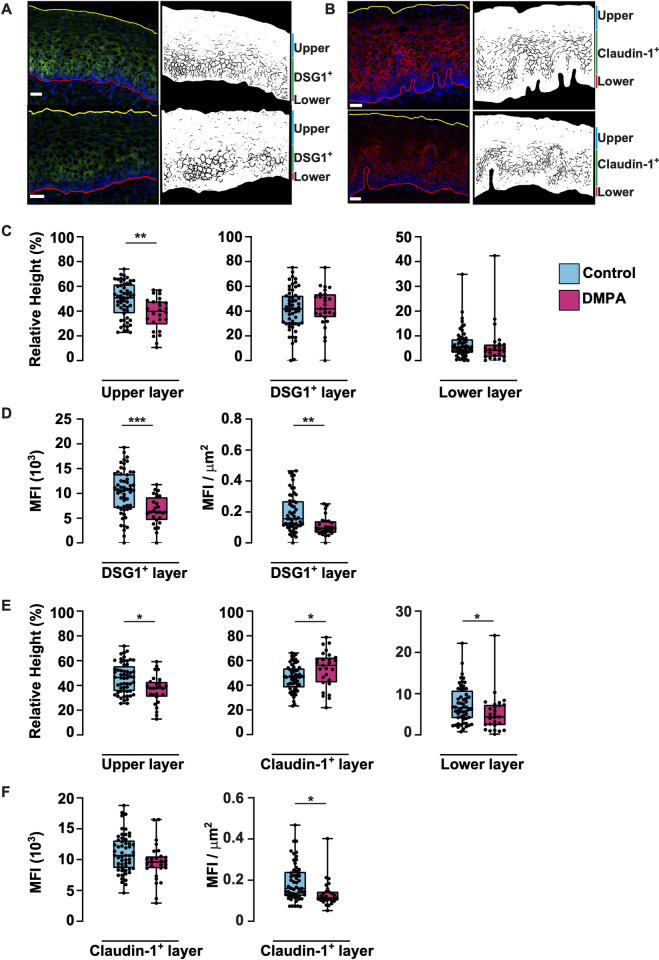
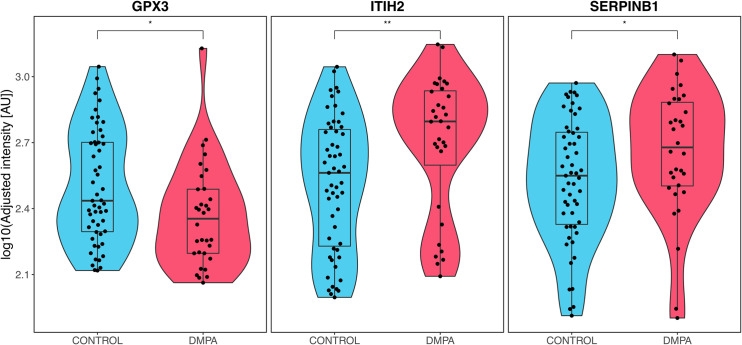
Depot medroxyprogesterone acetate (DMPA) is an injectable hormonal contraceptive used by millions of women worldwide. However, experimental studies have associated DMPA use with genital epithelial barrier disruption and mucosal influx of human immunodeficiency virus (HIV) target cells. We explored the underlying molecular mechanisms of these findings. Ectocervical biopsies and cervicovaginal lavage (CVL) specimens were collected from HIV-seronegative Kenyan sex workers using DMPA (n = 32) or regularly cycling controls (n = 64). Tissue samples were assessed by RNA-sequencing and quantitative imaging analysis, whereas protein levels were measured in CVL samples. The results suggested a DMPA-associated upregulation of genes involved in immune regulation, including genes associated with cytokine-mediated signaling and neutrophil-mediated immunity. A transcription factor analysis further revealed DMPA-associated upregulation of RELA and NFKB1 which are involved in several immune activation pathways. Several genes significantly downregulated in the DMPA versus the control group were involved in epithelial structure and function, including genes encoding keratins, small proline-rich proteins, and cell-cell adhesion proteins. Pathway analyses indicated DMPA use was associated with immune activation and suppression of epithelium development, including keratinization and cornification processes. The cervicovaginal microbiome composition (Lactobacillus dominant and non-Lactobacillus dominant) had no overall interactional impact on the DMPA associated tissue gene expression. Imaging analysis verified that DMPA use was associated with an impaired epithelial layer as illustrated by staining for the selected epithelial junction proteins E-cadherin, desmoglein-1 and claudin-1. Additional staining for CD4+ cells revealed a more superficial location of these cells in the ectocervical epithelium of DMPA users versus controls. Altered protein levels of SERPINB1 and ITIH2 were further observed in the DMPA group. Identification of specific impaired epithelial barrier structures at the gene expression level, which were verified at the functional level by tissue imaging analysis, illustrates mechanisms by which DMPA adversely may affect the integrity of the genital mucosa.


Conflict of interest statement

The authors have declared that no competing interests exist.

Figures

Fig 1
Fig 1. Hierarchical clustering of differentially expressed genes shows separation of DMPA vs. control samples.
A) Heatmap of all 2,317 DEGs (FDR-adjusted P <0.05) identified between the DMPA and the control group. Each sample is represented by a vertical column, and each gene by a horizontal row. The expression of each gene/row is standardized (z) to a mean of 0 and standard deviation of 1. The blue color indicates below average expression while red indicates above average expression. Samples representing the DMPA group are shown in pink and samples from the control group in turquoise. The horizontal bars below groups show days since onset of last menses, plasma estradiol (pg/ml) and plasma progesterone (ng/ml) levels. Samples with missing data for that parameter are shown in grey. The samples clustered into two major groups marked in green and yellow. B) Dimensionality reduction plot (UMAP) of samples based on all DEGs, displaying partially overlapping clusters of DMPA and control samples. Three subjects in the DMPA group exhibited E2 levels >90 pg/mL and are marked with circles in the figure. DEGs: differentially expressed genes. FDR: false discovery rate. UMAP: Uniform manifold approximation and projection.
Fig 2
Fig 2. DMPA use associated with significant changes in genes involved in immune regulation and epithelial barrier structure and function in ectocervical tissue samples.
Volcano plot of all genes in the data set, showing log2FC on the x-axis and -log10 (p-value) on the y-axis. Each gene is represented by a dot. DEGs (FDR-adjusted P <0.05) that are upregulated in the DMPA group are shown in red, and DEGs downregulated in the DMPA group are shown in blue. DEGs: differentially expressed genes. Log2FC: log2 fold change. FDR: false discovery rate.
Fig 3
Fig 3. Gene set enrichment analysis identifies altered pathways involved in immune regulation and epithelial barrier in DMPA users.
A) The DEGs (FDR adj. p <0.05) identified between DMPA users and controls were analyzed for their enrichment in molecular pathways by testing against the databases GO, KEGG and Wiki. The most significant upregulated (red) and downregulated (blue) pathways identified are sorted by p-value. The -log10 (p-value) is shown on the x-axis, the dotted vertical line represents p = 0.01. B) Transcription factors upregulated (red) and downregulated (blue) based on DEGs were identified using the TRRUST database. DEGs: differentially expressed genes. FDR: false discovery rate.
Fig 4
Fig 4. The cervicovaginal microbiome has no interactional impact on the DMPA associated gene expression.
The impact of DMPA usage on gene expression profiles, based on a two-factor interaction model for DMPA and the microbiome (Lactobacillus dominant (LD) and non-Lactobacillus dominant (non-LD). A) Comparison of LD and non-LD groups, in the DMPA samples (18 non-LD vs 14 LD). B) Comparison of LD and non-LD groups, in the control samples (42 non-LD vs 22 LD). C) Testing for an interaction between DMPA and microbiome composition. D-E) Impact of DMPA use in LD (22 controls vs 14 DMPA) and non-LD samples (42 controls vs 18 DMPA), respectively. FDR-adjusted P-value <0.05 is considered significant (blue dots), non-adjusted P-value <0.05 shown in yellow. FDR: false discovery rate.
Fig 5
Fig 5. DMPA use is associated with a thinner superficial layer and a more apical distribution of CD4+-cells.
The study groups were compared for markers of epithelial cell integrity and CD4+ cell distribution. A) Thickness in μm of the total epithelium and of each of the four individual layers (superficial, upper IM, lower IM, and parabasal) of the ectocervical epithelium. B) The percentage of E-cadherin area coverage (% of E-cadherin net area out of the total epithelial area that express E-cadherin); the upper- and lower IM, as well as the parabasal layer. C) The percentage of CD4+ cell frequency (% of positively stained CD4+ area out of total epithelial tissue area. D) The distribution of all CD4+ cells in the different layers in the epithelium is shown as the proportion of % CD4+ cells present in each of the individual layer; upper IM, lower IM and parabasal layers. No CD4+ cells were seen in the superficial layer. Samples from the DMPA group are shown in pink, and from the control group in light blue. Boxplots represent median, IQR, range within 1.5 x IQR (whiskers), outliers represented as dots. Graphs show Mann Whitney U comparisons, p-values were FDR-adjusted by Benjamini-Hochberg test. * FDR adj p<0.05; ** FDR adj p<0.01, *** FDR adj p<0.001. IM: intermediate. IQR: interquartile range. FDR: false discovery rate.
Fig 6
Fig 6. In situ image analysis shows decreased protein expression of desmoglein-1 and claudin-1 in the DMPA group.
Immunofluorescence images of ectocervical tissue sections, and their corresponding digitalized images stained for desmoglein-1 in green (A) and claudin-1 in red (B). All nuclei are stained with DAPI (blue). The immunofluorescence images are selected to represent those study subjects that displayed median values from the corresponding desmoglein-1 and claudin-1 MFI analysis in their respective study group. Images representing the control groups are shown in the upper row and DMPA in the lower row. The apical border (towards the vaginal lumen) is depicted in yellow and the basal line in red. In the digitalized images, the full epithelial area is shown in white and the desmoglein-1+ or the claudin-1+ staining in black. Box plots showing the relative height (%) for the three individual layers based on the desmoglein-1 staining (C), the MFI of the desmoglein-1+ layer including the MFI/ μm2 (D) as well as the relative height (%) based on claudin-1 staining (E) and the MFI of the claudin-1+ layer including the MFI/μm2 (F). Control group (n = 56); turquoise, DMPA group (n = 27); pink. One individual from each study group was excluded due to technical issues. Box plots indicate medians and IQR and whiskers show full range. *p<0.05, ** p< 0.01, *** p <0.001, by Mann-Whitney U comparison, p-values FDR-adjusted by Benjamini-Hochberg test. MFI: mean fluorescence intensity. IQR: interquartile range. FDR: False Discovery Rate.
Fig 7
Fig 7. Proteins with altered profiles in CVL as compared between the DMPA vs. control groups.
Based on analysis of protein levels in CVL from DMPA users (n = 32) and controls (n = 55), three proteins (GPX3, ITIH2 and SERPINB1) were identified as significantly different between these groups. Boxes indicate medians and IQR and whiskers and violin show full range. * p< 0.05, ** p < 0.01, by Mann-Whitney U test, not adjusted for potential confounders. CVL: cervicovaginal lavage. AU: arbitrary units. IQR: Interquartile range.

Similar articles

Cited by

References

    1. UNAIDS. Fact sheet—Latest global and regional statistics on the status of the AIDS epidemic 2021 [cited 15 June 2021]. Available from: https://www.unaids.org/en/resources/documents/2021/UNAIDS_FactSheet.
    1. Hapgood JP, Kaushic C, Hel Z. Hormonal Contraception and HIV-1 Acquisition: Biological Mechanisms. Endocr Rev. 2018;39(1):36–78. doi: 10.1210/er.2017-00103 - DOI - PMC - PubMed
    1. Wira CR, Rodriguez-Garcia M, Patel MV. The role of sex hormones in immune protection of the female reproductive tract. Nat Rev Immunol. 2015;15(4):217–30. doi: 10.1038/nri3819 - DOI - PMC - PubMed
    1. Gosmann C, Anahtar MN, Handley SA, Farcasanu M, Abu-Ali G, Bowman BA, et al.. Lactobacillus-Deficient Cervicovaginal Bacterial Communities Are Associated with Increased HIV Acquisition in Young South African Women. Immunity. 2017;46(1):29–37. doi: 10.1016/j.immuni.2016.12.013 - DOI - PMC - PubMed
    1. Masson L, Passmore JA, Liebenberg LJ, Werner L, Baxter C, Arnold KB, et al.. Genital inflammation and the risk of HIV acquisition in women. Clin Infect Dis. 2015;61(2):260–9. doi: 10.1093/cid/civ298 - DOI - PMC - PubMed

Publication types

Grants and funding