. 2022 May 9;18(5):e1010530.
doi: 10.1371/journal.ppat.1010530. eCollection 2022 May.

TRIM25 and ZAP target the Ebola virus ribonucleoprotein complex to mediate interferon-induced restriction

Affiliations

TRIM25 and ZAP target the Ebola virus ribonucleoprotein complex to mediate interferon-induced restriction

Rui Pedro Galão et al. PLoS Pathog. .

Abstract

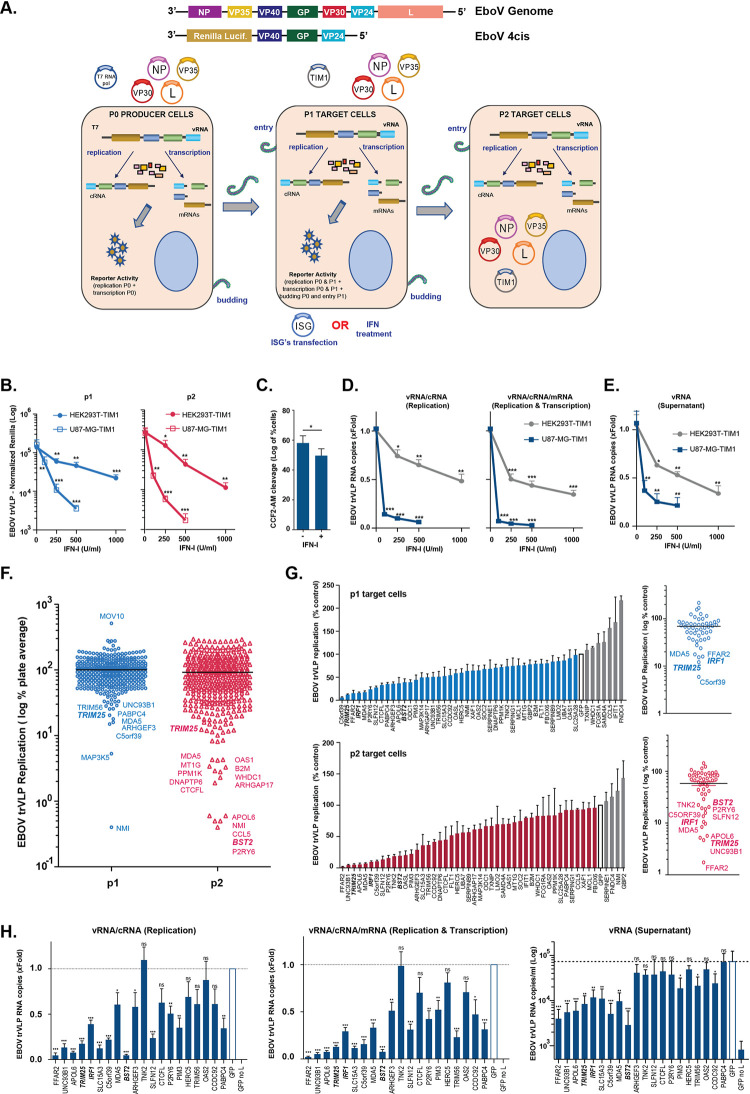
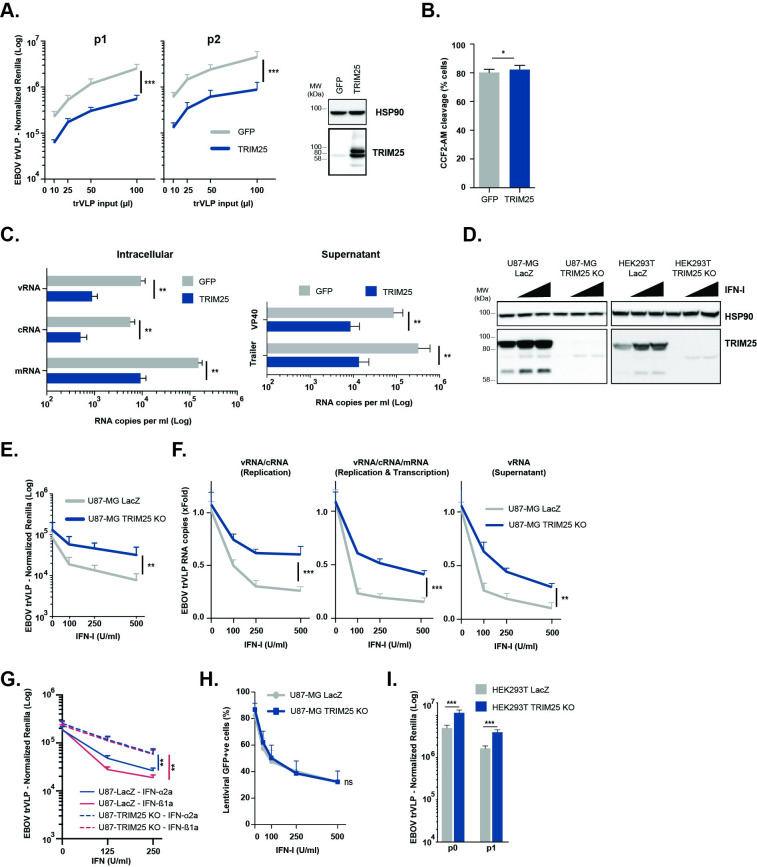
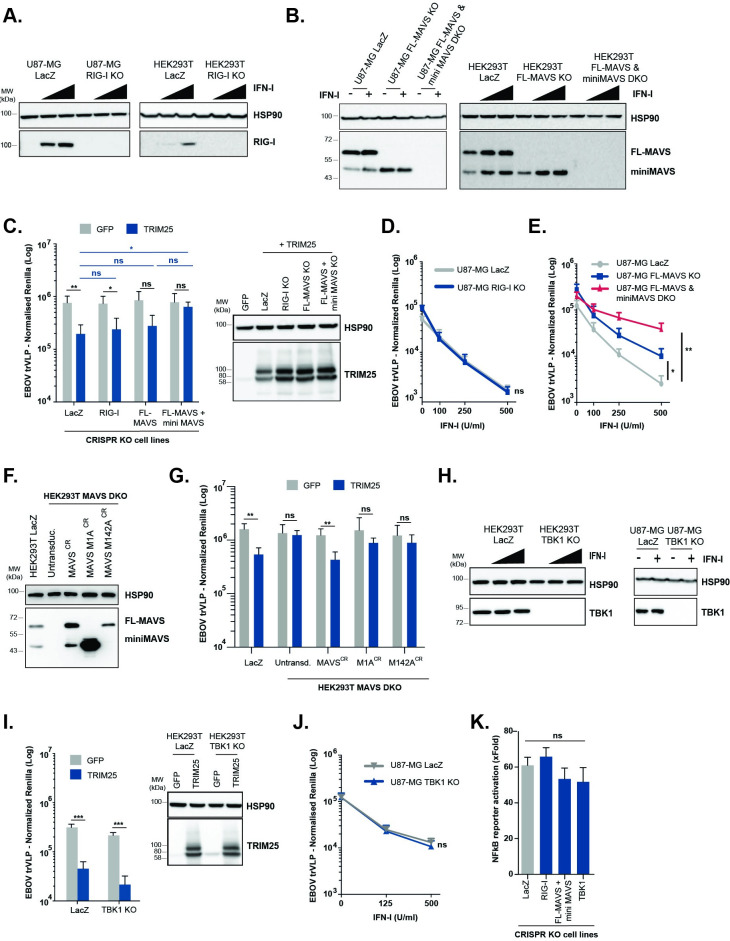
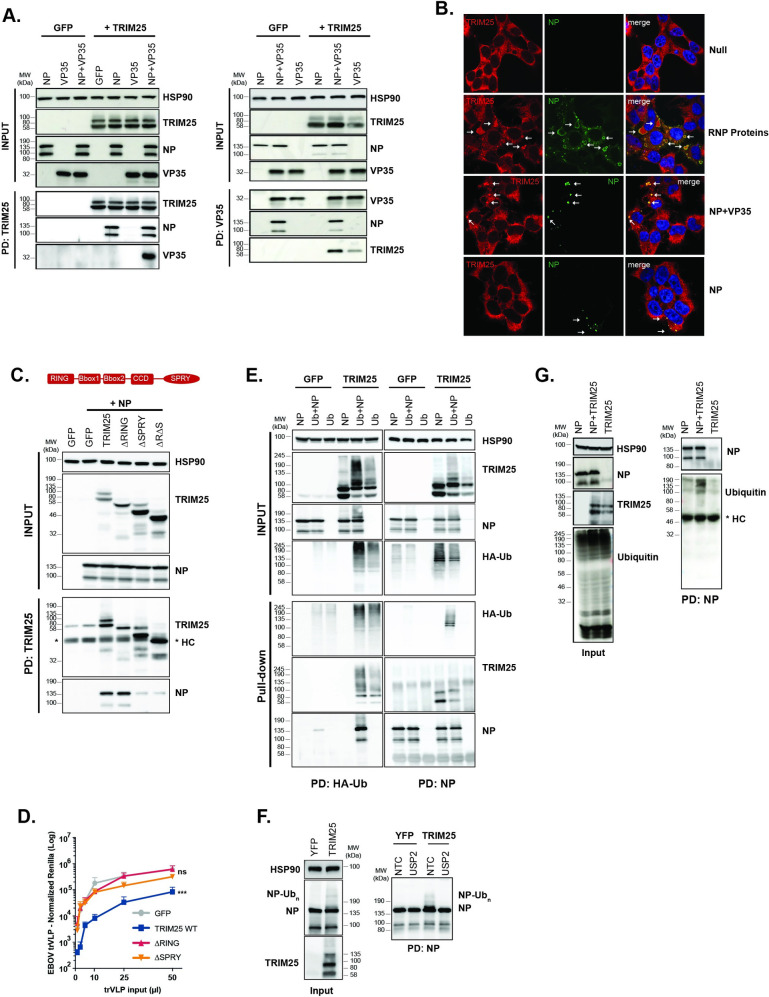
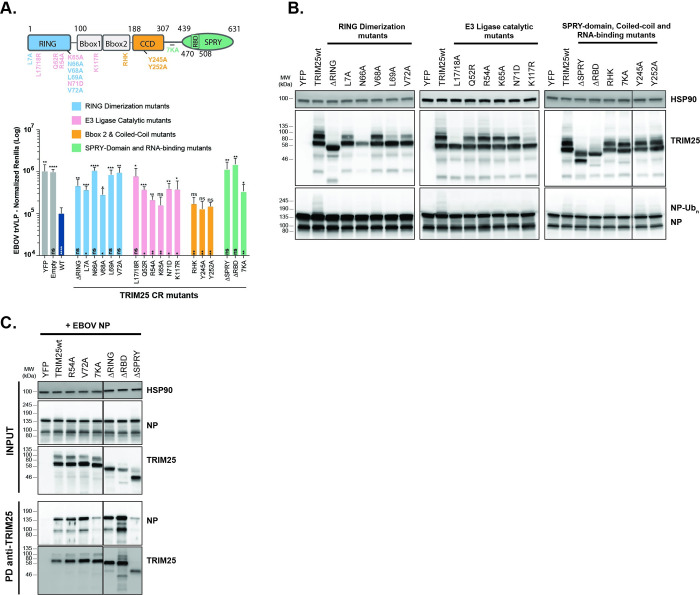
Ebola virus (EBOV) causes highly pathogenic disease in primates. Through screening a library of human interferon-stimulated genes (ISGs), we identified TRIM25 as a potent inhibitor of EBOV transcription-and-replication-competent virus-like particle (trVLP) propagation. TRIM25 overexpression inhibited the accumulation of viral genomic and messenger RNAs independently of the RNA sensor RIG-I or secondary proinflammatory gene expression. Deletion of TRIM25 strongly attenuated the sensitivity of trVLPs to inhibition by type-I interferon. The antiviral activity of TRIM25 required ZAP and the effect of type-I interferon was modulated by the CpG dinucleotide content of the viral genome. We find that TRIM25 interacts with the EBOV vRNP, resulting in its autoubiquitination and ubiquitination of the viral nucleoprotein (NP). TRIM25 is recruited to incoming vRNPs shortly after cell entry and leads to dissociation of NP from the vRNA. We propose that TRIM25 targets the EBOV vRNP, exposing CpG-rich viral RNA species to restriction by ZAP.


Conflict of interest statement

The authors have declared no competing interests exist.

Figures

Fig 1
Fig 1. Human ISG-expression screening identifies novel candidates with antiviral activity against EBOV trVLP.
(A) Upper panels: Graphical representations of the Ebola virus genome, and of the tetra-cistronic minigenome (4cis) encoding Renilla luciferase (Rluc) used in the transcription- and replication-competent (trVLP) assay. Lower panel: Schematic representation of the EBOV trVLP assay. Plasmids expressing ISGs of interest were co-transfected with viral RNP proteins into p1 target cells. Alternatively, p1 target cells were pre-treated with IFN-I prior infection with EBOV trVLPs (detailed description in Material and Methods). (B) EBOV trVLP normalized reporter activity in HEK293T- and U87-MG-stably expressing TIM1 transfected with EBOV RNP proteins and pre-treated with increasing amounts of IFN-I 24 hours prior infection (p1 target cells, blue). Supernatants from p1 cells were harvested 24 hours post-infection, and used to infect HEK293T-TIM1 cells and reporter activities measured 24 hours later (p2 target cells, red). (C) HEK293T-TIM1 cells were pre-treated with IFN-I (1000U/ml) prior to transduction with BlaVP40-EBOV-GP virus-like particles. 24 hours later, viral particle entry was measured as percentage of cells presenting cleavage of CCF2-AM dye by flow cytometry. (D) Relative quantification of intracellular viral RNA levels in HEK293T-TIM1 (grey) and U87-MG-TIM1 (blue) p1 target cells pre-treated with IFN-I, and infected with EBOV trVLPs as in (B). Random hexamer primers were used to generate cDNAs and RT-qPCR analysis was performed using qPCR primers/probe sets targeting the 5’-trailer region of the trVLP 4cis minigenome (vRNA and cRNA, left panel), VP40 RNA (vRNA, cRNA and mRNA, right panel) or gapdh as endogenous control. Data presented as fold change compared to control (no IFN) based on ΔΔCt values. (E) Relative quantification of viral transcripts present on supernatants from (D). cDNA synthesis performed as above and RT-qPCR performed with primers/probe set targeting EBOV VP40 RNA. Data shown as fold change compared to control (no IFN) based on absolute copy numbers. (F) Results of the arrayed human ISG screen. HEK293T-TIM1 target cells (p1) were pre-transfected with plasmids expressing individual ISGs together with EBOV RNP components and Firefly transfection control, and infected with EBOV trVLPs 24 hours later. Supernatants from p1 cells were harvested 24 hours post-infection and used to infect p2 target cells pre-transfected solely with vRNP components and pFluc. EBOV trVLP reporter activities for p1 (blue dots) and p2 target cells (red dots) were measured as in (B). Each dot represents one ISG. Infectivity measured for each ISG-expressing well was normalized to the activity of Fluc control within the well, and values are represented as percentage of the screen plate average, which is indicated as log of 100%. (G) Confirmatory assays for selected top candidate inhibitory ISGs. EBOV-trVLP infection was performed on HEK293T-TIM1 cells as in the primary screen. Normalized reporter activities for p1 (upper panels) and p2 target cells (lower panels) are represented as percentage of EBOV trVLP replication on cells transfected with GFP (white bars). (H) Relative quantification of intracellular (left and middle panels) and supernatant (right panel) viral RNA levels on HEK293T-TIM1 target cells (p1) transfected with EBOV RNP components and the top inhibitory ISG candidates and infected as before. cDNA synthesis and RT-qPCR analysis performed as in (D) and (E). All the represented EBOV trVLP Rluc reporter activities are normalized to control Fluc values obtained in the same lysates. Universal Type I IFN-α was used to pre-treat cells in panels (B-E). *p > 0.05, **p > 0.01 and ***p > 0.001 as determined by two-tailed paired t-test. All error bars represent ± SEM of at least three independent experiments.
Fig 2
Fig 2. TRIM25 is required for type-I IFN-mediated restriction of EBOV trVLP replication.
(A) EBOV trVLP normalized reporter activity on HEK293T-TIM1 cells transfected with EBOV RNP proteins and either GFP (grey) or TRIM25 (blue) prior to infection with increasing amounts of EBOV trVLPs (p1 target cells, left panel). Supernatants from p1 cells were harvested 24 hours post-infection and used to infect p2 target cells (right panel), and reporter activities measured 24 hours later. Protein levels of HSP90 and TRIM25 were determined by western blot on p1 cells at time of infection. (B) HEK293T-TIM1 cells were transfected with plasmids expressing either GFP (grey) or TRIM25 (blue), and transduced with BlaVP40-EBOV-GP virus like particles 24 hours later. Viral particle entry was determined 24 hours post-transduction by measuring the percentage of cells with cleaved CCF2-AM dye by flow cytometry. (C) Quantification of viral RNA transcripts present on cell lysates (left panel) and supernatants (right panel) of HEK293T-TIM1 cells transfected and infected as in (A). Strand-specific reverse transcription primers were used on total RNA extracted from cells to generate cDNAs for minigenomic RNA (vRNA), complementary RNA (cRNA), and mRNA, which were subsequently analysed by RT-qPCR. Random hexamer primers were used to generate cDNAs from total viral RNA extracted from supernatants, and qPCR analysis performed using primers/probe sets targeting 5’ trailer region of the 4cis genome or VP40 RNA. (D) U87-MG- and HEK293T-based CRISPR cells lines were treated with increasing amounts of IFN-I, and lysed 24 hours later for analysis. Protein levels of HSP90 and TRIM25 were determined by western blot on LacZ CRISPR control cells and corresponding TRIM25 CRISPR KO cell lines. (E) EBOV trVLP reporter activities on U87-MG LacZ CRISPR-TIM1 (grey) and U87-MG TRIM25 CRISPR KO-TIM1 (blue) target cells (p1) transfected with EBOV RNP proteins, and pre-treated with increasing amounts of IFN-I prior to infection. (F) Relative quantification of intracellular and supernatant trVLP RNA levels on U87-MG LacZ CRISPR-TIM1 (grey) and U87-MG TRIM25 CRISPR KO-TIM1 cells (blue) from (E). Random hexamer primers were used to generate cDNAs and RT-qPCR analysis was performed using primers/probe sets targeting trVLP 4cis genome trailer region (vRNA and cRNA, left panel), or VP40 RNA (intracellular vRNA, cRNA and mRNA, middle panel; minigenomic RNA in the supernatant, right panel). Data are shown as fold change compared to control (no IFN) based on absolute copy numbers. (G) EBOV trVLP reporter activities on U87-MG LacZ CRISPR-TIM1 (solid lines) and U87-MG TRIM25 CRISPR KO-TIM1 (dashed lines) target cells transfected with EBOV RNP proteins and pre-treated with increasing amounts of IFN-α2a (blue) or IFN-ß1b (red) prior to infection. (H) U87-MG LacZ CRISPR (grey) and U87-MG TRIM25 CRISPR KO cells (blue) were treated with increasing amounts of IFN-I, and transduced the following day with a VSV-G pseudo-typed lentiviral vector expressing GFP (CSGW). The percentage of GFP-positive cells was determined 24 hours later by flow cytometry. (I) HEK293T LacZ CRISPR (grey) and HEK293T TRIM25 CRISPR KO (blue) were used as producer cells (p0) of EBOV trVLPs and reporter activities measured 48 hours post-transfection. Supernatants from p0 cells were used to infect HEK293T-TIM1 target cells (p1), and reporter activities determined 24 hours later. All the represented EBOV trVLP RLuc reporter activities are normalized to control FLuc values obtained in the same lysates. *p > 0.05, **p > 0.01 and ***p > 0.001 as determined by two-tailed paired t-test. All error bars represent ± SEM of at least three independent experiments.
Fig 3
Fig 3. TRIM25 antiviral effect against EBOV trVLPs is independent of RIG-I and downstream pro-inflammatory signal transduction.
(A, B, H) U87-MG- and/or HEK293T-based CRISPR cells lines were treated with increasing amounts of IFN-I, and lysed 24 hours later for protein analysis. Protein levels of HSP90 (A, B and H), RIG-I (A), FL-MAVS/mini-MAVS (B) and TBK1 (H) were determined by western blot on LacZ CRISPR control cells and corresponding CRISPR knock-out (KO) cells lines. (C, I) HEK293T-based CRISPR cell lines depicted in the figures were transfected with plasmids expressing EBOV RNP proteins and TIM1 together with either GFP (grey bars) or TRIM25 (blue bars), and later infected with a fixed amount of EBOV trVLPs. 24 hours post-infection cells were lysed and trVLP reporter activities measured. Protein levels of HSP90 and TRIM25 were determined by western blot at time of infection. (D) EBOV trVLP reporter activities on U87-MG LacZ CRISPR (grey) and U87-MG RIG-I CRISPR KO (blue) target cells (p1), transfected with TIM1 and EBOV RNP proteins, and pre-treated overnight with increasing amounts of IFN-I prior to infection. Luciferase activities measured 24 hours post-infection. (E) EBOV trVLP reporter activities on U87-MG LacZ CRISPR (grey), U87-MG FL-MAVS KO (blue) and FL-MAVS/miniMAVS CRISPR DKO (red) target cells (p1), transfected with TIM1 and EBOV RNP proteins, and pre-treated overnight with increasing amounts of IFN-I prior to infection. Luciferase activities measured 24 hours post-infection. (F) Protein levels of HSP90 and MAVS determined by western blot lysates from HEK293T LacZ control cells, and HEK293T-MAVS DKO cell lines engineered to stably express CRISPR-resistant variants of both MAVS isoforms (MAVSCR), miniMAVS (M1ACR) or FL-MAVS (M142ACR). (G) HEK293T LacZ CRISPR and engineered HEK293T-MAVS DKO cell lines from (F) were co-transfected with plasmids expressing EBOV RNP components and TIM1 together with either GFP (grey bars) or TRIM25 (blue bars), and later infected with EBOV trVLPs. Reporter activities were measured 24 hours later. (J) U87-MG LacZ CRISPR and U87-MG TBK1 CRISPR KO cells were transfected with RNP proteins and TIM1, followed by a IFN-I pre-treatment prior to infection with a fixed amount of EBOV trVLPs. EBOV trVLP reporter activities in p1 were measured 24 hours after infection. (K) Fold activation of a firefly luciferase NF-kB reporter in the depicted HEK293T-based CRISPR cells lines transiently transfected with TRIM25 compared to control GFP vector. Cells were harvested 48 hours post-transfection and FLuc reporter values normalised to control Renilla luciferase activity in the same lysates. All the represented EBOV trVLP Renilla reporter activities are normalized to control Firefly luciferase values obtained in the same lysates. *p > 0.05, **p > 0.01 and ***p > 0.001 as determined by two-tailed paired t-test. All error bars represent ± SEM of at least three independent experiments.
Fig 4
Fig 4. TRIM25 and ZAP are inter-dependent for their antiviral activity against EBOV trVLP.
(A) EBOV trVLP normalized reporter activity on HEK293T-TIM1 cells transfected with EBOV RNP proteins and either GFP (grey) or ZAP-L (red) prior to infection with increasing amounts of EBOV trVLPs (p1 target cells, left panel). Supernatants from p1 cells were harvested and used to infect p2 target cells (middle panel), and reporter activities measured 24 hours later. Protein levels of HSP90 and ZAP were determined by western blot at time of infection. (B) HEK293T- and U87-MG-based CRISPR cells lines were treated with increasing amounts of IFN-I, and lysed 24 hours later for analysis. Protein levels of HSP90 and ZAP were determined by western blot on LacZ CRISPR control cells and corresponding ZAP CRISPR KO cell lines. (C) EBOV trVLP reporter activities on U87-MG LacZ CRISPR-TIM1 (grey) and U87-MG ZAP CRISPR KO-TIM1 (red) target cells (p1), transfect with RNP proteins and pre-treated with increasing amounts of IFN-I prior to infection. Reporter activities measured 24 hours after infection. (D) Quantification of intracellular and supernatant viral RNA levels on U87-MG LacZ CRISPR-TIM1 (grey) and U87-MG ZAP CRISPR KO-TIM1 target cells (red) that were transfected with EBOV RNP proteins and pre-treated with IFN-I, prior to infection with EBOV trVLPs as in (C). Random hexamer primers were used to generate cDNAs and qPCR analysis was performed using primers/probe sets targeting either the trailer region of the viral genome (vRNA and cRNA, left panel), or VP40 RNA (intracellular vRNA, cRNA and mRNA, middle panel; minigenomic RNA in the supernatant, right panel). Data presented as fold change compared to control (no IFN) based on absolute copy numbers. (E) EBOV trVLP normalized reporter activities on HEK293T LacZ CRISPR, HEK293T TRIM25 CRISPR KO and HEK293T ZAP CRISPR KO cells stably expressing TIM1, that were transfected with EBOV RNP plasmids together with GFP (grey), ZAP L (red) or TRIM25 (blue), prior to infection with a fixed amount of EBOV trVLPs (p1 target cells). Supernatants from p1 were then harvested and used to infect HEK293T-TIM1 cells (p2 target cells). Protein levels of HSP90, TRIM25 and ZAP at time of infection shown in S4D Fig. (F) Relative quantification of EBOV L-Polymerase RNA transcripts on cell lysates of HEK293T LacZ CRISPR-TIM1 and HEK293T TRIM25 CRISPR KO-TIM1 cells transfected EBOV RNP plasmids in combination with either with GFP (grey) or ZAP-L (red), and infected with a fixed amount of EBOV trVLPs. Random hexamer primers were used to generate cDNAs from total RNA, and RT-qPCR analysis performed using a primers/probe sets targeting EBOV L-polymerase and gapdh. Data normalized to L-polymerase RNA levels on HEK293T LacZ CRISPR-TIM1 cells transfected with GFP based on ΔΔCt values. (G) EBOV trVLP normalized reporter activity on p2 target cells. HEK293T-TIM1 p1 cells were transfected with EBOV RNP proteins, and either GFP (grey) or ZAP-L (red) prior to infection with increasing amounts of wild-type EBOV trVLPs (trVLPwt, solid lines) or a variant with no CpG dinucleotides on the Renilla ORF of the 4cis genome (CpG low, dashed lines). Supernatants from p1 were harvested and used to infect HEK293T-TIM1 p2 target cells. (H) Quantification of viral RNA transcripts present intracellularly (upper and middle panels) and in supernatants (lower panel) of HEK293T-TIM1 cells transfected as in (G), and infected with a fixed amount of EBOV trVLP WT or CpG low. Random hexamer primers were used to generate cDNAs from total RNA and RT-qPCR analysis was performed as in (D). (I) EBOV trVLP normalized reporter activity on HEK293T-TIM1 p2 target cells. HEK293T LacZ CRISPR-TIM1 (grey) and HEK293T ZAP CRISPR KO-TIM1 cells (red) were transfected with EBOV RNP proteins and pre-treated with increasing amounts of IFN-I prior to infection with pre-determined and equivalent amount (1x10⁶ RLU) of wild-type EBOV trVLPs (solid lines) or CpG Low EBOV trVLP (dashed lines). Supernatants from p1 were harvested and used to infect HEK293T-TIM1 p2 target cells. Reporter activities measured 24 hours post-infection. All the represented EBOV trVLP Renilla reporter activities are normalized to control Firefly luciferase values obtained in the same lysates. P > 0.05, **p > 0.01 and ***p > 0.001 as determined by two-tailed paired t-test. All error bars represent ± SEM of at least three independent experiments.
Fig 5
Fig 5. TRIM25 interacts with EBOV NP and promotes its ubiquitination.
(A) Lysates of HEK293T-TIM1 cells transfected either with GFP or TRIM25, in combination with EBOV NP and/or EBOV VP35, were immunoprecipitated with an anti-TRIM25 (left panel) or an anti-VP35 (right panel) antibodies. Cellular lysates and pull-downs were analysed by western blot for HSP90, TRIM25, EBOV NP and VP35. (B) Panels show representative fields for the localization of EBOV NP and endogenous TRIM25 on HEK293T-TIM1 cells left untreated (Null), or transfected with EBOV NP protein alone, or in combination either with VP35 or all remaining RNP proteins (VP35, VP30 and L). Cells were stained 24 hours post-transfection with anti-TRIM25 (red) and anti-NP (green) antibodies, as well as with DAPI (blue). White arrows point to the localization of TRIM25 intracellular aggregates. (C) Schematic representation of functional domains within TRIM25 (upper panel). Lysates of HEK293T-TIM1 cells transfected with EBOV NP in combination with GFP, TRIM25 or mutants thereof, were immunoprecipitated with an anti-TRIM25 antibody. Input and pull-down samples were blotted for HSP90, TRIM25 and EBOV NP (lower panel). (*) indicates the detected heavy-chains (HC) from the antibody used in the pull-down. (D) EBOV trVLP normalized reporter activity on HEK293T-TIM1 cells transfected with EBOV RNP proteins in combination with GFP (grey), TRIM25 wild-type (blue), TRIM25 ΔRING (red) or TRIM25 ΔSPRY (orange) mutants, prior to infection with increasing amounts of EBOV trVLPs (p1 target cells). EBOV trVLP Rluc reporter activities were measure 24 hours post-infection and normalized to control Fluc values obtained in the same lysates. EBOV trVLP Renilla reporter activities are normalized to control Firefly luciferase values obtained in the same lysates. *p > 0.05, **p > 0.01 and ***p > 0.001 as determined by two-tailed paired t-test. All error bars represent ± SEM of at least three independent experiments. (E) HEK293T-TIM1 cells were transfected either with GFP or TRIM25, in combination with EBOV NP and/or a plasmid expressing a HA-tagged Ubiquitin (HA-Ub). Lysates from these cells were immunoprecipitated with an anti-HA antibody (left panels) or an anti-NP antibody (right panels). Cellular lysates and pull-down samples were analysed by western blot for HSP90, TRIM25, EBOV NP and HA (ubiquitin). (F) Lysates from HEK293T cells co-transfected with EBOV NP and YFP or TRIM25 were immunoprecipitated with an anti-NP antibody, and pulled-down fractions treated with USP2 deubiquitinase enzyme. Cellular lysates and pull-downs were analysed by western blot for HSP90, TRIM25 and EBOV NP. (G) HEK293T-TIM1 were transfected with EBOV NP and/or TRIM25 under endogenous Ubiquitin levels and treated with Bafilomycin A (100nM). Lysates from the cells were immunoprecipitated with an anti-EBOV antibody. Cellular lysates and pull-down samples were analysed by western blot for HSP90, TRIM25, EBOV NP and Ubiquitin.
Fig 6
Fig 6. Determinants of TRIM25 antiviral activity and NP interaction.
(A) Upper Panel: schematic representation of TRIM25 with the localization of the RING dimerization mutants (light blue), E3-Ligase catalytic mutants (pink), Bbox2 & coiled-coil mutants (orange) and SPRY-domain and RNA-binding mutants (light green) generated on a TRIM25 CRISPR-resistant background. Lower Panel: EBOV trVLP normalized reporter activity on HEK293T TRIM25 CRISPR KO-TIM1 cells transfected with EBOV RNP proteins in combination with GFP (grey), CRISPR-resistant (CR) TRIM25 wild-type (dark blue), or mutants thereof (see upper panel), prior to infection with EBOV trVLPs (p1 target cells). EBOV trVLP Rluc reporter activities were measure 24 hours post-infection and normalized to control Fluc values obtained in the same lysates. All error bars represent ± SEM of four independent experiments. *p > 0.05, **p > 0.01 and ***p > 0.001 as determined by One-way ANOVA. Statistics represented above graphic bars were calculated as multiple comparisons to TRIM25 wild-type, while the statistics within graphic bars are represented in function of multiple comparison to YFP. (B) HEK293T TRIM25 CRISPR KO cells were transfected with plasmids expressing the EBOV RNP proteins together with YFP, CRISPR-resistant TRIM25 or mutants thereof. Cell lysates were analysed 48 hours later by western blot for the expression of HSP90, TRIM25 and EBOV NP. (C) Lysates of HEK293T cells transfected with EBOV NP in combination with either YFP or CRISPR-resistant TRIM25 (or mutants thereof) were immunoprecipitated with a rabbit anti-TRIM25 antibody. Cellular lysates and pull-down samples were analysed by western blot for HSP90, TRIM25 and EBOV NP.
Fig 7
Fig 7. TRIM25 and ZAP promote the dissociation of EBOV trVLP genomic RNA from the viral ribonucleoprotein.
(A) Typical confocal microscopy fields from HEK293T LacZ CRISPR-TIM1 (left panels) or HEK293T NPC1 CRISPR KO-TIM1 cells (right panels) left untreated (Null) or infected with EBOV trVLPs concentrated on a 20% sucrose-cushion. Cells were stained 4 to 6 hours post-infection with anti-TRIM25 (red), anti-EBOV NP (green) and DAPI (blue). White arrows show localization of TRIM25 intracellular aggregates. (B) Relative quantification of intracellular RNA levels (grey) and NP-associated RNA (blue) on HEK293T LacZ CRISPR-TIM1 and HEK293T NPC1 CRISPR KO-TIM1 cells transfected with GFP, TRIM25 or ZAP-L prior to infection with EBOV trVLPs. 3 hours post-infection cells were UV cross-linked, and EBOV NP from incoming virions were immunoprecipitated from lysates with an anti-NP antibody. Following proteinase K treatment, pulled-down RNA was extracted with Qiazol / chloroform, and random hexamer primers were used to generate cDNAs, and qPCR analysis performed using a primers/probe set targeting EBOV VP40 RNA. Values are presented as percentage of absolute RNA copy numbers on cells transfected with GFP. (C) HEK293T LacZ CRISPR, HEK293T ZAP CRISPR KO and HEK293T TRIM25 CRISPR KO cells stably expressing TIM1 were transfected with GFP, TRIM25 or ZAP-L as depicted in the panels, and later infected with EBOV trVLPs. Relative quantification of intracellular viral RNA levels (grey) and NP-associated RNA (coloured bars) were determined as in (B). (D) HEK293T-TIM1 cells were transfected with GFP, wild-type TRIM25 or mutants thereof prior to infection with EBOV trVLPs. Relative quantification of intracellular viral RNA levels (grey) and NP-associated RNA (blue) were determined as in (B). (E) HEK293T TRIM25 CRISPR KO-TIM1 cells were transfected with GFP (grey), or CRISPR-resistant versions of TRIM25 (wild-type, dark blue; or mutants thereof, as depicted in the figure, light blue) prior to infection with EBOV trVLPs. Relative quantification of NP-associated RNA was determined as in (B). (F) Prior to infection with EBOV trVLPs, HEK293T LacZ CRISPR-TIM1 cells were transfected with GFP or TRIM25 and either treated with 250μM of T705 (Favipiravir), or the equivalent volume of the diluent (DMSO). Relative quantification of intracellular viral RNA levels (grey) and NP-associated RNA (coloured bars) were determined as in (B). Values are presented as percentage of absolute RNA copy numbers on cells transfected with GFP. (G) Relative quantification of ZAP-associated RNA on HEK293T LacZ CRISPR-TIM1 and HEK293T TRIM25 CRISPR KO-TIM1 cells transfected with GFP (grey) or ZAP-L (red) prior to infection with EBOV trVLPs (left panel). 3 hours post-infection cells were UV cross-linked, and ZAP was immunoprecipitated from lysates. RNA extraction, cDNA synthesis and RT-qPCR analysis were performed as in (B). Values were normalized to the respective inputs and are presented relative to absolute RNA copy numbers on cells transfected with GFP. Cellular lysates and pull-down samples were analysed by western blot for HSP90, TRIM25, NP and ZAP (right panel). (H) HEK293T LacZ CRISPR, HEK293T TRIM25 CRISPR KO and HEK293T ZAP CRISPR KO cells stably expressing TIM1 were either untreated or pre-treated with 1000U/ml of IFN-I prior to infection with EBOV trVLPs. Relative quantification of intracellular viral RNA levels (grey) and NP-associated RNA (coloured bars) were determined as in (B). Values are presented as percentage of absolute RNA copy numbers on cells non-treated with IFN. (I) HEK293T LacZ CRISPR, HEK293T TRIM25 CRISPR and HEK293T ZAP CRISPR KO cells stably expressing TIM1 were pre-treated overnight with increasing concentrations of IFN-I prior to infection with EBOV nanoluciferase trVLPs. EBOV trVLP nanoluc reporter activities were measured 48 hours post-infection and data is shown as a percentage of untreated for each cell line individually. (J). Proposed model for the mechanism associated with the antiviral activities of TRIM25 and ZAP against EBOV trVLP. EBOV viral particle enters the cells by macropinocytosis, followed by NPC1-dependent fusion with the cellular endosomal membrane. Once in the cytoplasm, TRIM25 is recruited to the viral particle through an interaction with EBOV NP protein, leading to the ubiquitination of both viral target and TRIM25 itself. This results in the displacement of the viral RNA genome from the vRNP, followed by its recognition by ZAP in a way dependent of the genome’s CpG content and subsequent impact in the transcription and replication of EBOV trVLP.

Similar articles

Cited by

References

    1. McNab F, Mayer-Barber K, Sher A, Wack A, O’Garra A. Type I interferons in infectious disease. Nat Rev Immunol. 2015; 15, 87–103. doi: 10.1038/nri3787 - DOI - PMC - PubMed
    1. Schoggins JW, Wilson SJ, Panis M, Murphy MY, Jones CT, Bieniasz P, et al.. A diverse range of gene products are effectors of the type I interferon antiviral response. Nature. 2011; 472, 481–485. doi: 10.1038/nature09907 - DOI - PMC - PubMed
    1. Schneider WM, Chevillotte MD, Rice CM. Interferon-stimulated genes: a complex web of host defenses. Annu Rev Immunol. 2014; 32, 513–545. doi: 10.1146/annurev-immunol-032713-120231 - DOI - PMC - PubMed
    1. Basler CF. Innate immune evasion by filoviruses. Virology. 2015; 479–480, 122–130. doi: 10.1016/j.virol.2015.03.030 - DOI - PMC - PubMed
    1. Beachboard DC, Horner SM. Innate immune evasion strategies of DNA and RNA viruses. Curr Opin Microbiol. 2016; 32, 113–119. doi: 10.1016/j.mib.2016.05.015 - DOI - PMC - PubMed

Publication types

MeSH terms