. 2022 May 9;18(5):e1010105.
doi: 10.1371/journal.pcbi.1010105. eCollection 2022 May.

A generalized Flory-Stockmayer kinetic theory of connectivity percolation and rigidity percolation of cytoskeletal networks

Affiliations

A generalized Flory-Stockmayer kinetic theory of connectivity percolation and rigidity percolation of cytoskeletal networks

Carlos Bueno et al. PLoS Comput Biol. .

Abstract

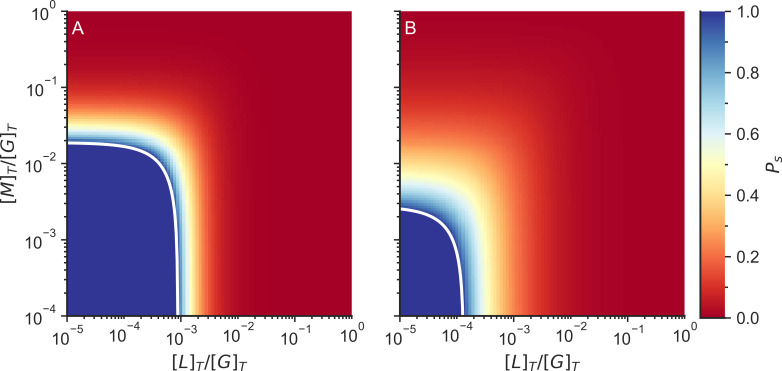
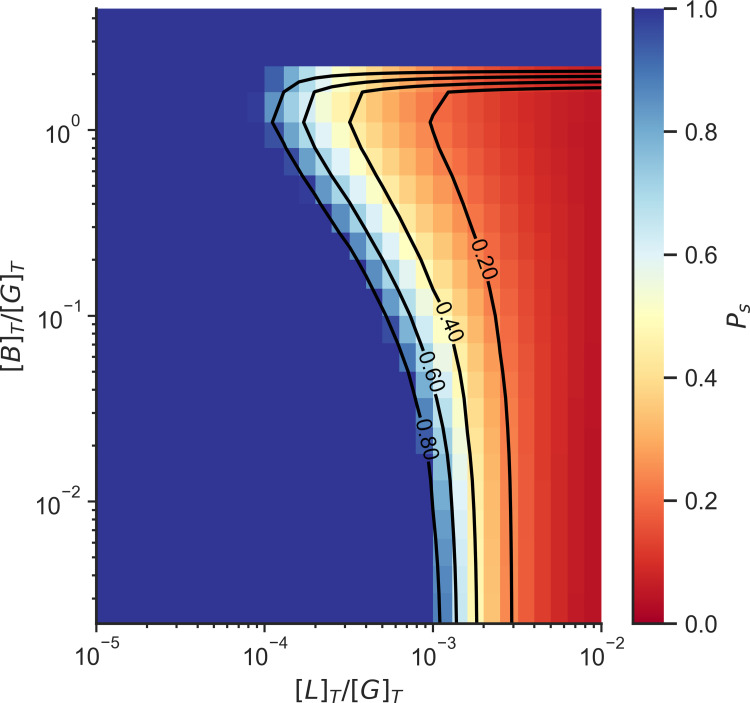
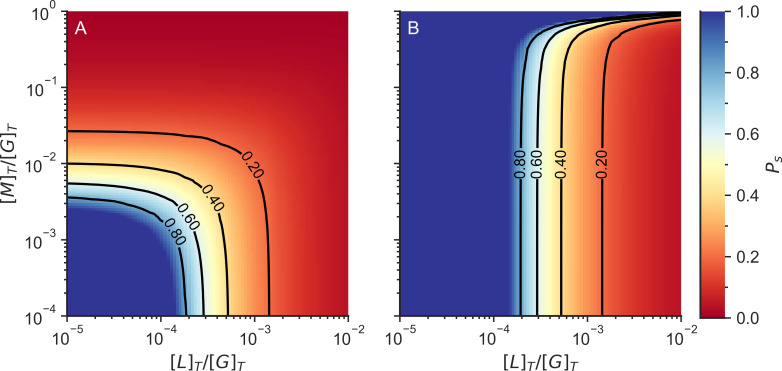
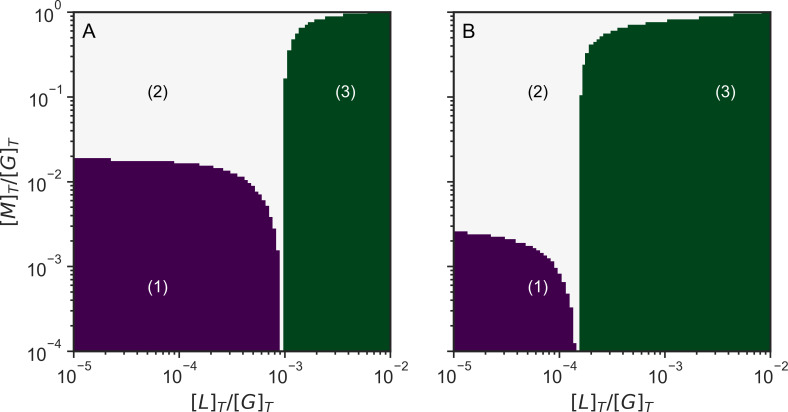
Actin networks are essential for living cells to move, reproduce, and sense their environments. The dynamic and rheological behavior of actin networks is modulated by actin-binding proteins such as α-actinin, Arp2/3, and myosin. There is experimental evidence that actin-binding proteins modulate the cooperation of myosin motors by connecting the actin network. In this work, we present an analytical mean field model, using the Flory-Stockmayer theory of gelation, to understand how different actin-binding proteins change the connectivity of the actin filaments as the networks are formed. We follow the kinetics of the networks and estimate the concentrations of actin-binding proteins that are needed to reach connectivity percolation as well as to reach rigidity percolation. We find that Arp2/3 increases the actomyosin connectivity in the network in a non-monotonic way. We also describe how changing the connectivity of actomyosin networks modulates the ability of motors to exert forces, leading to three possible phases of the networks with distinctive dynamical characteristics: a sol phase, a gel phase, and an active phase. Thus, changes in the concentration and activity of actin-binding proteins in cells lead to a phase transition of the actin network, allowing the cells to perform active contraction and change their rheological properties.


Conflict of interest statement

The authors have declared that no competing interests exist.

Figures

Fig 1
Fig 1. The time course of the concentrations of bound species provided from the macroscopic chemical kinetic model (solid lines) and the MEDYAN simulations (dots) of actomyosin networks.
Results for networks without Arp2/3 are shown in (A) and results with Arp2/3 are shown in (B). The average MEDYAN concentrations are plotted as dotted lines. Fraction of F-actin monomers in finite clusters obtained from the chemical kinetic model are shown in (C) without Arp2/3 and results with Arp2/3 are shown in (D). [Fm · Fp] is the concentration of plus sites of F-actin monomers bound to a minus site of another actin monomer. [Fc · L · Fc] is the concentration of F-actin monomer binding sites bound to another F-actin monomer binding site through a linker (α-actinin). [Fc · M · Fc] is the concentration of actin monomer binding sites bound to another actin monomer binding site through a motor (NMIIA). [Fc · B · Fm] is the concentration of actin monomer binding sites bound to a minus site of another actin monomer through a brancher (Arp2/3).
Fig 2
Fig 2. The percentage of binding sites to the total number of binding sites in different states for a two-step linker binding model is shown as a function of the total number of linkers in a system.
Fc is the percentage of the concentration of free binding sites to the total concentration of binding sites. Fc · L is the percentage of the concentration of binding sites bound to a linker to the total concentration of binding sites. Fc · L · Fc is the percentage of the concentration of crosslinks to the total concentration of binding sites. The total concentration of binding sites [Fc]T in the system is 25 μM, kc+ = 1 μM-1s-1, kc- = 1s-1.
Fig 3
Fig 3. Heatmap of the proportion of the concentration of crosslinks to the concentration of total binding sites as a function of the linker binding equilibrium constant and the concentration of linkers.
All axes have been normalized by the concentration of total binding sites in the system. [L]T is the total linker concentration, [Fc]T is the total concentration of binding sites, [Fc · L · Fc] is the concentration of crosslinks, and Kc is the linker binding equilibrium constant.
Fig 4
Fig 4. Plot showing the location of different experiments on actin crosslinking plotted in the two-step model phase space [5,11,58,59].
The curved lines indicate percolation transitions for filaments of different sizes. The dotted black line indicates the region where the maximum number of crosslinks can be observed. [L]T is the total linker concentration, [Fc]T is the total concentration of binding sites, and Kc is the linker binding equilibrium constant.
Fig 5
Fig 5. Fraction of actin monomers in finite clusters (Ps) without Arp2/3 (left) and with Arp2/3 (right).
The color indicates the probability that an F-actin monomer is in a finite cluster. The white line indicates the connectivity percolation transition. The system is not gelated when Ps = 1, while the system is gelated when Ps < 1. [L]T is the total linker concentration, [M]T is the total motor concentration, and [G]T is the total G-actin concentration. The total concentration of G actin in the system was 25 μM and the total concentration of Arp2/3 on the simulations with Arp2/3 was 0.5 μM.
Fig 6
Fig 6. Fraction of actin monomers in finite clusters (Ps) as a function of Arp2/3 concentration and crosslinker concentration with the exception of motors.
The color indicates the probability that an F-actin monomer is in a finite cluster. The system is not gelated when Ps = 1, while the system is gelated when Ps < 1. [L]T is the total linker concentration, [M]T is the total motor concentration, and [G]T is the total actin concentration. The total concentration of G actin in the system was 25 μM.
Fig 7
Fig 7. Fraction of actin monomers in finite clusters (Ps) including motor and linker crosslinks (A) or only when considering linker crosslinks (B).
The color indicates the probability that an F-actin monomer is in a finite cluster. The system is not gelated when Ps = 1, while the system is gelated when Ps < 1. [L] T is the total linker concentration, [M]T is the total motor concentration, and [G]T is the total actin concentration.
Fig 8
Fig 8. Schematic phase diagrams of actomyosin systems as a function of linker and motor concentrations of actomyosin networks without Arp2/3 (A) and with Arp2/3 (B).
In region (1) the system is not gelated. In region (2) the system is not gelated only by linker connections, but the system is connected fully when we also consider the motor connections. In region (3) the system is gelated just by linkers alone. [L]T is the total linker concentration, [M]T is the total motor concentration, and [G]T is the total actin concentration.
Fig 9
Fig 9. Rigidity percolation limits including both motor and linker crosslinks (left lines) or those found when only considering linker crosslinks (right lines).
The number indicates the rigidity of the crosslinkers (bcLc). We assume that the connections between plus and minus sites, the connections between binding sites and minus sites, and the connections between motors and binding sites are rigid (bp→m = bc→m = bcMc = 6). [L]T is the total linker concentration, [M]T is the total motor concentration, and [G]T is the total actin concentration. The color of the background indicates the probability that an actin is in a finite cluster (Ps).
Fig 10
Fig 10. Diagram of connections of F-actin monomers to other F-actin monomers.
The F-actin monomers are shown in blue and have 3 sites: the plus site (p), the minus site (m), and the binding site (c). The dotted lines indicate connections from the site of an F-actin monomer to another F-actin monomer. The connections are formed by polymerization (black dotted lines), linkers (L), motors (M) or branchers (B). The actin cluster can be represented as a treelike cluster, where the particle in the center is the root, and can be connected to up to 3 particles in the first layer, 6 particles in the second layer, and so on.

Similar articles

Cited by

References

    1. Svitkina TM. The actin cytoskeleton and actin-based motility. Cold Spring Harb Perspect Biol. 2018;10: 1–22. doi: 10.1101/cshperspect.a018267 - DOI - PMC - PubMed
    1. Caruel M, Truskinovsky L. Physics of muscle contraction. Reports Prog Phys. 2018;81. doi: 10.1088/1361-6633/aa7b9e - DOI - PubMed
    1. Pollard TD. Actin and Actin-Binding Proteins. Cold Spring Harb Perspect Biol. 2016;8: 1–18. doi: 10.1101/cshperspect.a018226 - DOI - PMC - PubMed
    1. Murrell MP, Oakes PW, Lenz M, Gardel ML. Forcing cells into shape: the mechanics of actomyosin contractility. Nat Rev Mol Cell Biol. 2015;16: 486–98. doi: 10.1038/nrm4012 - DOI - PMC - PubMed
    1. Wachsstock DH, Schwartz WH, Pollard TD. Affinity of alpha-actinin for actin determines the structure and mechanical properties of actin filament gels. Biophys J. 1993;65: 205–14. doi: 10.1016/S0006-3495(93)81059-2 - DOI - PMC - PubMed

Publication types