. 2022 May 9;18(5):e1010063.
doi: 10.1371/journal.pcbi.1010063. eCollection 2022 May.

Influence of confinement on the spreading of bacterial populations

Affiliations

Influence of confinement on the spreading of bacterial populations

Daniel B Amchin et al. PLoS Comput Biol. .

Abstract

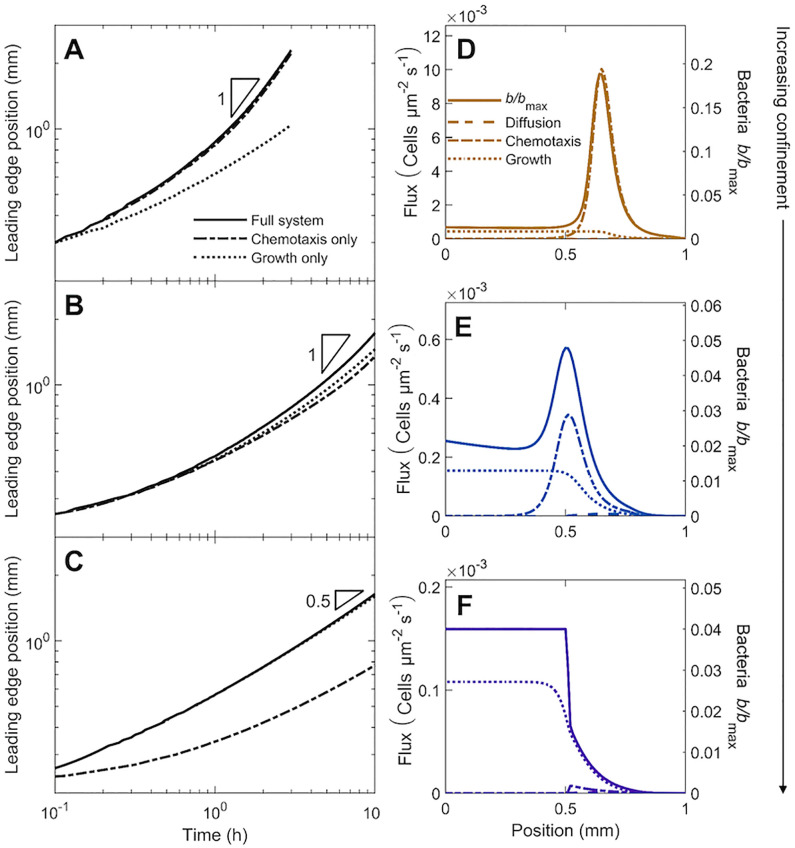
The spreading of bacterial populations is central to processes in agriculture, the environment, and medicine. However, existing models of spreading typically focus on cells in unconfined settings-despite the fact that many bacteria inhabit complex and crowded environments, such as soils, sediments, and biological tissues/gels, in which solid obstacles confine the cells and thereby strongly regulate population spreading. Here, we develop an extended version of the classic Keller-Segel model of bacterial spreading via motility that also incorporates cellular growth and division, and explicitly considers the influence of confinement in promoting both cell-solid and cell-cell collisions. Numerical simulations of this extended model demonstrate how confinement fundamentally alters the dynamics and morphology of spreading bacterial populations, in good agreement with recent experimental results. In particular, with increasing confinement, we find that cell-cell collisions increasingly hinder the initial formation and the long-time propagation speed of chemotactic pulses. Moreover, also with increasing confinement, we find that cellular growth and division plays an increasingly dominant role in driving population spreading-eventually leading to a transition from chemotactic spreading to growth-driven spreading via a slower, jammed front. This work thus provides a theoretical foundation for further investigations of the influence of confinement on bacterial spreading. More broadly, these results help to provide a framework to predict and control the dynamics of bacterial populations in complex and crowded environments.


Conflict of interest statement

The authors have declared that no competing interests exist.

Figures

Fig 1
Fig 1. Summary of the cell density-dependent crowding correction μcrowd, which we use in the model to incorporate the influence of confinement on cell-cell collisions.
In particular, the cellular transport parameters are multiplied by μcrowd, this case shown for the prototypical case of intermediate confinement. (Left) At low densities, spreading of cells (green) is impeded only by collisions with surrounding solid obstacles (grey), not with neighboring cells, so μcrowd = 1. This impeded spreading is quantified by the transport parameters Db0 and χ0, whose values are regulated by the characteristic chord length c characterizing the amount of free space between obstacles. (Middle) When the local density of cells is so large that the characteristic separation between neighboring cells cell is less than the characteristic chord length c, cell-cell collisions further truncate the transport parameters. This effect is quantified by μcrowd < 1. (Right) At the maximal density b = bjammed, the cells are jammed and have no free space to move. Therefore, μcrowd = 0, and the population spreads solely through growth and division of cells. Note that our definition of the number density of bacteria b is as the number of cells per unit total volume of space, which includes the volume of surrounding obstacles.
Fig 2
Fig 2. Results from a numerical simulation of population spreading in intermediate confinement.
The simulation incorporates both motility and growth. (A) shows the dynamics of the cells while (B) shows the corresponding dynamics of the nutrient, quantified by the normalized density b/bmax and concentration c/c, respectively. As noted in §2.4, the initial inoculum is composed purely of dense-packed cells with liquid between them (ϕ = 1), with the entire inoculum surrounded by the obstacle-filled medium (ϕ = 0.17); hence, the initial inoculum has b = bmax, which is larger than bjammed, the jamming density of cells in confinement. Different colors indicate different times as listed. The dense inoculum initially centered about the origin spreads outward, first as a jammed front (jamming density shown by the dashed grey line in A), then detaching as a coherent lower-density pulse that propagates continually via chemotaxis. At long times, this pulse appears to approach an unchanging shape and speed, as suggested by the collapse of the profiles in the upper inset (showing the same data, but shifted horizontally to center the peaks). The cellular dynamics arise in response to consumption of the nutrient, which is initially saturated everywhere, but is rapidly depleted and forms a gradient that is propagated with the pulse (inset shows the same data but with both axes zoomed out). In B, the three dashed grey lines show the characteristic concentrations of sensing c+ and c and the characteristic Monod concentration cchar; the corresponding positions are shown by the pluses, diamonds, and triangles, respectively, in A-B. An animated form of this Figure is shown in S1 Video, and a sample MATLAB code to implement this simulation is provided in S1 File.
Fig 3
Fig 3. Population dynamics, morphology, and fluxes driving spreading for the simulation of bacteria in intermediate confinement (Fig 2).
The simulation incorporates both motility and growth. (A) Increase in the position of the leading edge of the population is initially hindered (red), but approaches constant-speed motion indicated by the triangle at long times (blue). The corresponding instantaneous speed vpulse is shown in the inset. (B) At a short time corresponding to the red point in A, the population expands as a jammed front (top panel). Lower panel shows that cellular growth and diffusion are the primary contributors to the expansion of this front. (C) At a long time corresponding to the blue point in A, the population spreads as a coherent pulse (top panel). Lower panel shows that chemotaxis is the primary contributor to pulse propagation. Positions of the maximal diffusive and chemotactic fluxes are indicated by the circles and squares, respectively, in B-C; note the slight upward kink in the diffusive flux in C indicated by the circle. (D) Variation of the maximal diffusive and chemotactic fluxes, indicated by the circles and squares in B-C, over time. The initial population dynamics are dominated by cellular diffusion (circles), while at longer times chemotaxis dominates (squares). To illustrate the role played by cellular collisions, we show the same data with and without the crowding correction μcrowd in the upper (grey) and lower (black) datasets; crowding hinders population spreading, as shown by the vertical offset in the curves, but plays a less appreciable role at long times, as shown by the curves approaching each other.
Fig 4
Fig 4. Results from a numerical simulation of population spreading in intermediate confinement starting from a more dilute inoculum.
The simulation incorporates both motility and growth. (A) shows the dynamics of the cells while (B) shows the corresponding dynamics of the nutrient, quantified by the normalized density b/bmax and concentration c/c, respectively. Different colors indicate different times as listed. The dilute inoculum (jamming density shown by the dashed grey line in A) initially centered about the origin first grows exponentially and spreads diffusively until nutrient is locally depleted (upper inset shows the same data, but zoomed in to the vertical axis); only then does a coherent pulse detach and propagate continually via chemotaxis in response to the nutrient gradient (lower inset shows the same data but with both axes zoomed out). Even though the short-time behavior is different from the case of a more dense inoculum shown in Fig 2, the long-time behavior of this pulse is identical. To facilitate comparison with Fig 2, in B, the three dashed grey lines again show the characteristic concentrations of sensing c+ and c and the characteristic Monod concentration cchar; the corresponding positions are shown by the pluses, diamonds, and triangles, respectively, in A-B. An animated form of this Figure is shown in S2 Video.
Fig 5
Fig 5. Population dynamics, morphology, and fluxes driving spreading for the simulation of bacteria in intermediate confinement, but from a more dilute initial inoculum (Fig 4).
The simulation incorporates both motility and growth. (A) Increase in the position of the leading edge of the population is initially hindered (red), but approaches constant-speed motion indicated by the triangle at long times (purple). The corresponding speed vpulse is shown in the inset. (B) At a short time corresponding to the red point in A, the population grows exponentially (top panel) and spreads primarily through growth and diffusion (lower panel). (C) At a long time corresponding to the purple point in A, the population spreads as a coherent pulse (top panel). Lower panel shows that chemotaxis is the primary contributor to pulse propagation. Positions of the maximal diffusive and chemotactic fluxes are indicated by the circles and squares, respectively, in B-C; note the slight upward kink in the diffusive flux in C indicated by the circle. (D) Variation of the maximal diffusive and chemotactic fluxes, indicated by the circles and squares in B-C, over time. The initial population dynamics are dominated by cellular diffusion (circles), while at longer times chemotaxis dominates (squares). To illustrate the role played by cellular collisions, we show the same data with (black) and without (grey) the crowding correction μcrowd in the datasets indicated by the red lines; the data are identical except at long times, when crowding slightly hinders population spreading.
Fig 6
Fig 6. Increasing confinement causes a transition from fast chemotactic pulse propagation to slower jammed growth expansion.
Panels show results from numerical simulations of population spreading from the same dense inoculum initially centered about the origin in weak, intermediate, and strong confinement, shown by top, middle, and bottom rows respectively. First column shows the results of the full model, while second and third columns show the same simulations with growth or chemotaxis omitted, respectively. We only show the normalized cellular density b/bmax for clarity. As noted in §2.4, the initial inoculum is composed purely of dense-packed cells with liquid in between them (ϕ = 1), surrounded by the obstacle-filled medium (ϕ < 1); hence, the initial inoculum has b = bmax, which is larger than bjammed, the jamming density of cells in confinement. Different colors indicate different times as listed in the color scale. In weak confinement, a coherent pulse rapidly detaches and continually propagates; this pulse is driven primarily by chemotaxis, and thus, omitting growth barely changes the dynamics while omitting chemotaxis abolishes the propagation altogether. Conversely, in strong confinement, the population spreads slowly as a jammed front, driven primarily by growth. In intermediate confinement, both growth and chemotaxis drive population spreading. The dashed grey line shows the jamming density, which varies depending on confinement (and is larger than the vertical scale in the top row). An animated form of this Figure, along with the nutrient profiles, is shown in S3 Video.
Fig 7
Fig 7. Population dynamics, morphology, and fluxes driving spreading for simulations of bacteria in weak, intermediate, and strong confinement (Fig 6) as shown by the top, middle, and bottom rows, respectively.
(A-B) Increase in the position of the leading edge of the population is initially hindered, but approaches constant-speed motion indicated by the triangle at long times. In strong confinement (C), however, the long-time behavior approaches diffusive-like scaling instead. (D-E) At long times, the population spreads as a coherent pulse (solid line) driven primarily by chemotaxis in weak confinement, and by both chemotaxis and growth in intermediate confinement. (F) In strong confinement, however, the population spreads slowly as a jammed front, driven primarily by growth.

Similar articles

Cited by

References

    1. Balzan S, de Almeida Quadros C, De Cleva R, Zilberstein B, Cecconello I. Bacterial translocation: overview of mechanisms and clinical impact. J Gastroenterol Hepatol. 2007;22(4):464–471. doi: 10.1111/j.1440-1746.2007.04933.x - DOI - PubMed
    1. Chaban B, Hughes HV, Beeby M. The flagellum in bacterial pathogens: for motility and a whole lot more. In: Seminars in cell and developmental biology. vol. 46. Elsevier; 2015. p. 91–103. - PubMed
    1. Datta SS, Steinberg AP, Ismagilov RF. Polymers in the gut compress the colonic mucus hydrogel. Proc Natl Acad Sci U S A. 2016;113(26):7041–7046. doi: 10.1073/pnas.1602789113 - DOI - PMC - PubMed
    1. Harman MW, Dunham-Ems SM, Caimano MJ, Belperron AA, Bockenstedt LK, Fu HC, et al.. The heterogeneous motility of the Lyme disease spirochete in gelatin mimics dissemination through tissue. Proc Natl Acad Sci U S A. 2012;109(8):3059–3064. doi: 10.1073/pnas.1114362109 - DOI - PMC - PubMed
    1. Ribet D, Cossart P. How bacterial pathogens colonize their hosts and invade deeper tissues. Microbes and infection. 2015;17(3):173–183. doi: 10.1016/j.micinf.2015.01.004 - DOI - PubMed

Publication types