. 2022 May 9;16(5):e0010375.
doi: 10.1371/journal.pntd.0010375. eCollection 2022 May.

Evaluation of the effectiveness of the California mosquito-borne virus surveillance & response plan, 2009-2018

Affiliations

Evaluation of the effectiveness of the California mosquito-borne virus surveillance & response plan, 2009-2018

Mary E Danforth et al. PLoS Negl Trop Dis. .

Abstract

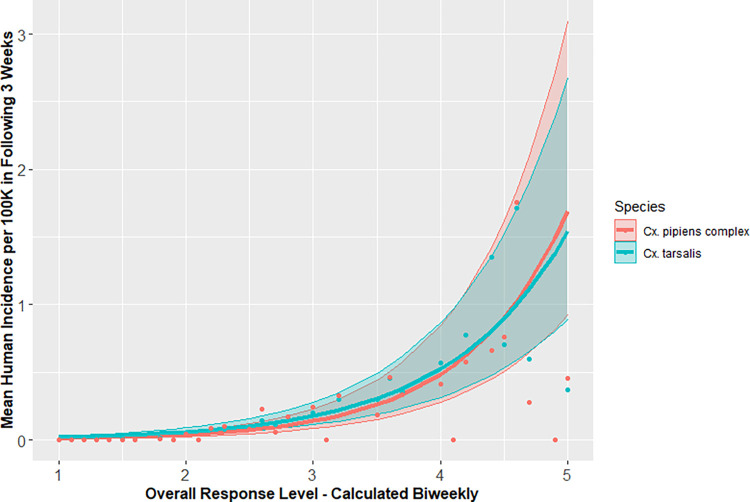
Local vector control and public health agencies in California use the California Mosquito-Borne Virus Surveillance and Response Plan to monitor and evaluate West Nile virus (WNV) activity and guide responses to reduce the burden of WNV disease. All available data from environmental surveillance, such as the abundance and WNV infection rates in Culex tarsalis and the Culex pipiens complex mosquitoes, the numbers of dead birds, seroconversions in sentinel chickens, and ambient air temperatures, are fed into a formula to estimate the risk level and associated risk of human infections. In many other areas of the US, the vector index, based only on vector mosquito abundance and infection rates, is used by vector control programs to estimate the risk of human WNV transmission. We built models to determine the association between risk level and the number of reported symptomatic human disease cases with onset in the following three weeks to identify the essential components of the risk level and to compare California's risk estimates to vector index. Risk level calculations based on Cx. tarsalis and Cx. pipiens complex levels were significantly associated with increased human risk, particularly when accounting for vector control area and population, and were better predictors than using vector index. Including all potential environmental components created an effective tool to estimate the risk of WNV transmission to humans in California.


Conflict of interest statement

The authors have declared that no competing interests exist.

Figures

Fig 1
Fig 1. Map of California vector control agencies and counties included in analysis of effectiveness of vector index and California Response Plan, CA, 2009–2018.
County data courtesy of U.S. Census Bureau TIGER/line spatial files, 2016 (https://www.census.gov/geographies/mapping-files/time-series/geo/tiger-line-file.2016.html). Vector control agency data courtesy of Mosquito and Vector Control Association of California web map, 2018, (sources: ESRI, USGS, NOAA, TomTom, U.S. Department of Commerce, U.S. Census Bureau, NPS). (https://www.arcgis.com/apps/mapviewer/index.html?webmap=604a0fe9f2b74e98a53b53d192b2ac67).
Fig 2
Fig 2. Observed human WNV disease incidence in 3-week periods versus antecedent biweekly overall risk levels, based on temperature, abundance and at least 1 infection indicator, for Cx. tarsalis in California, 2009–2018.
Fig 3
Fig 3. Observed human WNV disease incidence in 3-week periods versus antecedent biweekly overall risk levels, based on temperature, abundance and at least 1 infection indicator, for the Cx. pipiens complex in California, 2009–2018.
Fig 4
Fig 4. Predicted incidence of human WNV disease with 95% confidence interval during 3-week periods over the range of biweekly overall risk levels for California, 2009–2018.
Fig 5
Fig 5. Comparison of predicted human WNV incidence using Cx. tarsalis-based response level models including all environmental components vs best drop-out model, with 95% confidence intervals, in California, 2009–2018.
Fig 6
Fig 6. Comparison of predicted human WNV incidence using Cx. pipiens complex-based response level models including all environmental components vs best drop-out model, with 95% confidence intervals, in California, 2009–2018.
Fig 7
Fig 7. Predicted human WNV incidence estimated using California Mosquito-Borne Virus Surveillance & Response Plan, with 95% confidence intervals, with observed mean human WNV incidence (as points), in California, 2009–2018.
Fig 8
Fig 8. Predicted human WNV incidence estimated using vector index, with 95% confidence intervals, with observed mean human WNV incidence (as points), in California, 2009–2018.

References

    1. Rosenberg R, Lindsey NP, Fischer M, Gregory CJ, Hinckley AF, Mead PS, et al.. Vital signs: trends in reported vectorborne disease cases—United States and Territories, 2004–2016. MMWR Morb Mortal Wkly Rep. 2018;67(17):496. doi: 10.15585/mmwr.mm6717e1 - DOI - PMC - PubMed
    1. McDonald E, Martin SW, Landry K, Gould CV, Lehman J, Fischer M, et al.. West Nile virus and Other domestic nationally notifiable arboviral diseases—United States, 2018. MMWR Morb Mortal Wkly Rep. 2019;68(31):673–8. doi: 10.15585/mmwr.mm6831a1 - DOI - PMC - PubMed
    1. Petersen L, Carson P, Biggerstaff B, Custer B, Borchardt S, Busch M. Estimated cumulative incidence of West Nile virus infection in US adults, 1999–2010. Epidemiol. Infect. 2013;141(3):591–5. doi: 10.1017/S0950268812001070 - DOI - PMC - PubMed
    1. Reisen WK. Ecology of West Nile virus in North America. Viruses. 2013;5(9):2079–105. doi: 10.3390/v5092079 ; PubMed Central PMCID: PMC3798891. - DOI - PMC - PubMed
    1. Rochlin I, Faraji A, Healy K, Andreadis TG. West Nile virus mosquito vectors in North America. J Med Entomol. 2019. Epub 2019/09/25. doi: 10.1093/jme/tjz146 . - DOI - PubMed

Publication types