

Meteorological factors and tick density affect the dynamics of SFTS in jiangsu province, China
- PMID: 35533208
- PMCID: PMC9119627
- DOI: 10.1371/journal.pntd.0010432
Meteorological factors and tick density affect the dynamics of SFTS in jiangsu province, China
Abstract
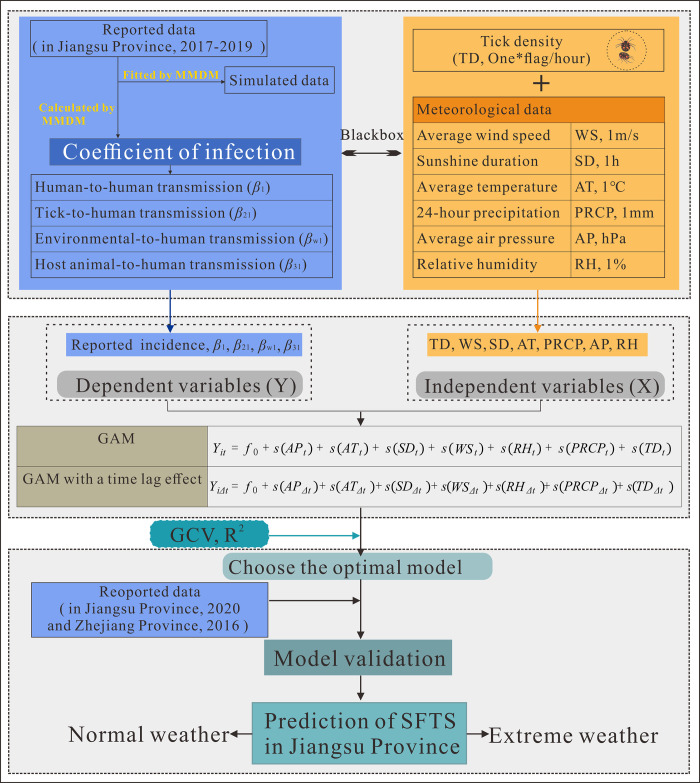
Background: This study aimed to explore whether the transmission routes of severe fever with thrombocytopenia syndrome (SFTS) will be affected by tick density and meteorological factors, and to explore the factors that affect the transmission of SFTS. We used the transmission dynamics model to calculate the transmission rate coefficients of different transmission routes of SFTS, and used the generalized additive model to uncover how meteorological factors and tick density affect the spread of SFTS.
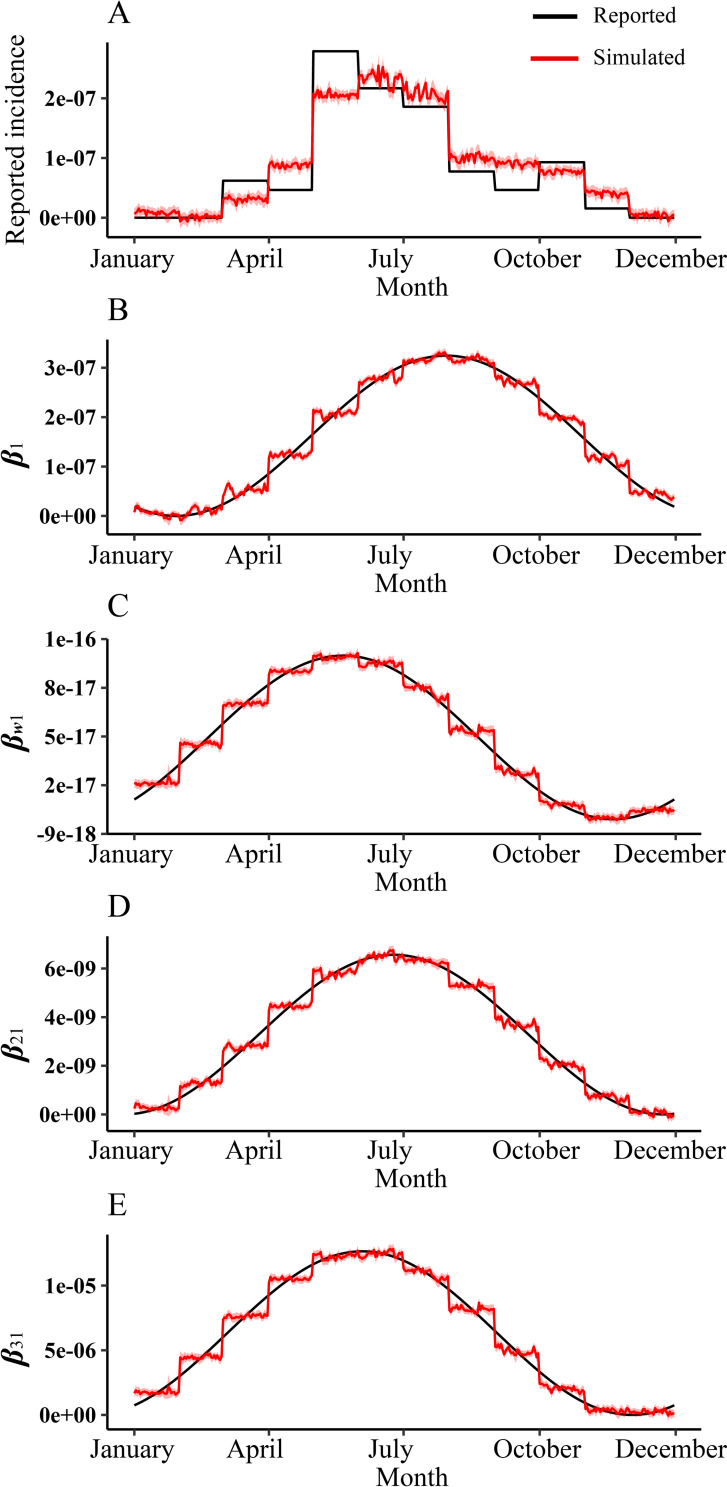
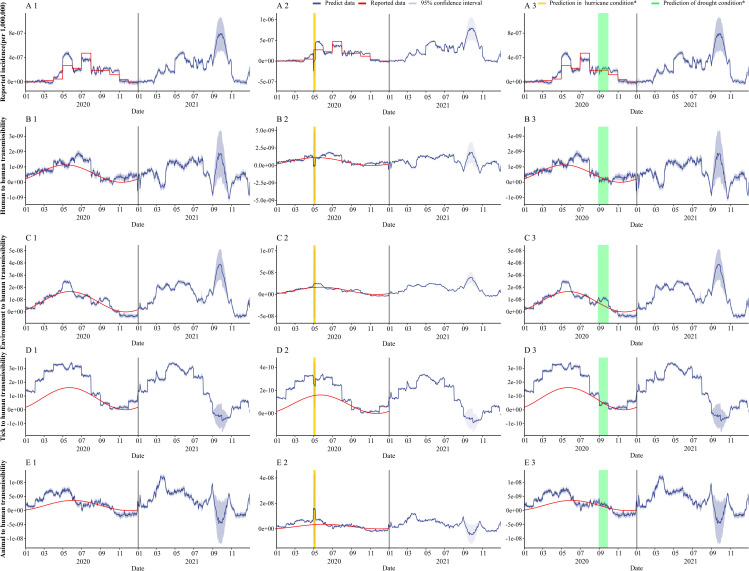
Methods: In this study, the time-varying infection rate coefficients of different transmission routes of SFTS in Jiangsu Province from 2017 to 2020 were calculated based on the previous multi-population multi-route dynamic model (MMDM) of SFTS. The changes in transmission routes were summarized by collecting questionnaires from 537 SFTS cases in 2018-2020 in Jiangsu Province. The incidence rate of SFTS and the infection rate coefficients of different transmission routes were dependent variables, and month, meteorological factors and tick density were independent variables to establish a generalized additive model (GAM). The optimal GAM was selected using the generalized cross-validation score (GCV), and the model was validated by the 2016 data of Zhejiang Province and 2020 data of Jiangsu Province. The validated GAMs were used to predict the incidence and infection rate coefficients of SFTS in Jiangsu province in 2021, and also to predict the effect of extreme weather on SFTS.
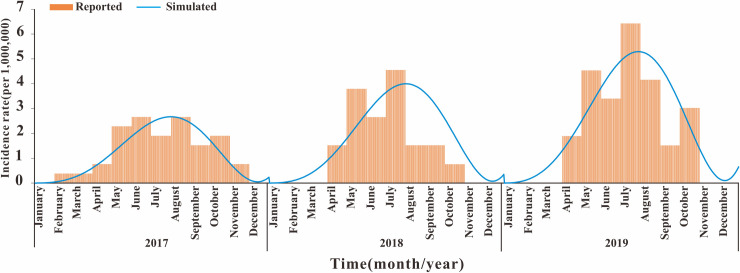
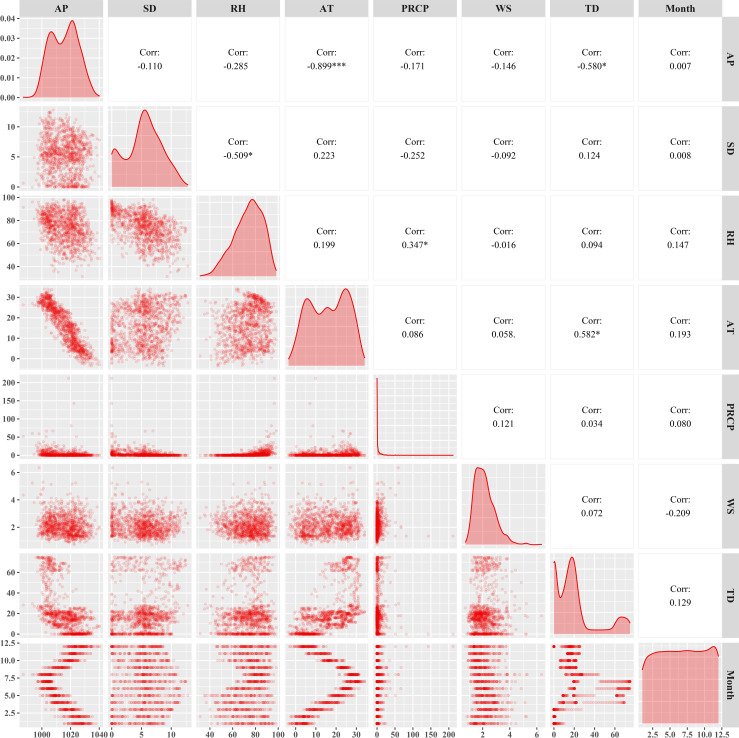
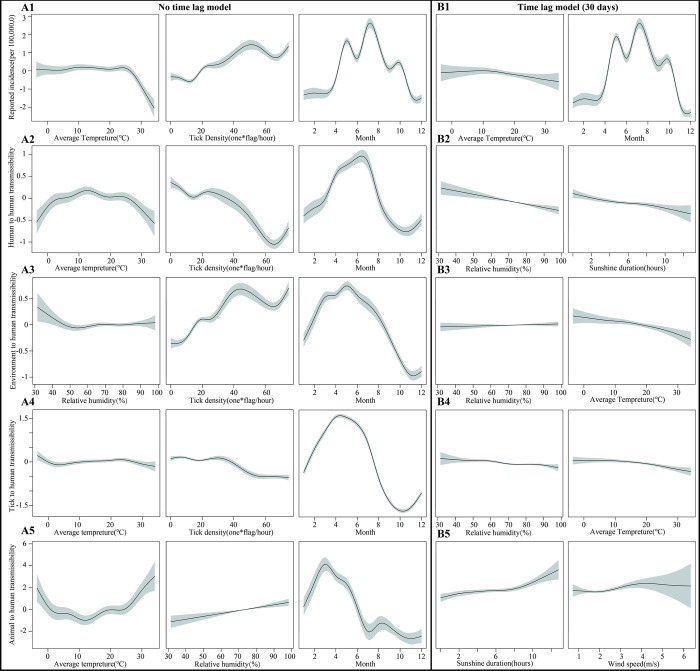
Results: The number and proportion of infections by different transmission routes for each year and found that tick-to-human and human-to-human infections decreased yearly, but infections through animal and environmental transmission were gradually increasing. MMDM fitted well with the three-year SFTS incidence data (P<0.05). The best intervention to reduce the incidence of SFTS is to reduce the effective exposure of the population to the surroundings. Based on correlation tests, tick density was positively correlated with air temperature, wind speed, and sunshine duration. The best GAM was a model with tick transmissibility to humans as the dependent variable, without considering lagged effects (GCV = 5.9247E-22, R2 = 96%). Reported incidence increased when sunshine duration was higher than 11 h per day and decreased when temperatures were too high (>28°C). Sunshine duration and temperature had the greatest effect on transmission from host animals to humans. The effect of extreme weather conditions on SFTS was short-term, but there was no effect on SFTS after high temperature and sunshine hours.
Conclusions: Different factors affect the infection rate coefficients of different transmission routes. Sunshine duration, relative humidity, temperature and tick density are important factors affecting the occurrence of SFTS. Hurricanes reduce the incidence of SFTS in the short term, but have little effect in the long term. The most effective intervention to reduce the incidence of SFTS is to reduce population exposure to high-risk environments.
Conflict of interest statement
The authors declare that they have no competing interests.
Figures

Similar articles
-
Epidemiological characteristics of severe fever with thrombocytopenia syndrome and its relationship with meteorological factors in Liaoning Province, China.Parasit Vectors. 2022 Aug 6;15(1):283. doi: 10.1186/s13071-022-05395-4. Parasit Vectors. 2022. PMID: 35933453 Free PMC article.
-
Factors Associated With the Spatial Distribution of Severe Fever With Thrombocytopenia Syndrome in Zhejiang Province, China: Risk Analysis Based on Maximum Entropy.JMIR Public Health Surveill. 2024 Aug 2;10:e46070. doi: 10.2196/46070. JMIR Public Health Surveill. 2024. PMID: 39104047 Free PMC article.
-
Spatial-temporal characteristics of severe fever with thrombocytopenia syndrome and the relationship with meteorological factors from 2011 to 2018 in Zhejiang Province, China.PLoS Negl Trop Dis. 2020 Apr 7;14(4):e0008186. doi: 10.1371/journal.pntd.0008186. eCollection 2020 Apr. PLoS Negl Trop Dis. 2020. PMID: 32255791 Free PMC article.
-
Relationship between meteorological factors and the incidence of severe fever with thrombocytopenia syndrome: a systematic review and meta-analysis.BMC Public Health. 2025 Jan 27;25(1):340. doi: 10.1186/s12889-025-21527-8. BMC Public Health. 2025. PMID: 39871274 Free PMC article.
-
[A review on the epidemiology of severe fever with thrombocytopenia syndrome].Zhonghua Liu Xing Bing Xue Za Zhi. 2021 Dec 10;42(12):2226-2233. doi: 10.3760/cma.j.cn112338-20210529-00439. Zhonghua Liu Xing Bing Xue Za Zhi. 2021. PMID: 34954991 Review. Chinese.
Cited by
-
Analysis of Differences in Characteristics of High-Risk Endemic Areas for Contracting Japanese Spotted Fever, Tsutsugamushi Disease, and Severe Fever With Thrombocytopenia Syndrome.Open Forum Infect Dis. 2024 Jan 16;11(2):ofae025. doi: 10.1093/ofid/ofae025. eCollection 2024 Feb. Open Forum Infect Dis. 2024. PMID: 38312217 Free PMC article.
-
Short-Term Effects of Meteorological Factors on Severe Fever With Thrombocytopenia Syndrome Incidence in Xinyang, China.Geohealth. 2025 Aug 4;9(8):e2025GH001440. doi: 10.1029/2025GH001440. eCollection 2025 Aug. Geohealth. 2025. PMID: 40765641 Free PMC article.
-
The ecological and etiological investigation of ticks and rodents in China: results from an ongoing surveillance study in Zhejiang Province.Front Vet Sci. 2023 Nov 28;10:1268440. doi: 10.3389/fvets.2023.1268440. eCollection 2023. Front Vet Sci. 2023. PMID: 38089699 Free PMC article.
-
Risk assessment of human-to-human transmission of severe fever with thrombocytopenia syndrome virus based on 10-year clustered analysis.Front Public Health. 2024 Oct 11;12:1419425. doi: 10.3389/fpubh.2024.1419425. eCollection 2024. Front Public Health. 2024. PMID: 39463898 Free PMC article.
-
Development and Comparison of Time Series Models in Predicting Severe Fever with Thrombocytopenia Syndrome Cases - Hubei Province, China, 2013-2020.China CDC Wkly. 2024 Sep 13;6(37):962-967. doi: 10.46234/ccdcw2024.200. China CDC Wkly. 2024. PMID: 39347448 Free PMC article.
References
-
- Robles NJC, Han HJ, Park SJ, Choi YK. Epidemiology of severe fever and thrombocytopenia syndrome virus infection and the need for therapeutics for the prevention. Clin Exp Vaccine Res. 2018;7(1):43–50. Epub 2018/02/06. doi: 10.7774/cevr.2018.7.1.43 ; PubMed Central PMCID: PMC5795044. - DOI - PMC - PubMed
-
- Lyu Y, Hu CY, Sun L, Qin W, Xu PP, Sun J, et al.. Impact of an intervention programme on knowledge, attitudes and practices of population regarding severe fever with thrombocytopenia syndrome in endemic areas of Lu’an, China. Epidemiol Infect. 2018;146(1):125–36. Epub 2017/11/28. doi: 10.1017/S0950268817002679 . - DOI - PMC - PubMed
-
- Li H, Lu QB, Xing B, Zhang SF, Liu K, Du J, et al.. Epidemiological and clinical features of laboratory-diagnosed severe fever with thrombocytopenia syndrome in China, 2011–17: a prospective observational study. Lancet Infect Dis. 2018;18(10):1127–37. Epub 2018/07/29. doi: 10.1016/S1473-3099(18)30293-7 . - DOI - PubMed
-
- Hu J, Shi C, Li Z, Guo X, Qian Y, Tan W, et al.. A cluster of cases of severe fever with thrombocytopenia syndrome bunyavirus infection in China, 1996: A retrospective serological study. PLoS Negl Trop Dis. 2018;12(6):e0006603. Epub 2018/06/26. doi: 10.1371/journal.pntd.0006603 ; PubMed Central PMCID: PMC6034904. - DOI - PMC - PubMed
Publication types
MeSH terms
LinkOut - more resources
Full Text Sources
