. 2022 May 9;18(5):e1010184.
doi: 10.1371/journal.pgen.1010184. eCollection 2022 May.

A Bayesian model selection approach to mediation analysis

Affiliations

A Bayesian model selection approach to mediation analysis

Wesley L Crouse et al. PLoS Genet. .

Abstract

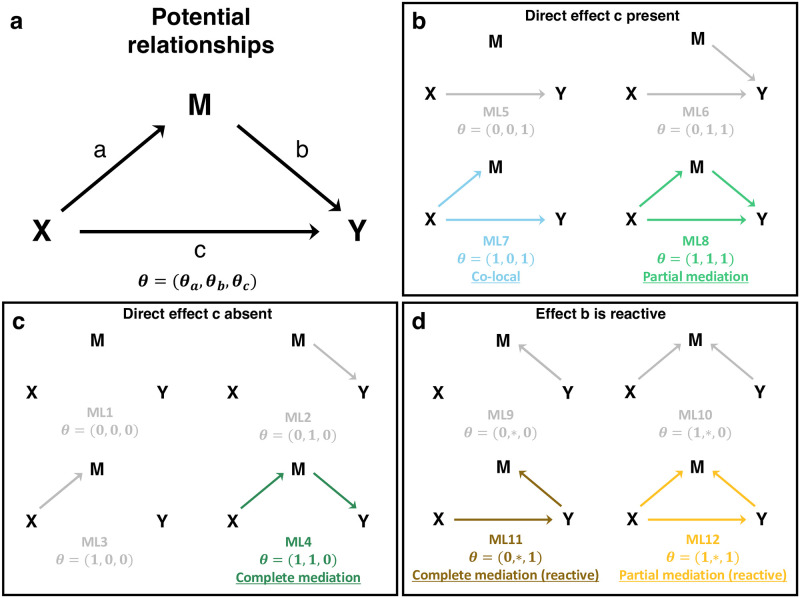
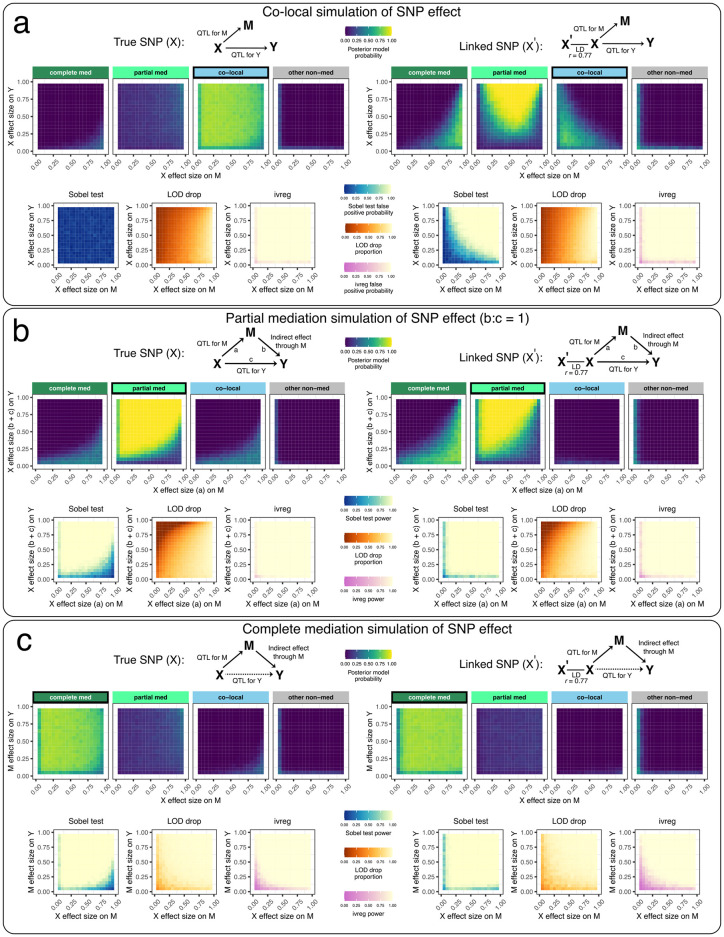
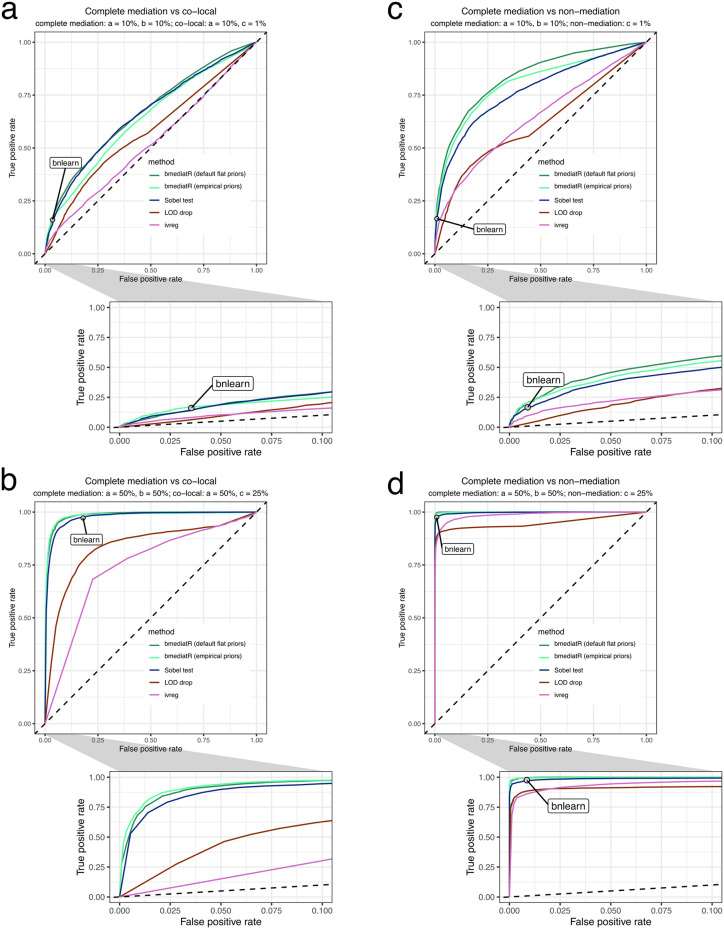
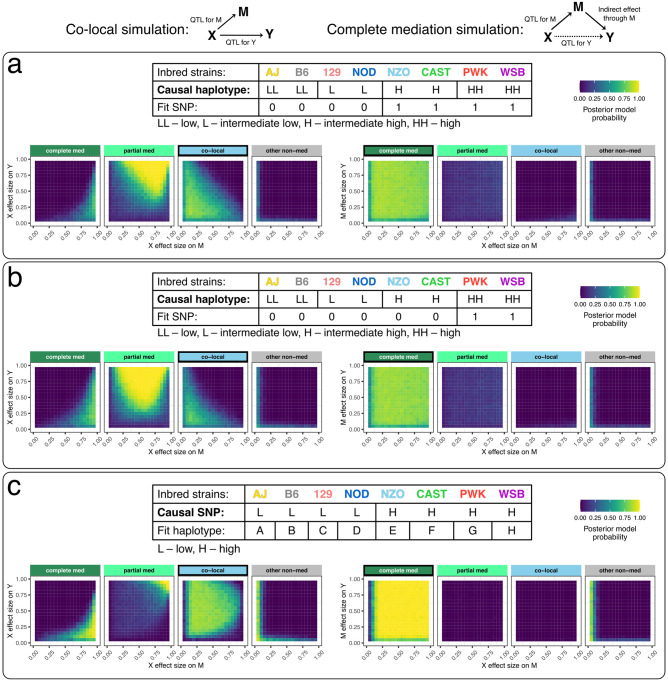
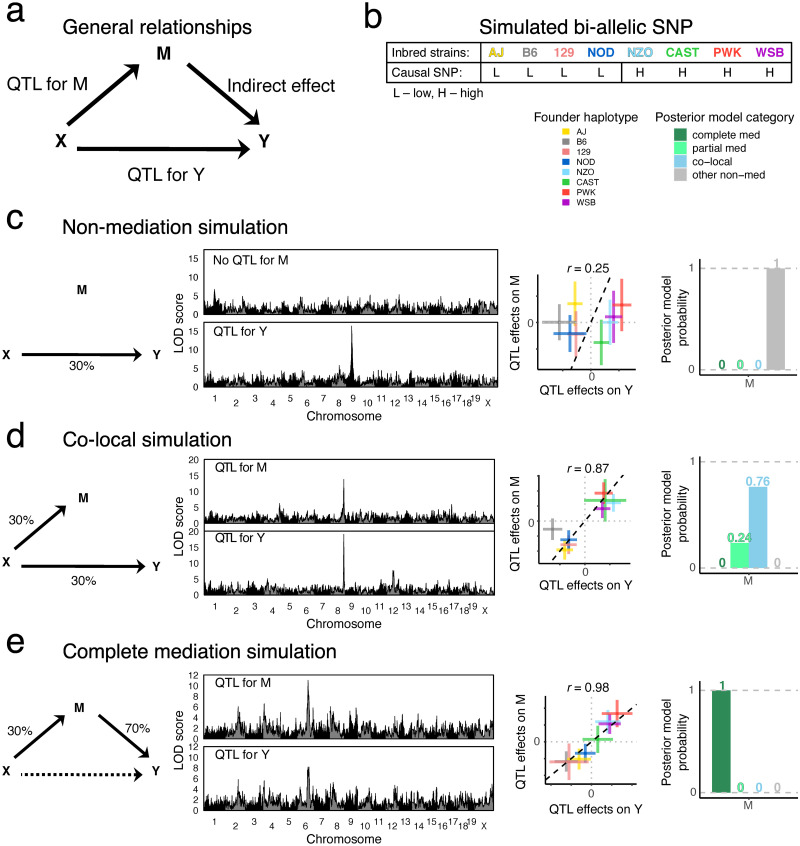
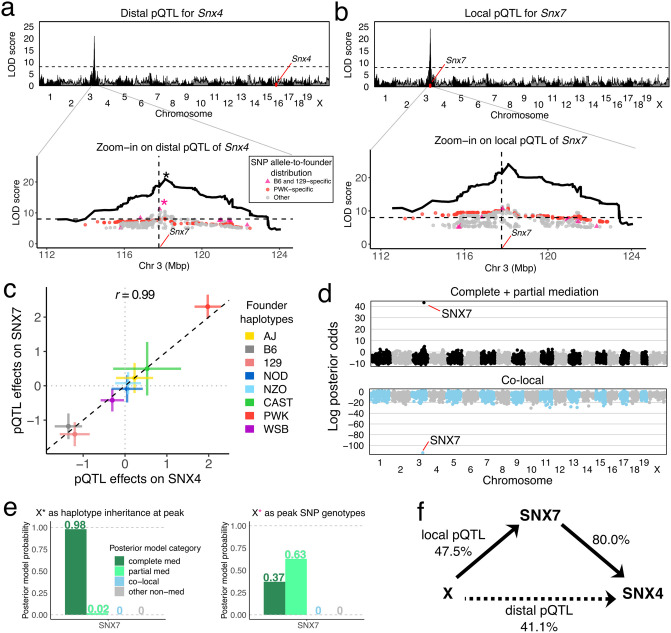
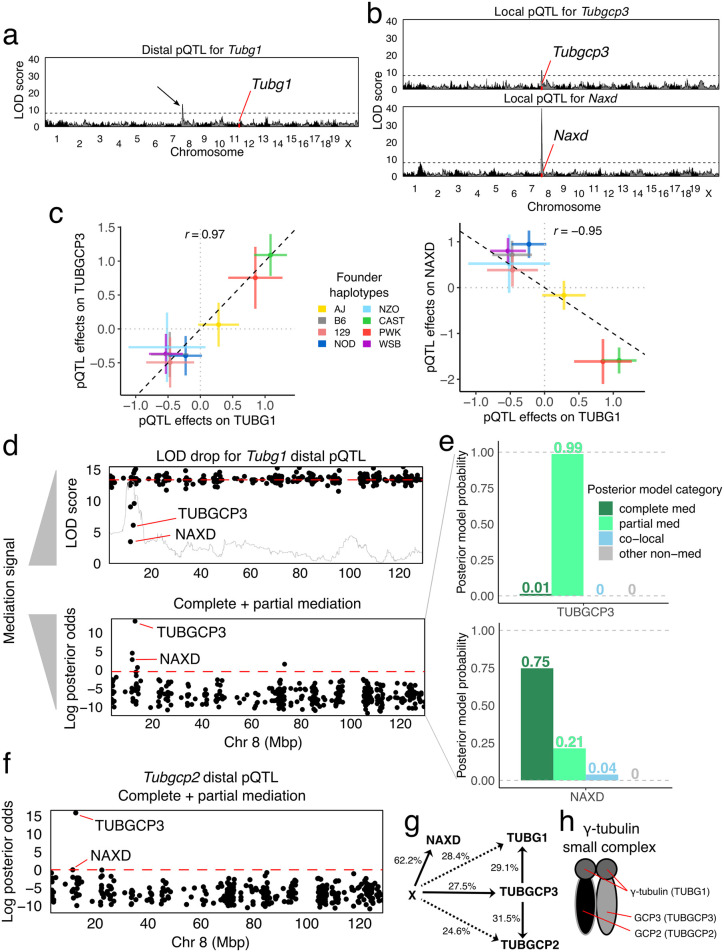
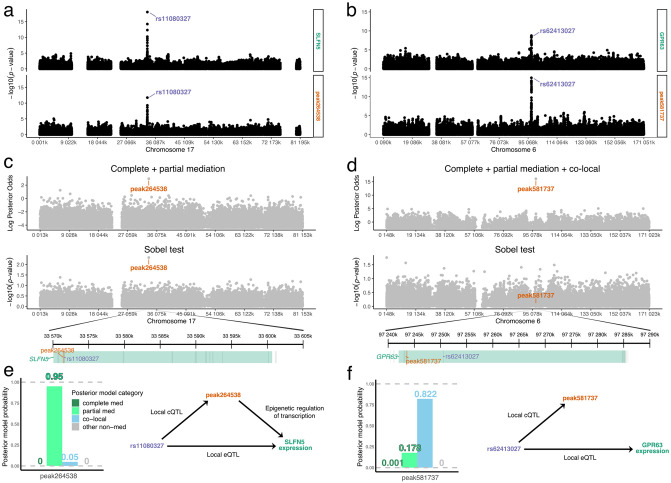
Genetic studies often seek to establish a causal chain of events originating from genetic variation through to molecular and clinical phenotypes. When multiple phenotypes share a common genetic association, one phenotype may act as an intermediate for the genetic effects on the other. Alternatively, the phenotypes may be causally unrelated but share genetic loci. Mediation analysis represents a class of causal inference approaches used to determine which of these scenarios is most plausible. We have developed a general approach to mediation analysis based on Bayesian model selection and have implemented it in an R package, bmediatR. Bayesian model selection provides a flexible framework that can be tailored to different analyses. Our approach can incorporate prior information about the likelihood of models and the strength of causal effects. It can also accommodate multiple genetic variants or multi-state haplotypes. Our approach reports posterior probabilities that can be useful in interpreting uncertainty among competing models. We compared bmediatR with other popular methods, including the Sobel test, Mendelian randomization, and Bayesian network analysis using simulated data. We found that bmediatR performed as well or better than these alternatives in most scenarios. We applied bmediatR to proteome data from Diversity Outbred (DO) mice, a multi-parent population, and demonstrate the power of mediation with multi-state haplotypes. We also applied bmediatR to data from human cell lines to identify transcripts that are mediated through or are expressed independently from local chromatin accessibility. We demonstrate that Bayesian model selection provides a powerful and versatile approach to identify causal relationships in genetic studies using model organism or human data.


Conflict of interest statement

The authors have declared that no competing interests exist.

Figures

Fig 1
Fig 1. Possible relationships among X, M, and Y.
X is assumed to be exogenous, and thus M and Y have no effects on X. A model and corresponding marginal likelihood (ML) are defined by the presence or absence of any of the three edges a, b, and c according to an indicator variable θ. In this work and by default in bmediatR, the direction of edge b is assumed to be from M to Y (M → Y), but a set of reactive models can also be accommodated in which the direction of edge b is reversed (M ← Y), indicated with θ = (θa, *, θc). Models can be favored or even excluded by adjusting the model priors. By default, there are five models (ML1–3 and ML5–6) that represent non-mediation, i.e., the effect of X on Y, if present, is not mediated through M. The co-local model (ML7) represents a special case where there is no mediation between X and Y, but X independently affects M and Y. The complete mediation model (ML4) and the partial mediation model (ML8) represent cases where the effect of X on Y is explained, completely or partially, by the effect of X on M.
Fig 2
Fig 2. Performance of Bayesian model selection, Sobel test, LOD drop, and IV regression in simulated data with a binary exogenous variable.
Data for 200 individuals were simulated according to (a) co-local, (b) partial mediation, and (c) complete mediation models based on a balanced bi-allelic variant X. We applied causal analysis with X as the true variant (left) and as a variant in linkage disequilibrium (r = 0.77) with the true variant (right). DAGs indicate the model used to simulate the data. Heat maps for Bayesian model selection represent the mean posterior probability associated with each inferred model for a range of fixed settings of the model parameters as indicated on x- and y-axes, each simulated 100 times. Heat maps for the Sobel test and IV regression represent false positive probability for co-local simulations and power for mediation simulations. Heat maps for LOD drop represent mean LOD drop, scaled to the proportion of the simulated QTL’s LOD score. See S1 and S2 Figs for Bayesian model selection results using empirical effect size priors and non-default model priors, including reactive. See S4 and S5 Figs for similar results from the other methods.
Fig 3
Fig 3. Performance of Bayesian model selection compared with other methods in distinguishing complete mediation from (a-b) co-local and (c-d) non-mediation.
True positive rates (power) and false positive rates over a range of (p-value or posterior probability) thresholds were estimated from 5,000 simulations of 24 individuals according to a balanced bi-allelic variant X. Results are shown for data simulated with both (a-c) small genetic effects (X → M: 10%, M → Y: 10%) and (b-d) large genetic effects (X → M: 50%, M → Y: 50%). Diagonal dashed line is included for reference, representing a classifier with no ability to distinguish complete mediation from co-local or non-mediation. Note that bnlearn is represented by a point rather than a curve because (in our use of that method) it returns only a single, optimum model and so is not amenable to thresholding. See S7 Fig for methods’ performance in distinguishing partial mediation from co-local and non-mediation.
Fig 4
Fig 4. Performance of Bayesian model selection in simulated data with a multi-state exogenous variable.
Data for 200 individuals were simulated according to co-local (left) and complete mediation (right) models. DAGs indicate the model used to simulate the data. (a-b) The genetic effect assumes four functional alleles with balanced allele frequencies (25%). Mediation analysis was performed using (a) a variant that tags the two higher functional alleles and (b) a variant that tags only the highest functional allele. (c) Data from a bi-allelic variant with allele frequency 50% were simulated, and mediation analysis performed using 8 founder haplotype states. The tables describe the structure of the genetic effect X used to simulate the data (causal) versus the X used in the mediation analysis (fit), in terms of the distribution of alleles among the founder strains. For example in (a), the low and intermediate low functional alleles are tagged by one allele of the fit SNP and the high and intermediate high functional alleles are tagged by the other allele of the fit SNP. Heat maps for Bayesian model selection represent the mean posterior probability associated with each inferred model for a range of fixed settings of the model parameters as indicated on x- and y-axes, each simulated 100 times.
Fig 5
Fig 5. Illustration of Bayesian model selection applied to QTL mapping with simulated DO mouse data.
(a) The DAG is labeled to indicate how each arm in the mediation model is interpreted in the QTL mapping setting. Y and M were simulated based on a bi-allelic QTL X at a randomly selected locus, with (b) each allele distributed to four founder strains. Genome-wide genotype data were obtained from 192 DO mice, according to one of three models: (c) M is a non-mediator of X on Y, (d) M and Y are independently driven by X (co-local), and (e) M is a complete mediator of X on Y, as illustrated with the corresponding model DAG with the simulated effect sizes indicated in units of percent variance explained (left). Genome-wide LOD scores for QTL mapping of M and Y, a scatter plot of the founder haplotype effects at the QTL for M and Y, and the Bayesian model selection posterior model probabilities are shown (from left to right).
Fig 6
Fig 6. Mediation analysis of a distal pQTL for Snx4 in DO mice.
Genome-wide LOD scores for associations of (a) SNX4 and (b) SNX7 abundance were performed using founder haploptye linkage mapping. Zooming into the QTL region, LOD scores for variant association within the pQTL region (peak ± 5 Mbp) for bi-allelic vartiants with LOD scores > 5 are overlaid on the haplotype association LOD curve. Variants with alleles specific to B6 and 129 (pink) and PWK (red) are highlighted. (c) The founder haplotype effects at the pQTL are multi-allelic and highly similar for the two proteins. (d) Genome-wide mediation scan where all observed proteins are individually evaluated as mediators of the Snx4 distal pQTL highlights SNX7 as a mediator (complete and partial summed) and strongly indicates that the co-local model is unlikely. Each point represents the log posterior odds for a candidate mediator for the specified mediation model. (e) Posterior probabilities of mediation models for the pQTL (left) using founder haplotypes and (right) using the peak bi-allelic variant. (f) The complete mediation model with SNX7 as mediator of the Snx4 distal pQTL is shown as a DAG with estimated effect sizes in units of percent variance explained. The dashed line indicates the strength of the distal pQTL that is not included in the model because it is completely mediated.
Fig 7
Fig 7. Mediation analysis of a distal pQTL for Tubg1 in DO mice.
(a) Genome-wide LOD scores for TUBG1 abundance. Black arrow indicates distal pQTL on chromosome 8. (b) Genome-wide LOD scores for two genes, Tubgcp3 (top) and Naxd (bottom), with co-mapping local pQTL. (c) Comparison of the founder haplotype effects of the Tubg1 pQTL with Tubgcp3 (left) and Naxd (right) pQTL. (d) Mediation scans of all observed proteins on chromosome 8 by LOD drop with an overlay of the pQTL LOD scores in gray (top) and Bayesian model selection log posterior odds for mediation (bottom) show different prioritization for candidate mediators NAXD and TUBCP3. Note that low LOD drop scores indicate stronger mediation signal. (e) Posterior model probabilities for the Tubg1 distal pQTL for candidate mediators (top) TUBGCP3 and (bottom) NAXD. (f) Mediation scan for the Tubgcp2 distal pQTL identifies TUBGCP3 as the best candidate mediator. (g) The DAG summarizes the mediation analysis results with effect size estimates shown as percent variance explained. Dashed lines indicate the strength of distal pQTL effects that are not part of the model assuming complete mediation through TUBGCP3. (h) TUBG1, TUBGCP2, and TUBGCP3 comprise the γ-tubulin small complex.
Fig 8
Fig 8. Mediation analysis of local chromatin state and gene expression data in human cell lines.
SNP associations with (a) SLFN5 and (b) GPR63 expression (top) and nearby chromatin accessibility (bottom) for variants on the genes’ chromosome. Peak SNPs are labeled. Mediation results for the (c) SLFN5 eQTL and (d) GPR63 eQTL. Log posterior odds from Bayesian model selection (top), -log10 p-values from Sobel test (middle), and zoomed-in window highlighting gene start, peak SNP, and peak mediator (bottom). Peak mediator or co-local chromatin peak is labeled. Each gray point represents a chromatin peak candidate mediator located near the gene of interest. For SLFN5 expression, complete and partial mediation models were summed in the posterior summary from Bayesian model selection. For GPR63 expression, the co-local model was also summed with the mediation models. Posterior model probabilities from Bayesian model selection for the peak mediator and co-local chromatin peaks and the implied DAG for the (e) SLFN5 eQTL and (f) GPR63 eQTL.

Similar articles

Cited by

References

    1. Judd CM, Kenny DA. Data Analysis in Social Psychology: Recent and Recurring Issues. In: Fiske ST, Gilbert DT, Lindzey G, editors. Handbook of Social Psychology. Hoboken, N.J.: American Cancer Society; 2010. Available from: https://onlinelibrary.wiley.com/doi/abs/10.1002/9780470561119.socpsy001004. - DOI
    1. MacKinnon DP, Fairchild AJ, Fritz MS. Mediation Analysis. Annual Review of Psychology. 2007;58(1):593–614. doi: 10.1146/annurev.psych.58.110405.085542 - DOI - PMC - PubMed
    1. Raulerson CK, Ko A, Kidd JC, Currin KW, Brotman SM, Cannon ME, et al.. Adipose Tissue Gene Expression Associations Reveal Hundreds of Candidate Genes for Cardiometabolic Traits. The American Journal of Human Genetics. 2019;105(4):773–787. doi: 10.1016/j.ajhg.2019.09.001 - DOI - PMC - PubMed
    1. Yao DW, O’Connor LJ, Price AL, Gusev A. Quantifying genetic effects on disease mediated by assayed gene expression levels. Nature Genetics. 2020;52(6):626–633. doi: 10.1038/s41588-020-0625-2 - DOI - PMC - PubMed
    1. Chick JM, Munger SC, Simecek P, Huttlin EL, Choi K, Gatti DM, et al.. Defining the consequences of genetic variation on a proteome-wide scale. Nature. 2016;534(7608):500–5. doi: 10.1038/nature18270 - DOI - PMC - PubMed