

Genome-wide association study of platelet factor 4/heparin antibodies in heparin-induced thrombocytopenia
- PMID: 35533259
- PMCID: PMC9327558
- DOI: 10.1182/bloodadvances.2022007673
Genome-wide association study of platelet factor 4/heparin antibodies in heparin-induced thrombocytopenia
Abstract
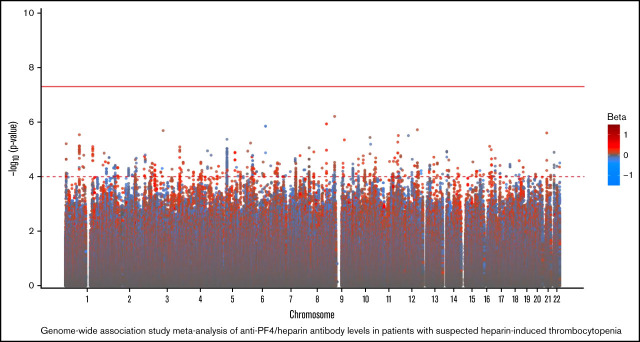
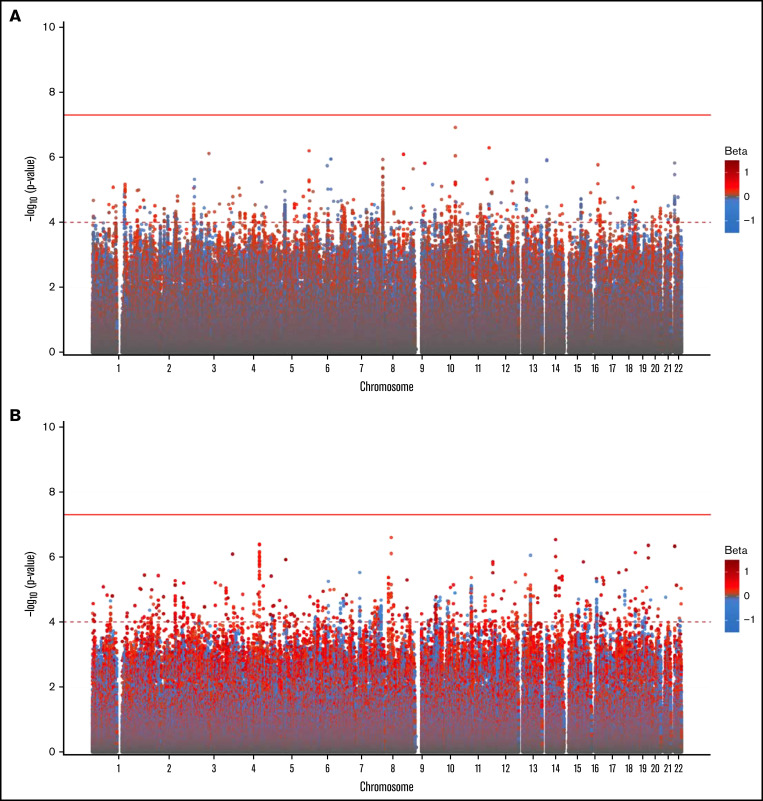
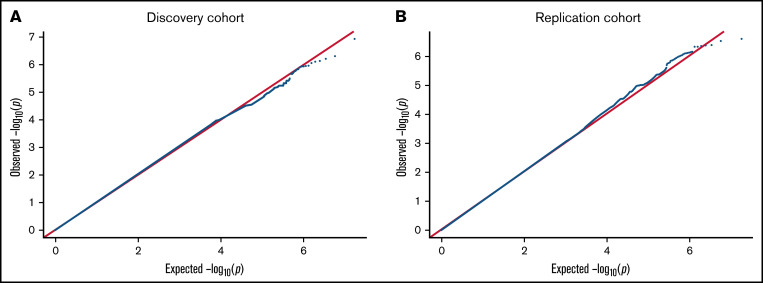
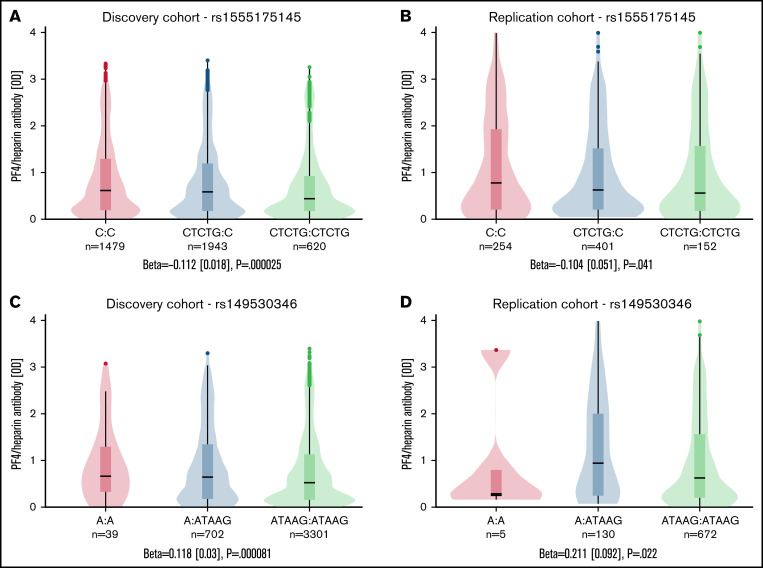
Heparin, a widely used anticoagulant, carries the risk of an antibody-mediated adverse drug reaction, heparin-induced thrombocytopenia (HIT). A subset of heparin-treated patients produces detectable levels of antibodies against complexes of heparin bound to circulating platelet factor 4 (PF4). Using a genome-wide association study (GWAS) approach, we aimed to identify genetic variants associated with anti-PF4/heparin antibodies that account for the variable antibody response seen in HIT. We performed a GWAS on anti-PF4/heparin antibody levels determined via polyclonal enzyme-linked immunosorbent assays. Our discovery cohort (n = 4237) and replication cohort (n = 807) constituted patients with European ancestry and clinical suspicion of HIT, with cases confirmed via functional assay. Genome-wide significance was considered at α = 5 × 10⁻⁸. No variants were significantly associated with anti-PF4/heparin antibody levels in the discovery cohort at a genome-wide significant level. Secondary GWAS analyses included the identification of variants with suggestive associations in the discovery cohort (α = 1 × 10⁻⁴). The top variant in both cohorts was rs1555175145 (discovery β = -0.112 [0.018], P = 2.50 × 10⁻⁵; replication β = -0.104 [0.051], P = .041). In gene set enrichment analysis, 3 gene sets reached false discovery rate-adjusted significance (q < 0.05) in both discovery and replication cohorts: "Leukocyte Transendothelial Migration," "Innate Immune Response," and "Lyase Activity." Our results indicate that genomic variation is not significantly associated with anti-PF4/heparin antibody levels. Given our power to identify variants with moderate frequencies and effect sizes, this evidence suggests genetic variation is not a primary driver of variable antibody response in heparin-treated patients with European ancestry.
© 2022 by The American Society of Hematology. Licensed under Creative Commons Attribution-NonCommercial-NoDerivatives 4.0 International (CC BY-NC-ND 4.0), permitting only noncommercial, nonderivative use with attribution. All other rights reserved.
Figures
References
-
- Jang I-K, Hursting MJ. When heparins promote thrombosis: review of heparin-induced thrombocytopenia. Circulation. 2005;111(20):2671-2683. - PubMed
-
- Martel N, Lee J, Wells PS. Risk for heparin-induced thrombocytopenia with unfractionated and low-molecular-weight heparin thromboprophylaxis: a meta-analysis. Blood. 2005;106(8):2710-2715. - PubMed
-
- Kelton JG, Sheridan D, Santos A, et al. . Heparin-induced thrombocytopenia: laboratory studies. Blood. 1988;72(3):925-930. - PubMed
Publication types
MeSH terms
Substances
Grants and funding
LinkOut - more resources
Full Text Sources
Miscellaneous
