

Accuracy of head computed tomography scoring systems in predicting outcomes for patients with moderate to severe traumatic brain injury: A ProTECT III ancillary study
- PMID: 35533263
- PMCID: PMC9893165
- DOI: 10.1177/19714009221101313
Accuracy of head computed tomography scoring systems in predicting outcomes for patients with moderate to severe traumatic brain injury: A ProTECT III ancillary study
Abstract
Background: Several types of head CT classification systems have been developed to prognosticate and stratify TBI patients.
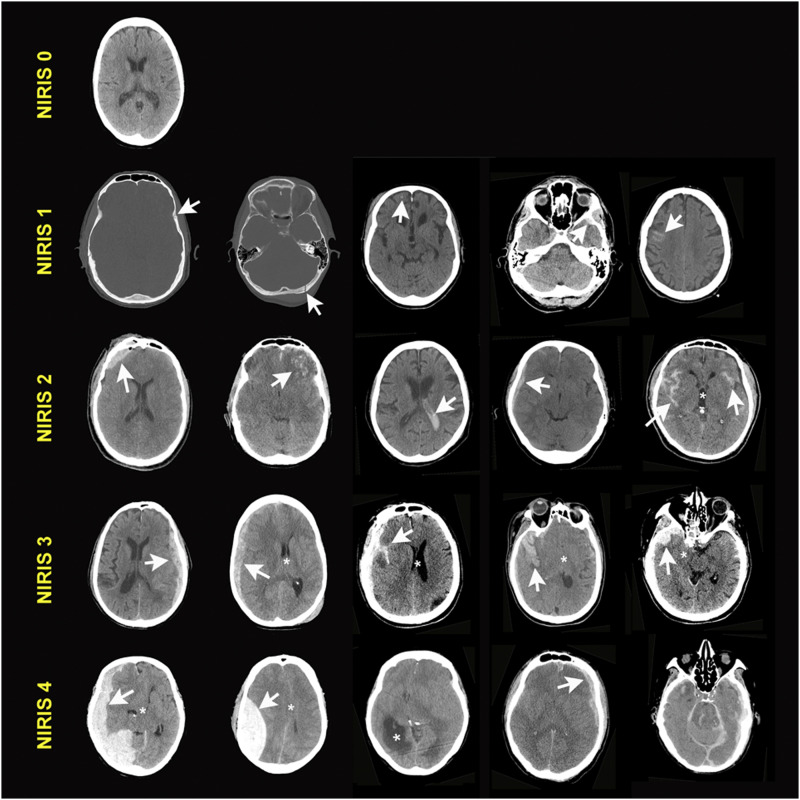
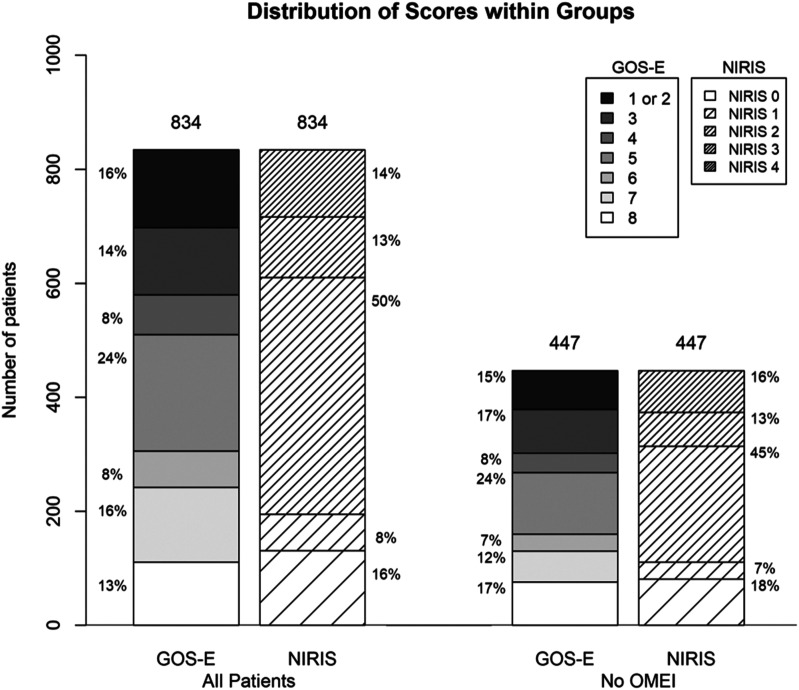
Objective: The purpose of our study was to compare the predictive value and accuracy of the different CT scoring systems, including the Marshall, Rotterdam, Stockholm, Helsinki, and NIRIS systems, to inform specific patient management actions, using the ProTECT III population of patients with moderate to severe acute traumatic brain injury (TBI).
Methods: We used the data collected in the patients with moderate to severe (GCS score of 4-12) TBI enrolled in the ProTECT III clinical trial. ProTECT III was a NIH-funded, prospective, multicenter, randomized, double-blind, placebo-controlled clinical trial designed to determine the efficacy of early administration of IV progesterone. The CT scoring systems listed above were applied to the baseline CT scans obtained in the trial. We assessed the predictive accuracy of these scoring systems with respect to Glasgow Outcome Scale-Extended at 6 months, disability rating scale score, and mortality.
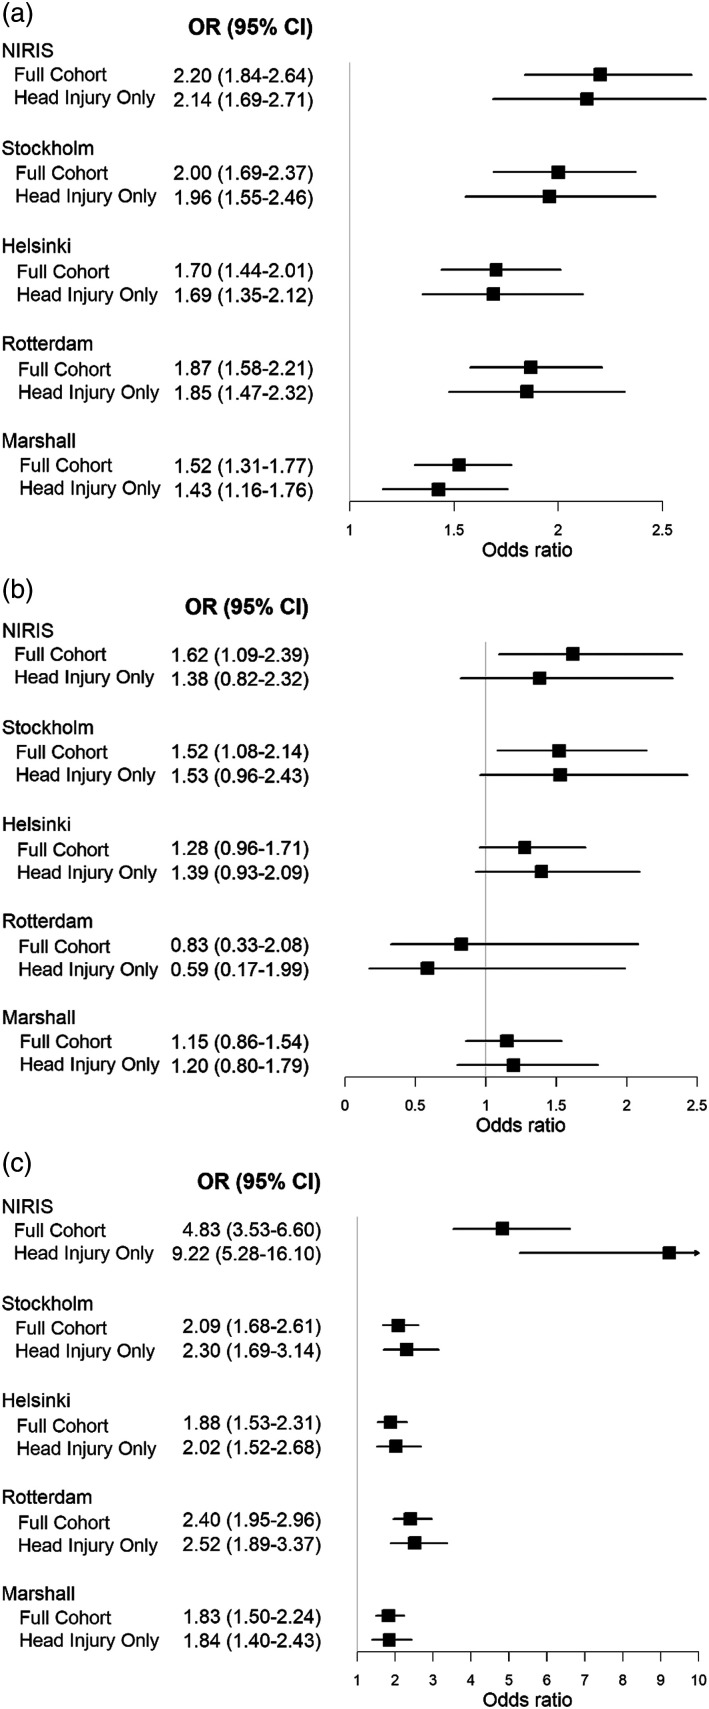
Results: A total of 882 subjects were enrolled in ProTECT III. Worse scores for each head CT scoring systems were highly correlated with unfavorable outcome, disability outcome, and mortality. The NIRIS classification was more strongly correlated than the Stockholm and Rotterdam CT scores, followed by the Helsinki and Marshall CT classification. The highest correlation was observed between NIRIS and mortality (estimated odds ratios of 4.83).
Conclusion: All scores were highly associated with 6-month unfavorable, disability and mortality outcomes. NIRIS was also accurate in predicting TBI patients' management and disposition.
Keywords: Clinical decision support; TBI; common data elements CT; outcome.
Conflict of interest statement
The author(s) declared no potential conflicts of interest with respect to the research, authorship, and/or publication of this article.
Figures
References
-
- Feigin V.L., Theadom A., Barker-Collo S., et al. Incidence of traumatic brain injury in New Zealand: a population-based study. Lancet Neurol 2013; 12(1): 53–64. - PubMed
-
- Babl FE, Borland ML, Phillips N, et al. Paediatirc Research in Emergency Departments International Collaborative (PREDICT) accuracy of PECARN, CATCH, and CHALICE head injury decision rules in children: a prospective cohort study. Lancet 2017; 389(10087): 2393–2402. - PubMed
Publication types
MeSH terms
LinkOut - more resources
Full Text Sources
Medical
