. 2022 Aug 5;20(8):1208-1221.
doi: 10.1158/1541-7786.MCR-21-0888.

MUC16 Promotes Liver Metastasis of Pancreatic Ductal Adenocarcinoma by Upregulating NRP2-Associated Cell Adhesion

Affiliations

MUC16 Promotes Liver Metastasis of Pancreatic Ductal Adenocarcinoma by Upregulating NRP2-Associated Cell Adhesion

Saravanakumar Marimuthu et al. Mol Cancer Res. .

Abstract

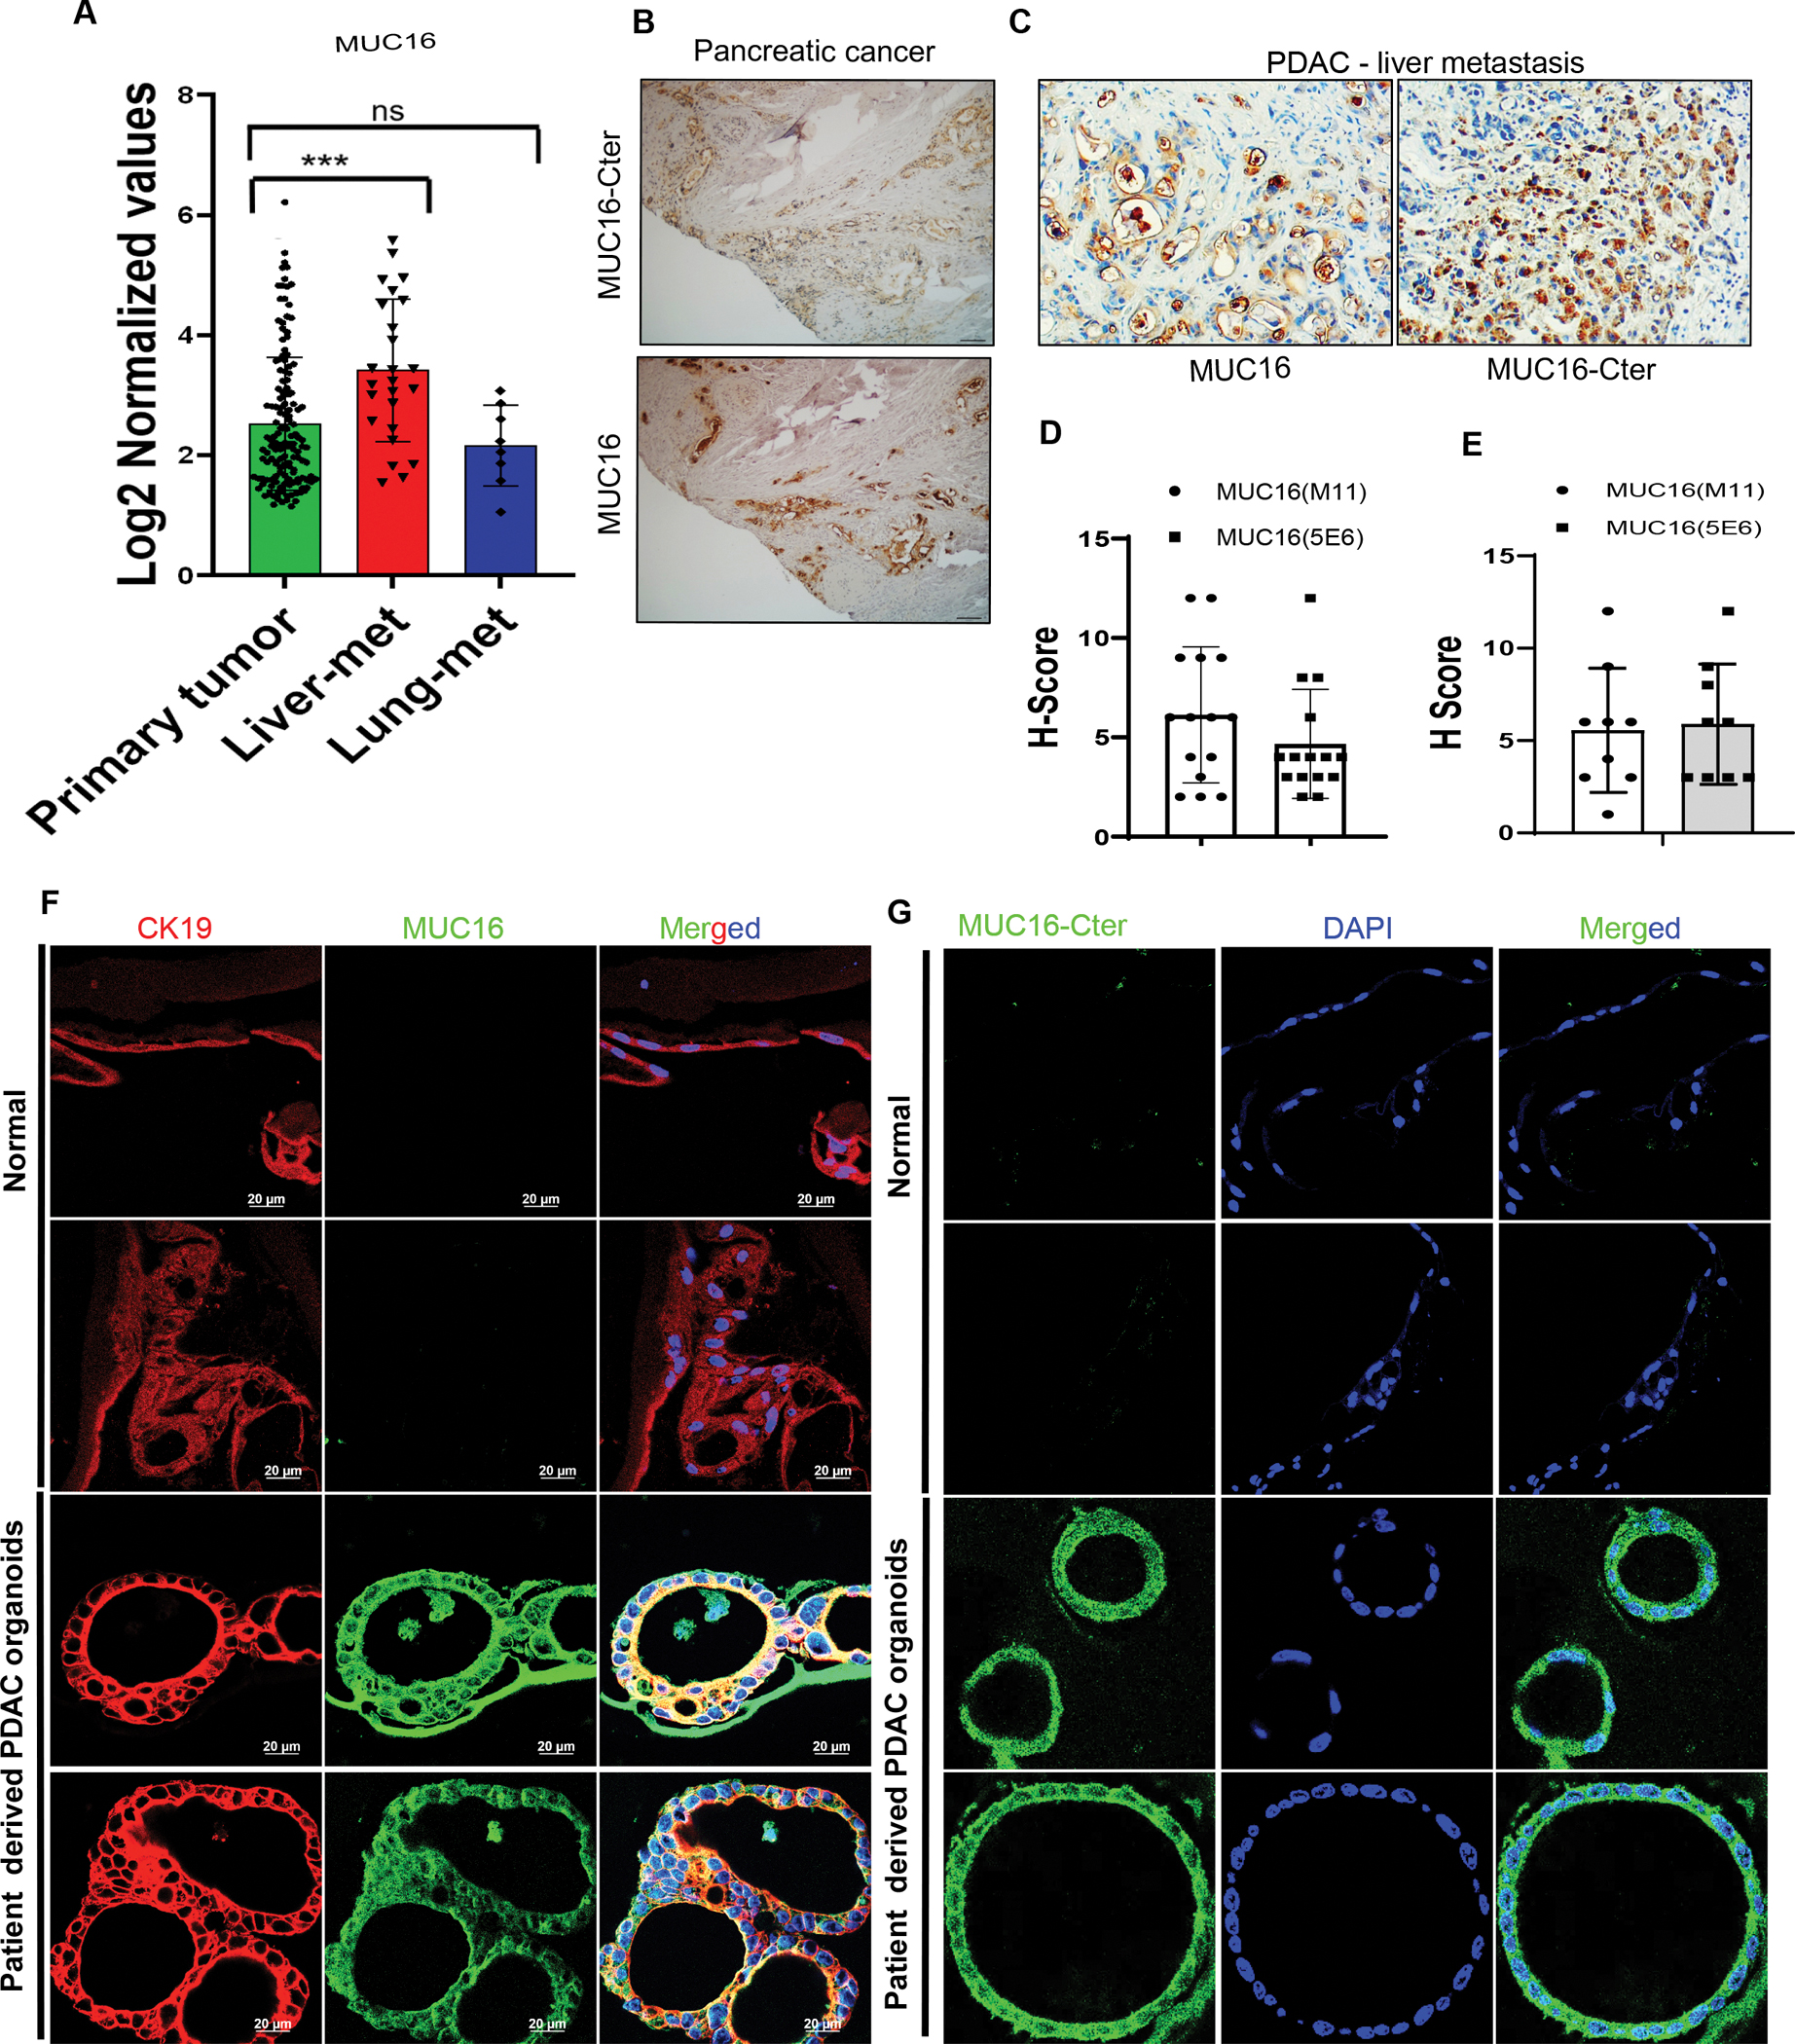
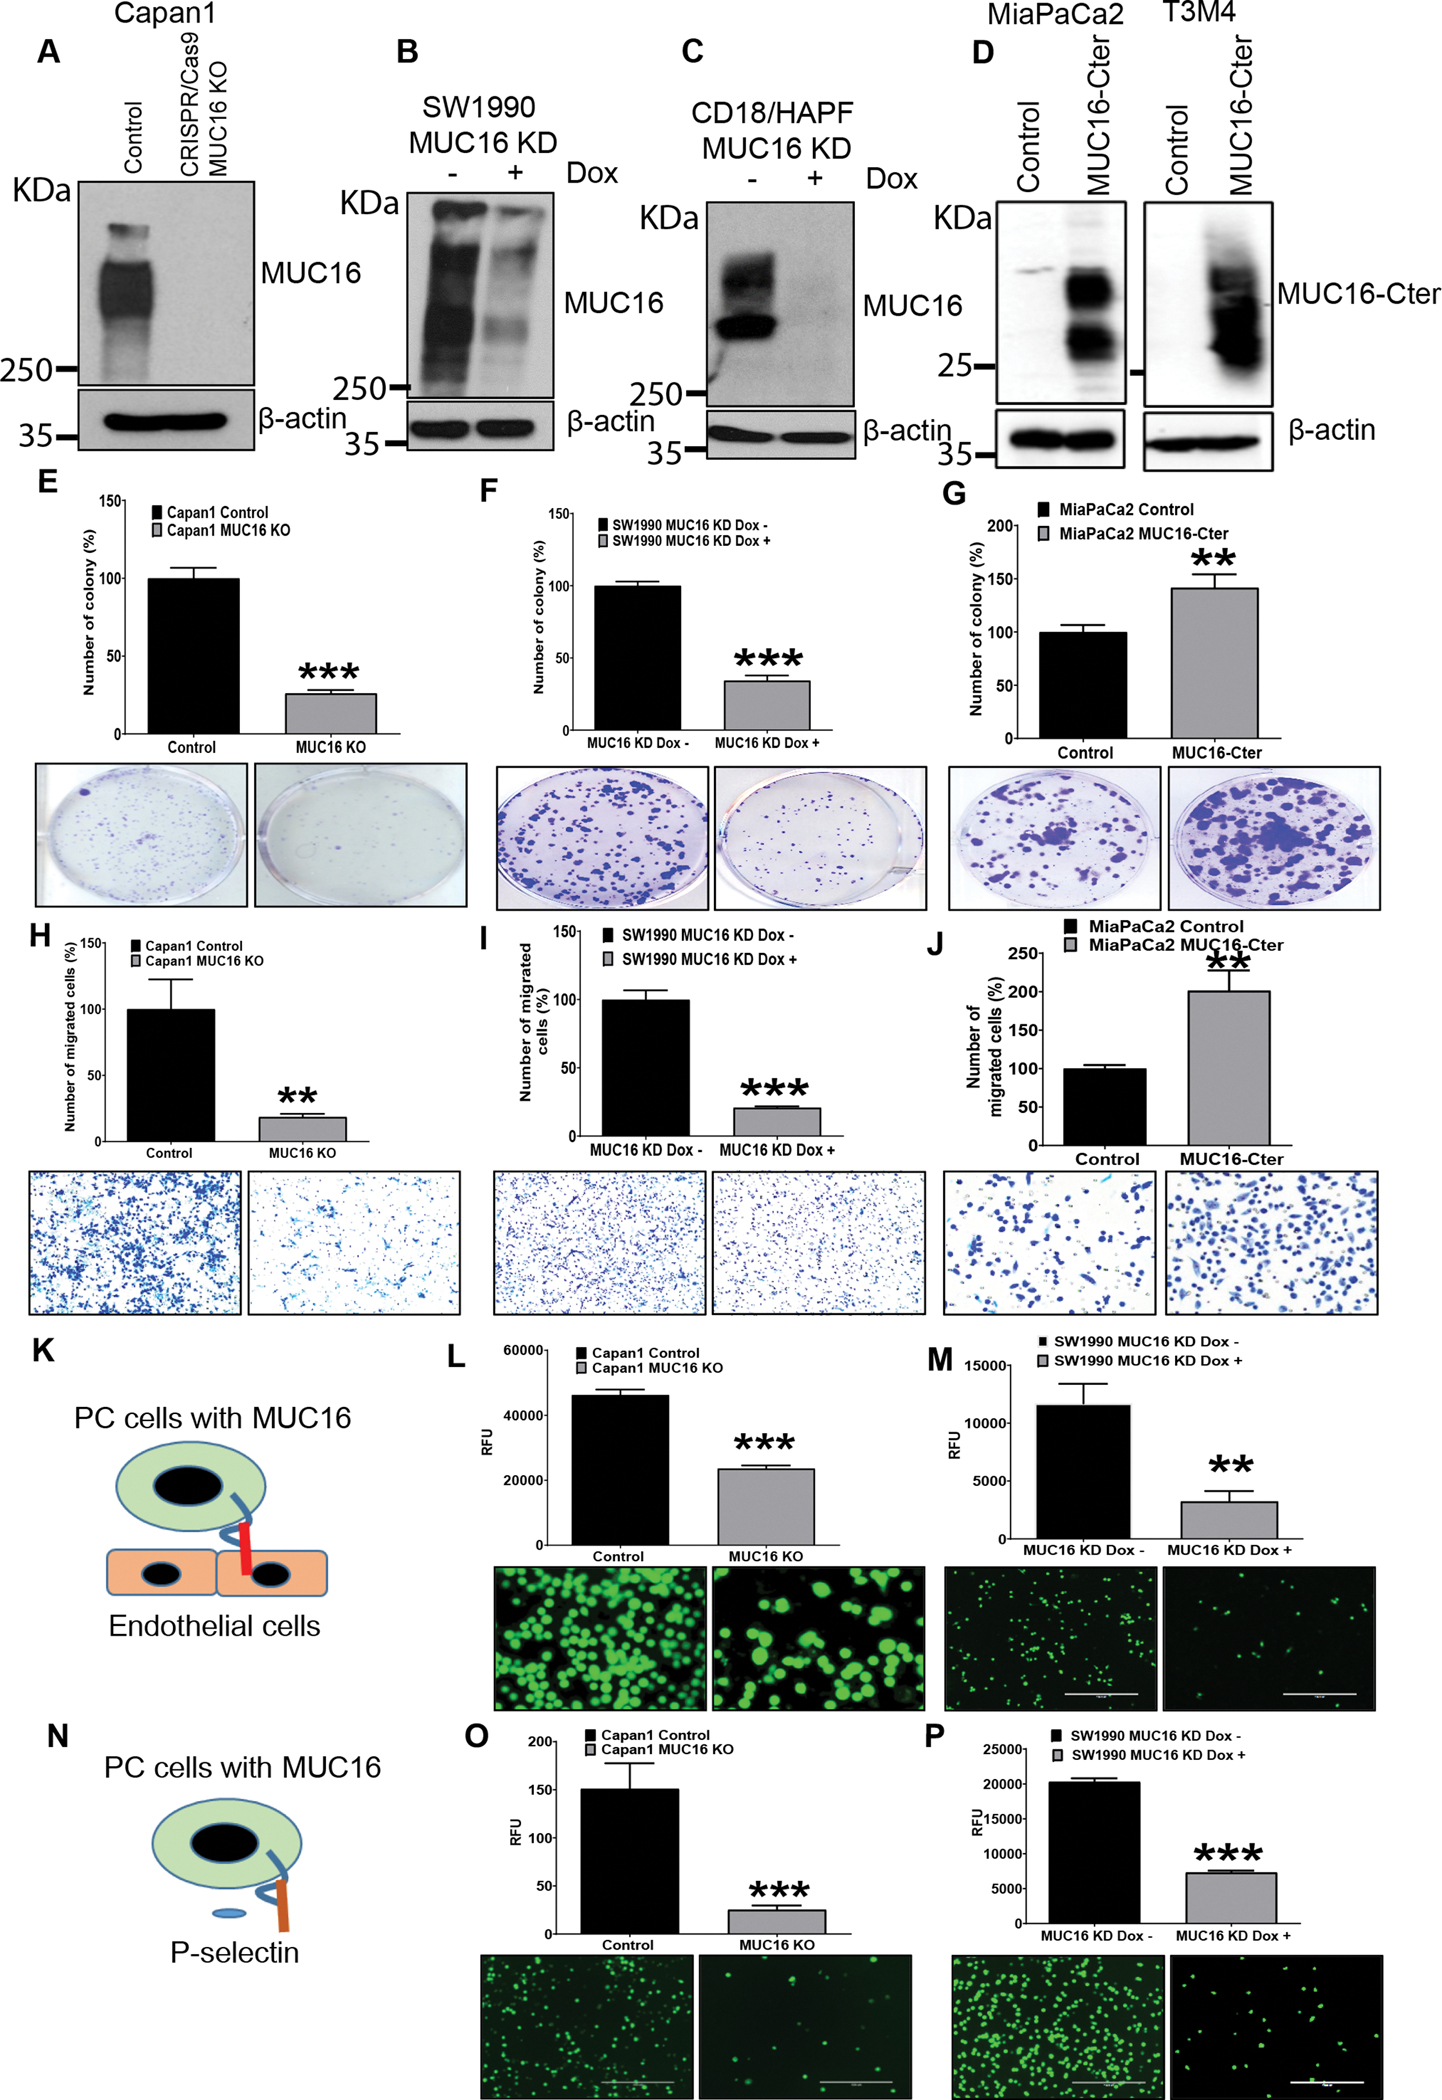
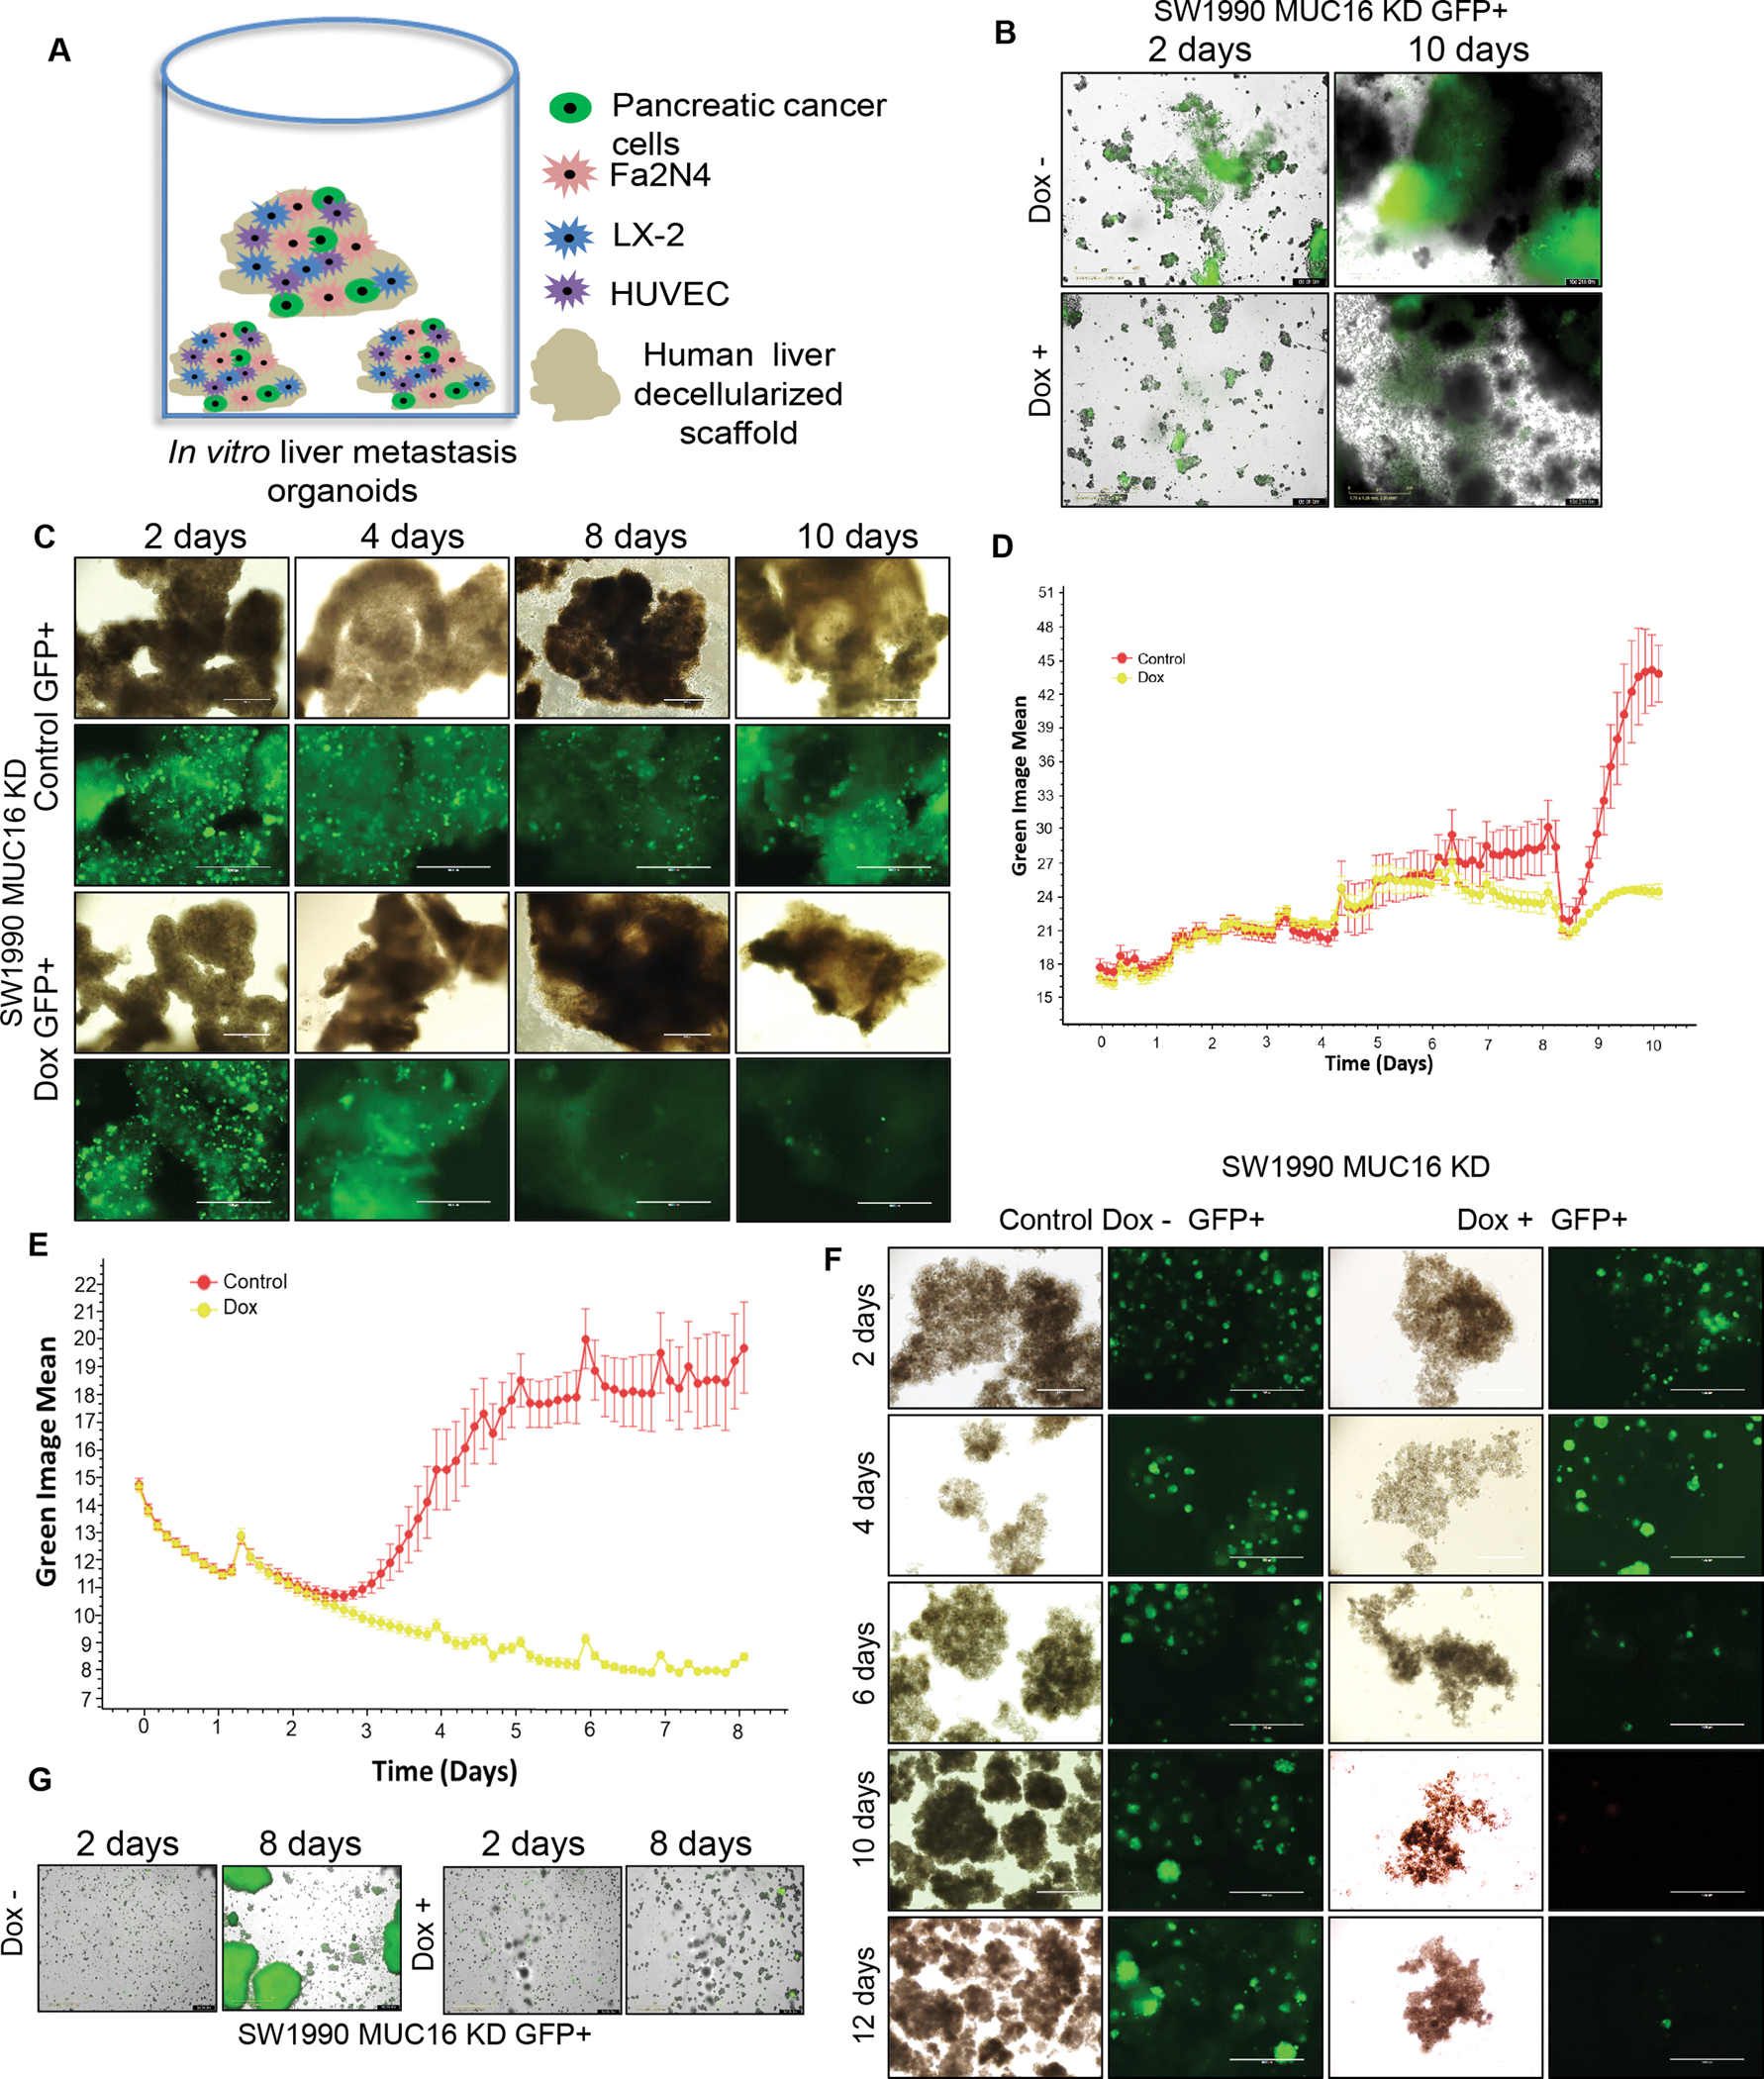
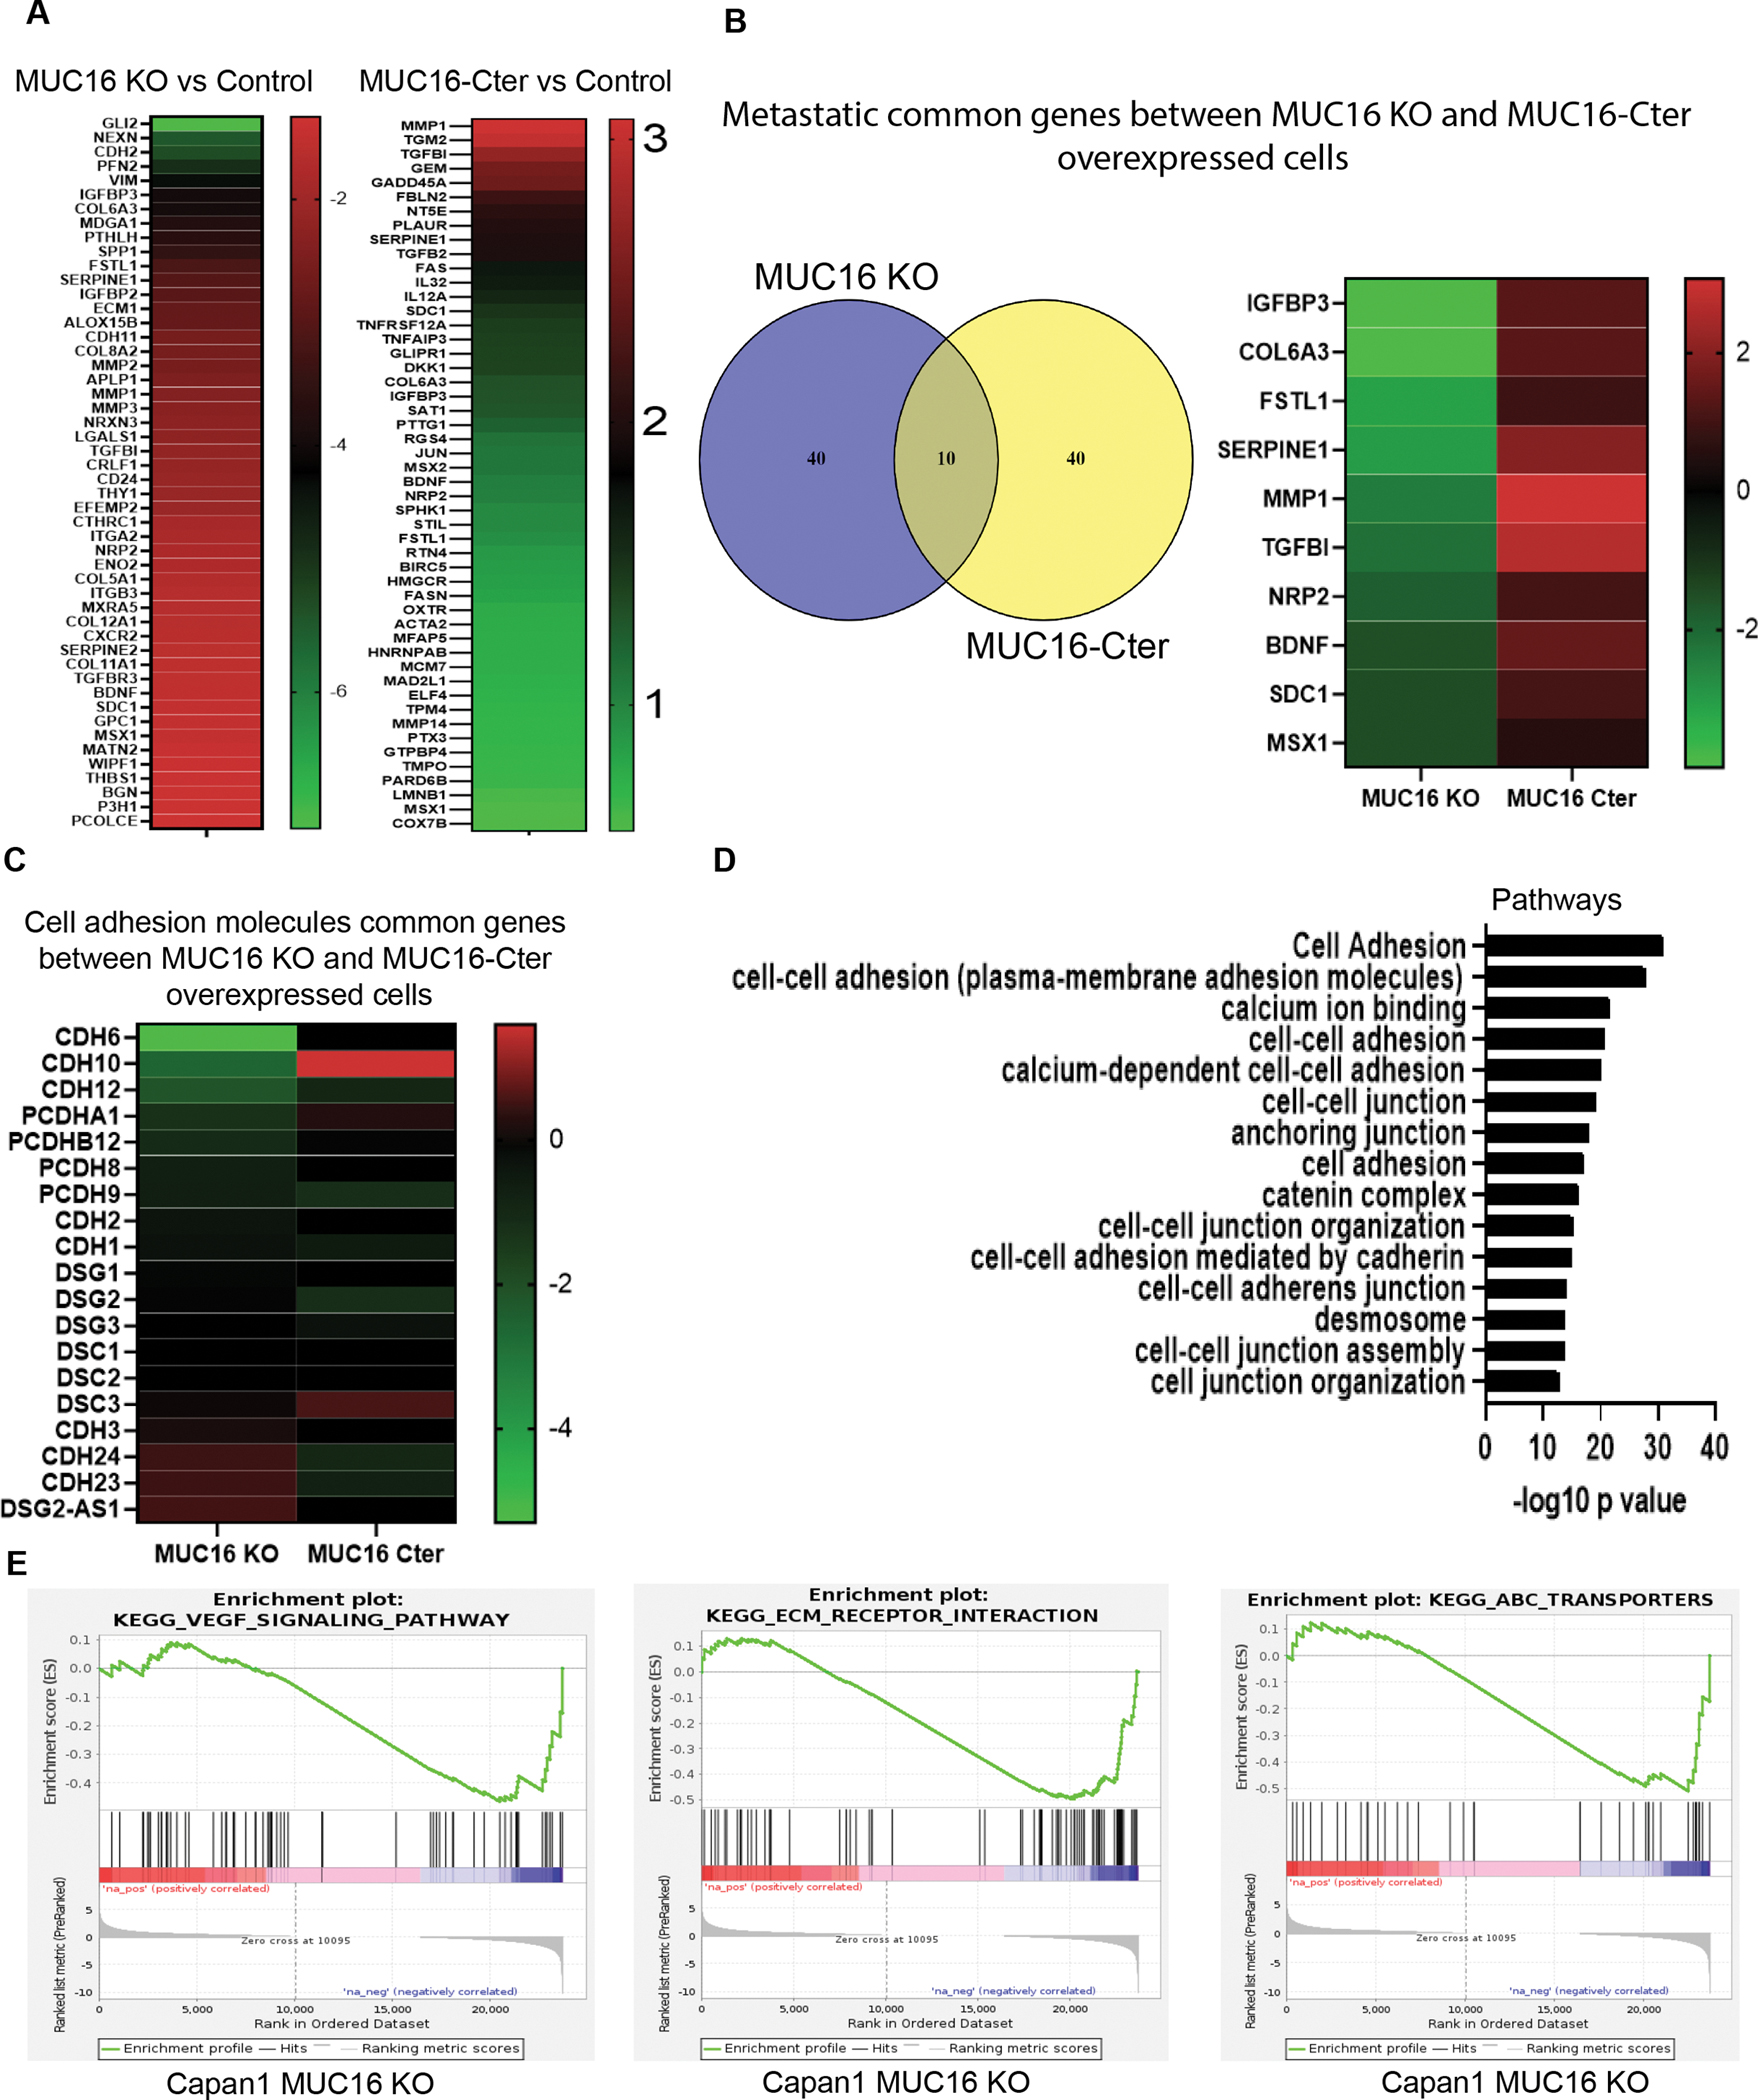
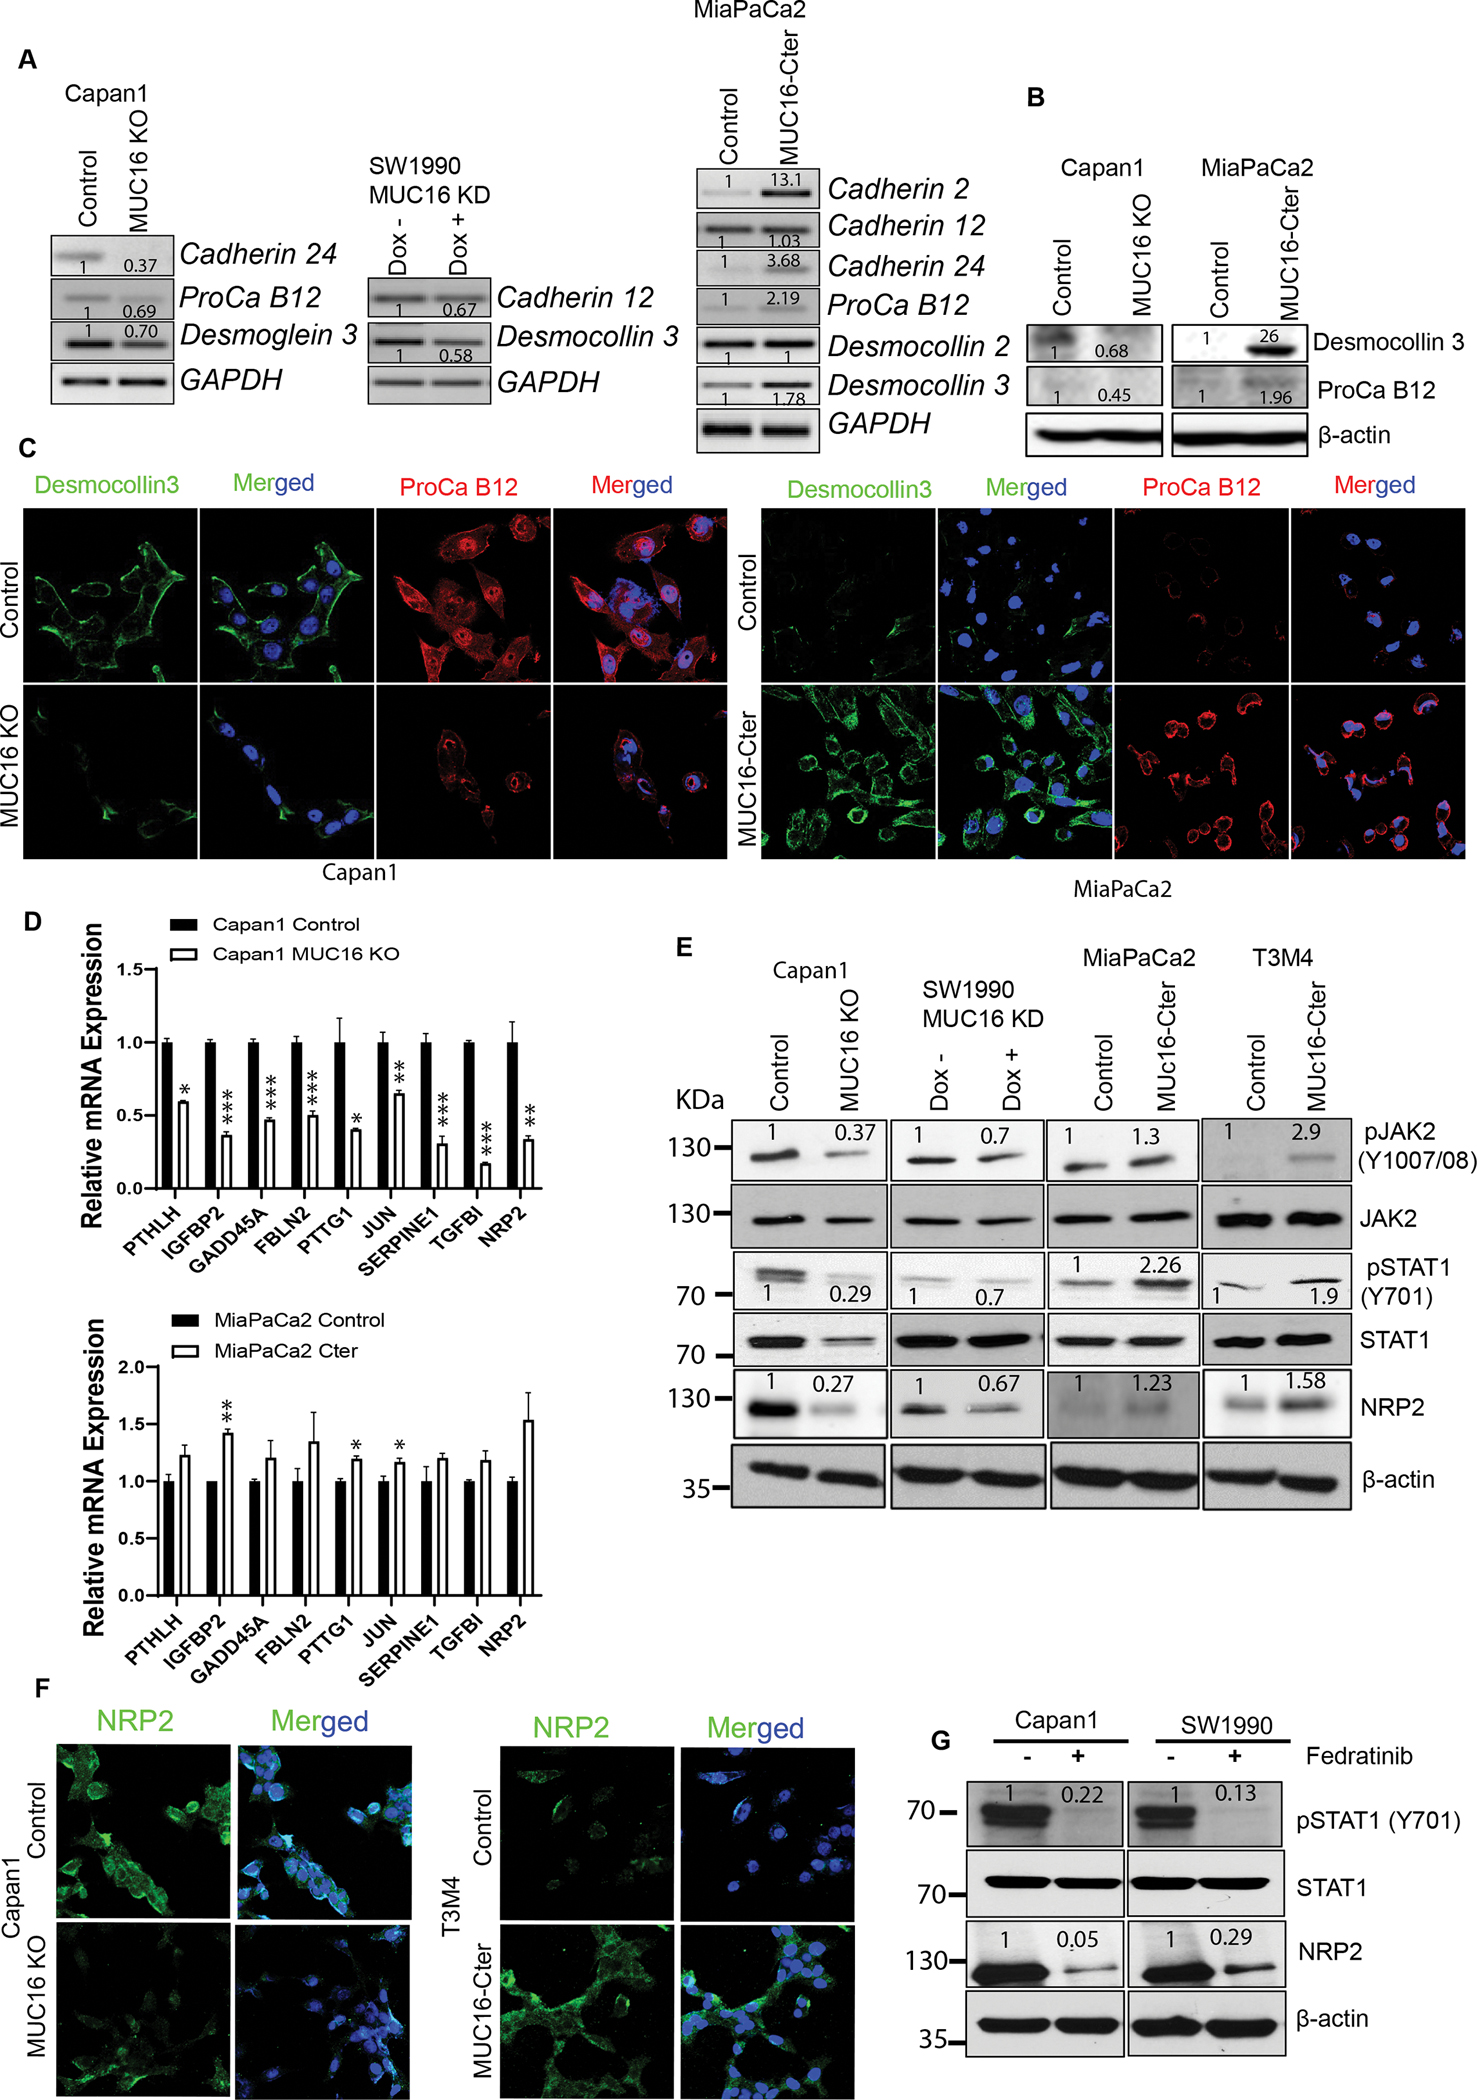
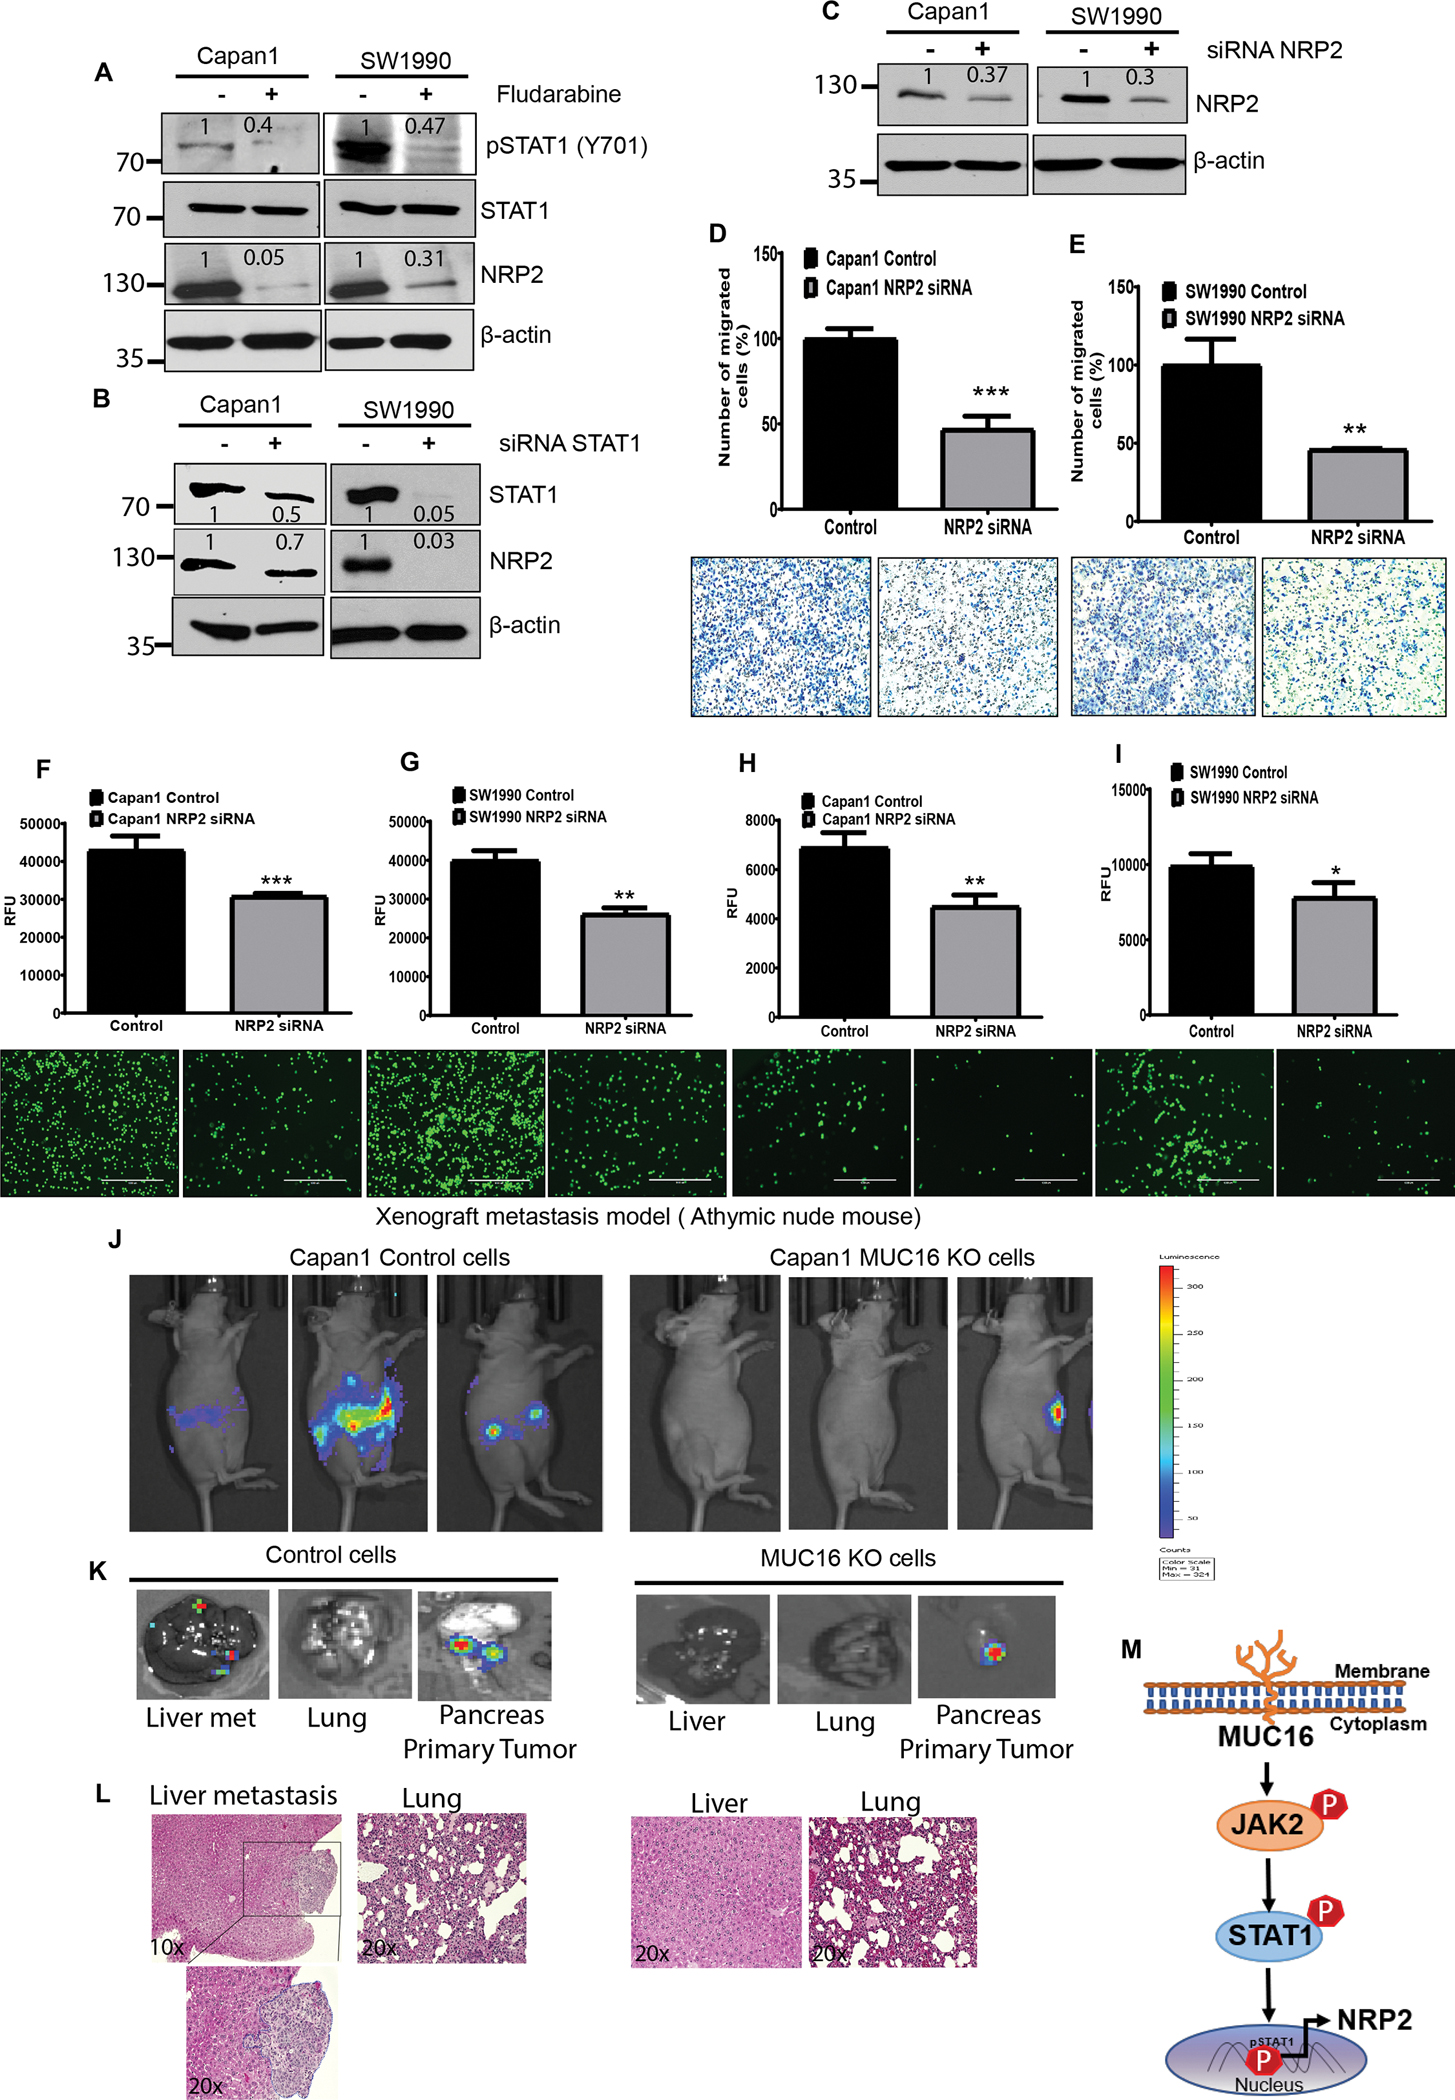
Pancreatic ductal adenocarcinoma (PDAC) is one of the most lethal types of cancer, as it commonly metastasizes to the liver resulting in an overall poor prognosis. However, the molecular mechanism involved in liver metastasis remains poorly understood. Here, we aimed to identify the MUC16-mediated molecular mechanism of PDAC-liver metastasis. Previous studies demonstrated that MUC16 and its C-terminal (Cter) domain are involved in the aggressiveness of PDAC. In this study, we observed MUC16 and its Cter expression significantly high in human PDAC tissues, PDAC organoids, and metastatic liver tissues, while no expression was observed in normal pancreatic tissues using IHC and immunofluorescence (IFC) analyses. MUC16 knockdown in SW1990 and CD18/HPAF PDAC cells significantly decreased the colony formation, migration, and endothelial/p-selectin binding. In contrast, MUC16-Cter ectopic overexpression showed significantly increased colony formation and motility in MiaPaCa2 pancreatic cancer cells. Interestingly, MUC16 promoted cell survival and colonization in the liver, mimicking an ex vivo environment. Furthermore, MUC16 enhanced liver metastasis in the in vivo mouse model. Our integrated analyses of RNA-sequencing suggested that MUC16 alters Neuropilin-2 (NRP2) and cell adhesion molecules in pancreatic cancer cells. Furthermore, we identified that MUC16 regulated NRP2 via JAK2/STAT1 signaling in PDAC. NRP2 knockdown in MUC16-overexpressed PDAC cells showed significantly decreased cell adhesion and migration. Overall, the findings indicate that MUC16 regulates NRP2 and induces metastasis in PDAC.

Implications: This study shows that MUC16 plays a critical role in PDAC liver metastasis by mediating NRP2 regulation by JAK2/STAT1 axis, thereby paving the way for future therapy efforts for metastatic PDAC.


Conflict of interest statement

Conflict of interest: SKB and MAH are the co-founders of Sanguine Diagnostics and Therapeutics, Inc. The other authors declare no potential conflicts of interest.

Figures

Figure 1
Figure 1. Immunohistochemical staining of MUC16 and MUC16-Cter in human pancreatic cancer primary tumor, liver metastasis samples, and patient-derived PDAC organoids.
A) Analysis of MUC16 expression profiles from the GEO database (GSE71729) in human PDAC primary tumor (n=145) liver metastasis (n = 25) and lung metastasis (n = 7). Data are mean ± SD. B) Immunohistochemically stained MUC16 and MUC16-Cter expression in human PDAC primary Whipple tumor tissues. C) Immunohistochemically stained MUC16 and MUC16-Cter expression in human PC liver-metastasis and lung-metastasis tissue microarrays (TMAs). D, E). The bar graph demonstrates the H-score of immunostaining of MUC16 and MUC16-Cter (scale bar, 100 μm). F, G) Immunofluorescence staining of CK19 (red) marker of ductal adenocarcinomas and MUC16 (green) and MUC16-Cter (green) in human PDAC derived organoid (n = 8) and normal tissues (n = 5) (scale bar, 20 μm).
Figure 2
Figure 2. MUC16 silencing decreases the in vitro tumorigenic, migratory potential, and endothelial/p-selectin binding in PC.
A, B, C) MUC16 expression was determined in MUC16 silenced PC cells (Capan1 CRISPR/Cas9 based KO, SW1990 MUC16 KD and CD18/HPAF MUC16 KD cells) by immunoblot. D) MUC16-Cter expression in MUC16-Cter overexpressed MiaPaCa2 and T3M4 cells by immunoblot. E, F) In vitro tumorigenic capability significantly decreased in MUC16 knockout Capan1 cells and doxycycline-inducible SW1990 MUC16 KD cells with their respective control cells. G) MUC16-Cter overexpressed cells show significantly increased tumorigenic capability in MiaPaCa2 MUC16-Cter cells compared to the control cells. Data represent ± standard deviation (p values are calculated by ‘ ‘Student’s t-test (***p<0.001, **p<0.01) (n=3). H, I) Migratory potential significantly reduced in Capan1 MUC16 KO, SW1990 MUC16 KD cells and their respective control cells. J) MiaPaCa2 MUC16-Cter cells show significantly increased migratory potential compared to the control cells. Data represent ± standard deviation (p values are calculated by ‘ ‘Student’s t-test (***p<0.001, **p<0.01) (n=3). K, L, M) Tumor cell - endothelial (HMEC1) binding study show Capan1 MUC16 KO and SW1990 MUC16 KD cells significantly decrease endothelial binding compared to the MUC16 expressing cells. N, O, P) Human p-selectin/CD62P immunoassay shows Capan1 MUC16 KO and SW1990 MUC16 KD cells significantly decreased compared to the control cells. Scale bar, 100 μm. Data represents ± standard deviation (p values are calculated by Student’s t-test (***p<0.001, **p<0.01) (n=3).
Figure 3
Figure 3. MUC16 promotes cell survival and colonization potential in vitro liver metastasis model.
A) Schematic illustration showing the strategy of in vitro liver metastatic model. For the liver-metastasis model, inducible MUC16 shRNA expressing PC (SW1990) cells were mixed with Fa2N4, LX-2, HUVEC cells, and human decellularized liver scaffold was mixed and grown in ultra-low attachment 96 well plates in DMEM-F12 with supplements. B, C) SW1990 MUC16 KD GFP+ 3D culture was treated with or without doxycycline, and the green, the fluorescent image was captured at different times (2 to 10 days). Representative GFP images were generated from automated live-cell imaging, a bright field microscope, and an immunofluorescence image of 3D culture. D) SW1990 MUC16 KD GFP+ cells grown in in vitro settings impersonating liver metastasis model. The growth curve is generated based on the green fluorescent protein expression in 3D culture. E) MUC16 expressing pancreatic cancer SW1990 cells clonogenic anchorage-independent cell growth curve. F, G) Light microscopy images of the sphere and corresponding green fluorescence images and GFP images from Incucyte were taken at different time points (2 to 12 days).
Figure 4
Figure 4. Identifying the cell adhesion and metastatic genes expression in MUC16 Knockout and MUC16-Cter overexpressed cells from global RNA-seq
A) Heat map shows the top 50 genes altered in MUC16 KO and MUC16-Cter overexpressed cells from our RNA-seq data. B) Venn diagram shows the common 10 genes identified between MUC16 KO and MUC16 overexpressed cells. The heat map shows commonly altered genes (IGFBP2, COL6A3, FSTL1, SERPINE1, MMP1, TGFBI, NRP2, BDNF, SDC1, and MSX1). C) Heat map shows top 19 altered common genes associated with cell adhesion molecules. D) Pathway enrichment analysis from MUC16 KO cells shows cell adhesion and cell-cell junction-associated pathways. Based on – log10 p-value. E) VEGF, ECM, and ABC pathway enrichment plots generated from MUC16 KO Capan1 PC cells.
Figure 5
Figure 5. MUC16 regulation of cell adhesion-promoting molecules and metastatic gene NRP2 regulation through activation of JAK2/STAT1 axis
A) PCR analysis shows mRNA expression of cell adhesion molecules in Capan1 MUC16 KO, SW1990 MUC16 KD, and MUC16-Cter overexpressed MiaPaCa2 cells with control cells. GAPDH was used as a loading control. B, C) Immunoblot and immunofluorescent staining of cell adhesion molecules, Desmocollin 3 (green) and Protocadherin B12 (red) expression in MUC16 KO and MUC16-Cter overexpressed PC cells with respective control cells. Immunofluorescence images were taken under the confocal microscope; scale bar, 50 μm. D) QRT-PCR validation of 10 common genes in Capan1 MUC16 KO and MiaPaCa2 MUC16-Cter overexpressed cells. Data represent ± standard deviation (Student’s t-test calculates p values (***p<0.001, **p<0.01, *p<0.05) (n=3). E) Immunoblot analysis shows the phospho-JAK2 (Y1007/1008), total JAK2, phospho-STAT1 (Y701), total STAT1 and NRP2 expression in Capan1 MUC16 KO, SW1990 MUC16 KD, MiaPaCa2 MUC16-Cter, and T3M4 MUC16-Cter overexpressed cells. β-actin was used as a loading control. F) Immunofluorescence analysis was performed to show the NRP2 expression in MUC16 KO and MUC16-Cter overexpressed PC cells. Images were obtained from a confocal microscope; scale bar, 50 μm. G) Effect of silencing the JAK2 activation using JAK2 inhibitor (Fedratinib) in Capan1 and SW1990 cells. Immunoblot analysis shows the phospho-STAT1 (Y701), total STAT1, and NRP2 expression in Capan1 and SW1990 cells. β-actin was used as a loading control. Western blots were quantified by densitometric analysis.
Figure 6
Figure 6. Loss of NRP2 decreases the endothelial, p-selectin binding, and migratory potential in PC cells
A, B) STAT1 inhibitor (Fludarabine) or Small interfering RNA (siRNA) silencing of STAT1 in Capan1 and SW1990 cells. Immunoblot analysis shows the effect of STAT1 silencing on NRP2 expression. β-actin was used as a loading control. C) NRP2 knockdown determined in NRP2 siRNA expressed in PC (Capan1 and SW1990) cells by western blot. D, E) Migratory potential decreased in NRP2 silenced in Capan1 and SW1990 cells compared to control cells. Data represent ± standard deviation (p values are calculated by ‘ ‘Student’s t-test (***p<0.001, **p<0.01) (n=3). F-I) Effect of NRP2 silencing in Capan1 and SW1990 cells show significantly decreased endothelial and p-selectin binding compared to the control cells. Representative images were taken under the fluorescence microscope Scale bar, 100 μm. Data represent ± SD (p values are calculated by S’ ‘Student’ ‘s t-test (***p<0.001, **p<0.01, *p<0.05) (n=3). MUC16 expression increases metastasis in the hemi-spleen mouse model. J) In vivo tumor growth and metastasis were imaged using an IVIS imaging system after intraperitoneal injection (IP) of D-luciferin at 21 days in Athymic nude mice. K) Representative IVIS image of PADC liver metastasis, lung and injected site of the pancreas tumor. L) Representative eosin staining of control and MUC16 KO cells injected hemi-spleen in athymic nude mice shown PDAC liver metastasis. M) Schematic representation demonstrates that MUC16 activates oncogenic signaling through pJAK2 (Y1007/1008) and pSTAT1 (Y701). Phosphorylation and nuclear localization of STAT1 lead to the upregulation of NRP2 and promotes PC metastasis. Besides, MUC16 correspondingly promotes cell adhesion molecules during PC liver metastasis. Western blots were quantified by densitometric analysis.

Similar articles

Cited by

References

    1. Puckett Y, Garfield K. Pancreatic Cancer. StatPearls. Treasure Island (FL): StatPearls Publishing.Copyright © 2021, StatPearls Publishing LLC.; 2021.
    1. Borazanci E, Sckolnik S, Amini A. Neo-adjuvant therapy for pancreatic cancer: hope for the future. Expert Rev Gastroenterol Hepatol 2019;13(6):579–89 doi 10.1080/17474124.2019.1607294. - DOI - PubMed
    1. Wang X, Hu LP, Qin WT, Yang Q, Chen DY, Li Q, et al. Identification of a subset of immunosuppressive P2RX1-negative neutrophils in pancreatic cancer liver metastasis. Nat Commun 2021;12(1):174 doi 10.1038/s41467-020-20447-y. - DOI - PMC - PubMed
    1. Young ED, Manley SJ, Beadnell TC, Shearin AE, Sasaki K, Zimmerman R, et al. Suppression of pancreatic cancer liver metastasis by secretion-deficient ITIH5. Br J Cancer 2021;124(1):166–75 doi 10.1038/s41416-020-01093-z. - DOI - PMC - PubMed
    1. Haridas D, Ponnusamy MP, Chugh S, Lakshmanan I, Seshacharyulu P, Batra SK. MUC16: molecular analysis and its functional implications in benign and malignant conditions. Faseb j 2014;28(10):4183–99 doi 10.1096/fj.14-257352. - DOI - PubMed

Publication types