. 2022 May 17;119(20):e2117440119.
doi: 10.1073/pnas.2117440119. Epub 2022 May 9.

Global collision-risk hotspots of marine traffic and the world's largest fish, the whale shark

Freya C Womersley  1   2 Nicolas E Humphries  1 Nuno Queiroz  1   3 Marisa Vedor  3 Ivo da Costa  3 Miguel Furtado  3 John P Tyminski  4 Katya Abrantes  5   6   7 Gonzalo Araujo  8   9 Steffen S Bach  10 Adam Barnett  5   6   7 Michael L Berumen  11 Sandra Bessudo Lion  12 Camrin D Braun  13   14 Elizabeth Clingham  15 Jesse E M Cochran  11 Rafael de la Parra  16 Stella Diamant  17 Alistair D M Dove  18 Christine L Dudgeon  19 Mark V Erdmann  20 Eduardo Espinoza  21   22 Richard Fitzpatrick  5   6 Jaime González Cano  23 Jonathan R Green  24 Hector M Guzman  25 Royale Hardenstine  11 Abdi Hasan  26 Fábio H V Hazin  27 Alex R Hearn  22   28 Robert E Hueter  4   29 Mohammed Y Jaidah  30 Jessica Labaja  8 Felipe Ladino  12 Bruno C L Macena  27   31 John J Morris Jr  4 Bradley M Norman  32   33 Cesar Peñaherrera-Palma  22 Simon J Pierce  34 Lina M Quintero  12 Dení Ramírez-Macías  35 Samantha D Reynolds  33   36 Anthony J Richardson  37   38 David P Robinson  39 Christoph A Rohner  34 David R L Rowat  40 Marcus Sheaves  5   7 Mahmood S Shivji  41 Abraham B Sianipar  42 Gregory B Skomal  43 German Soler  12 Ismail Syakurachman  42 Simon R Thorrold  14 D Harry Webb  18 Bradley M Wetherbee  41   44 Timothy D White  45 Tyler Clavelle  45 David A Kroodsma  45 Michele Thums  46 Luciana C Ferreira  46 Mark G Meekan  46 Lucy M Arrowsmith  47 Emily K Lester  47 Megan M Meyers  47 Lauren R Peel  48 Ana M M Sequeira  48 Victor M Eguíluz  49 Carlos M Duarte  11 David W Sims  1   2   50
Affiliations

Global collision-risk hotspots of marine traffic and the world's largest fish, the whale shark

Freya C Womersley et al. Proc Natl Acad Sci U S A. .

Abstract

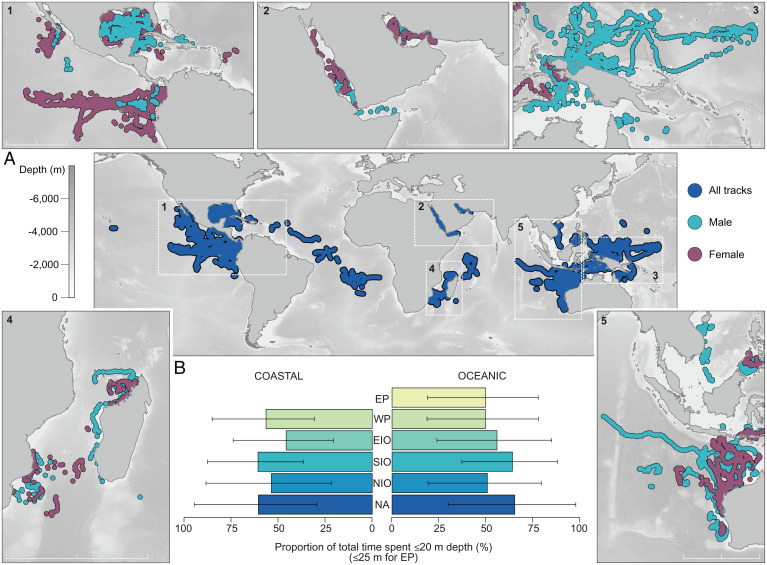
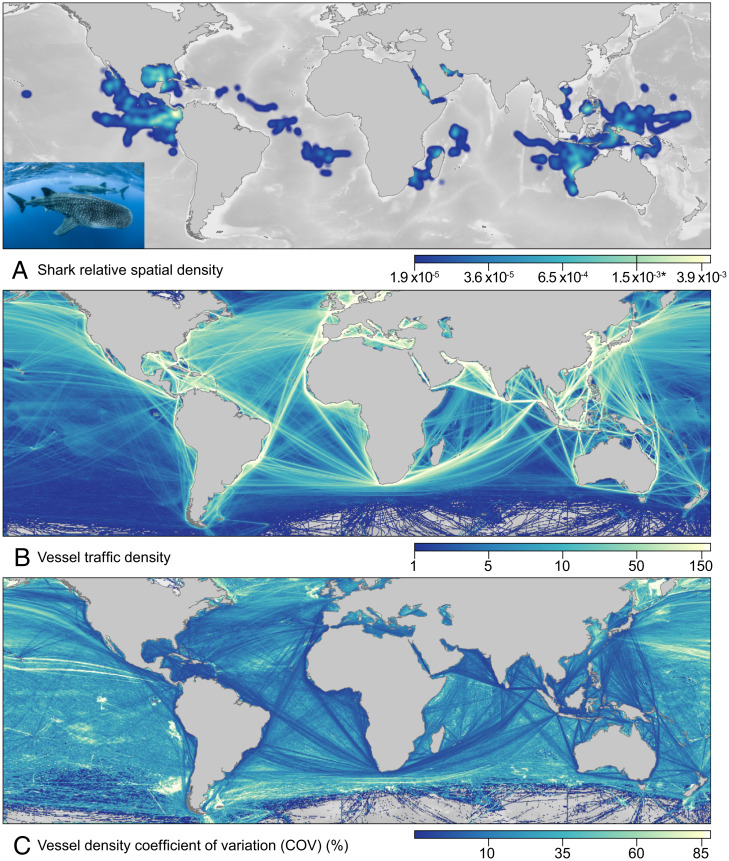
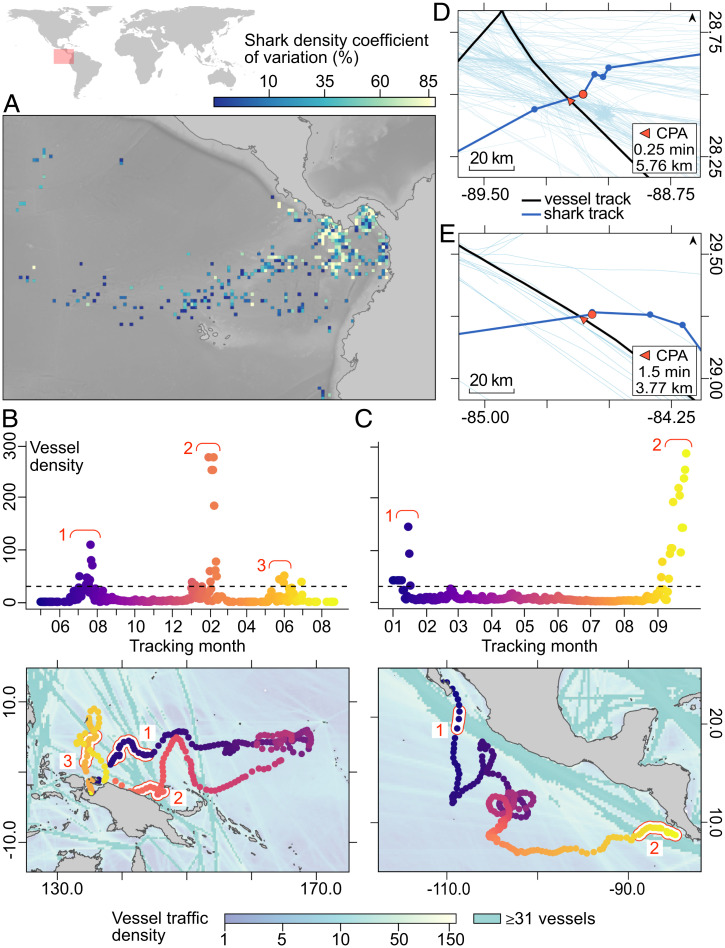
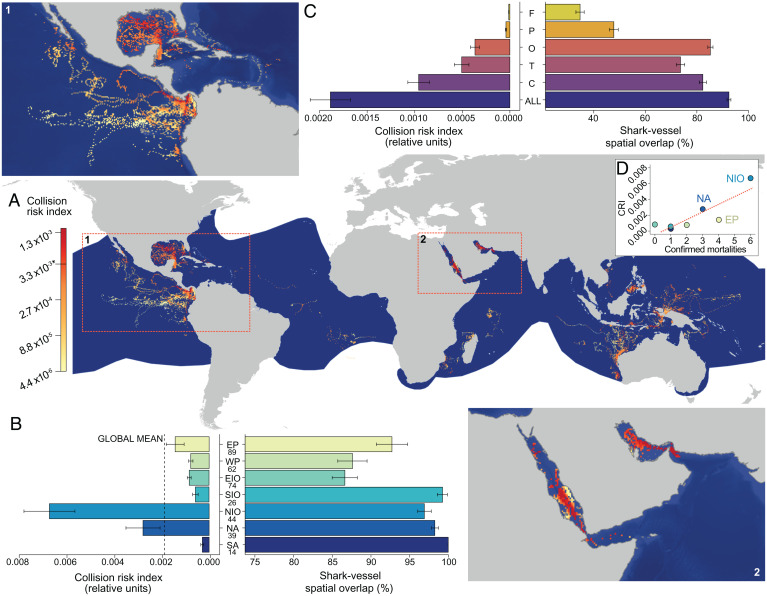
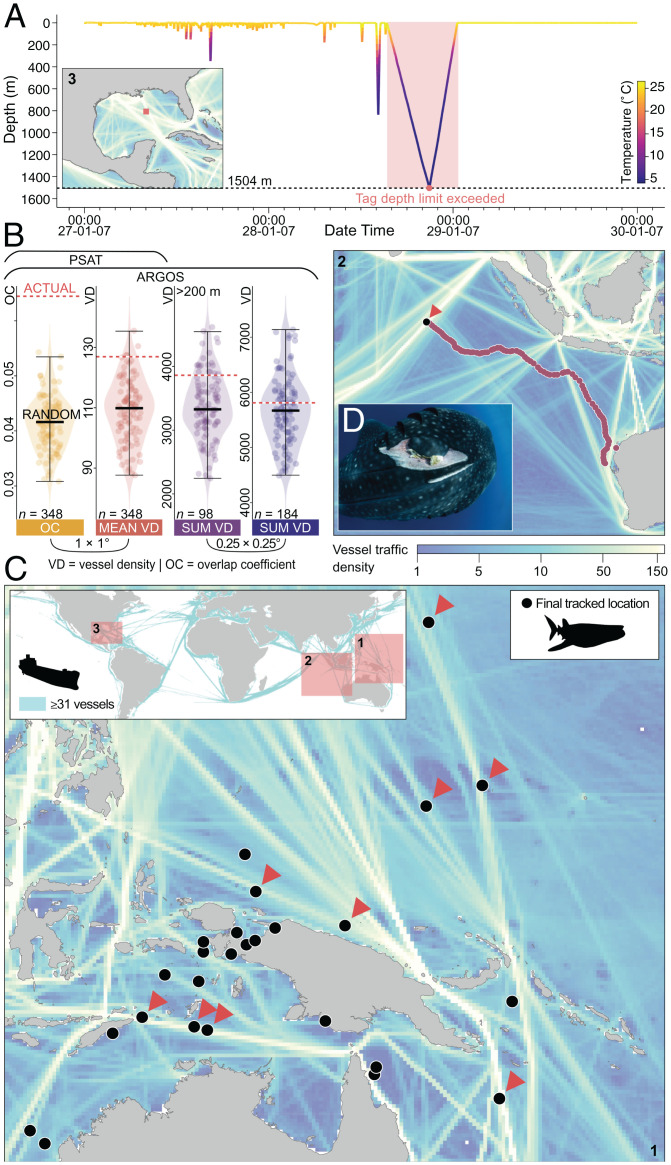
Marine traffic is increasing globally yet collisions with endangered megafauna such as whales, sea turtles, and planktivorous sharks go largely undetected or unreported. Collisions leading to mortality can have population-level consequences for endangered species. Hence, identifying simultaneous space use of megafauna and shipping throughout ranges may reveal as-yet-unknown spatial targets requiring conservation. However, global studies tracking megafauna and shipping occurrences are lacking. Here we combine satellite-tracked movements of the whale shark, Rhincodon typus, and vessel activity to show that 92% of sharks’ horizontal space use and nearly 50% of vertical space use overlap with persistent large vessel (>300 gross tons) traffic. Collision-risk estimates correlated with reported whale shark mortality from ship strikes, indicating higher mortality in areas with greatest overlap. Hotspots of potential collision risk were evident in all major oceans, predominantly from overlap with cargo and tanker vessels, and were concentrated in gulf regions, where dense traffic co-occurred with seasonal shark movements. Nearly a third of whale shark hotspots overlapped with the highest collision-risk areas, with the last known locations of tracked sharks coinciding with busier shipping routes more often than expected. Depth-recording tags provided evidence for sinking, likely dead, whale sharks, suggesting substantial “cryptic” lethal ship strikes are possible, which could explain why whale shark population declines continue despite international protection and low fishing-induced mortality. Mitigation measures to reduce ship-strike risk should be considered to conserve this species and other ocean giants that are likely experiencing similar impacts from growing global vessel traffic.

Keywords: conservation; human impact; marine megafauna; movement ecology; ship strike.


Conflict of interest statement

The authors declare no competing interest.

Figures

Fig. 1.
Fig. 1.
Global whale shark horizontal and vertical movements. (A) Estimated whale shark positions for 348 individual tracks obtained via satellite transmitters deployed from 2005 to 2019 with sex differences given in the panels. (B) Mean proportion of total time (percent) spent shallower than 20-m depth (collision-risk zone) (shallower than 25-m depth for the east Pacific region) in each region from depth-sensitive tag records associated with coastal (≤200-m depth) and oceanic (>200-m depth) habitats. Error bars denote ± one SD of the mean. EP, east Pacific; WP, west Pacific; EIO, east Indian Ocean; SIO, southwest Indian Ocean; NIO, northwest Indian Ocean; NA, north Atlantic; SA, south Atlantic. (Scale bars: 1,000 km.)
Fig. 2.
Fig. 2.
Spatial distribution of whale sharks and global vessel movements. (A) Relative density of whale sharks. Kernel distribution of the mean monthly sum of weighted and normalized location estimates of tracked whale sharks within each 0.25° × 0.25° resolution cell (hotspots of occupancy were defined as ≥90th percentile of mean relative density with a 2.5° radius applied). Lighter colors reflect higher densities of sharks. (Inset) Image of multiple whale sharks; credit: S.J.P. (B) Vessel traffic density (total count of vessels within 0.25° × 0.25° resolution cells). Mean annual total number of AIS-tracked vessels averaged for the years 2011 to 2014 (see Methods). Lighter colors reflect higher densities of vessels. (C) Coefficient of variation (percent) for vessel traffic density displaying annual variation at a 0.25° × 0.25° cell resolution scale. Darker colors denote lower variation.
Fig. 3.
Fig. 3.
Individual whale shark movements. (A) Coefficient of variation (percent) for shark density displaying annual variation at a 0.25° × 0.25° cell resolution within an example area of the east Pacific region. Darker colors denote lower variation. (B and C) Individual shark movements around busy vessel routes. Examples of two whale sharks that moved out from and back to known aggregation areas compared to the number of vessels encountered at each tracked location (y axis, 2011 to 2014 annual mean) through time. Locations where individuals move through cells with busy traffic (defined as the top 90th percentile of vessel counts within a cell; 31 for the 2011 to 2014 annual mean, displayed as black dotted line in upper panels) are highlighted and numbered when (Upper) and where (Lower) the sharks pass through these areas during tracked movements. Cells with vessel counts representing busy routes have been colored uniformly in maps to aid interpretation. (D and E) Fine-scale shark–vessel interactions. Examples of simultaneous vessel and whale shark tracking in the Gulf of Mexico in the year 2018 displaying the closest point of approach (CPA) time difference and distance from two close encounters within the dataset.
Fig. 4.
Fig. 4.
Spatial distribution of overlap and risk. (A) Map showing distribution of the mean monthly overlap and CRI that whale sharks were exposed to in overlapping areas within each 0.25° × 0.25° resolution cell. Hotspots of collision risk were defined as cells with ≥90th percentile of mean relative CRI. Red cells represent higher relative CRI than yellow cells. The current whale shark distribution taken from the IUCN is shown as the dark blue shaded area. (B) Mean monthly CRI (Left) and overlap (Right) experienced by individuals within each region (error bars denote ± one SEM) with global mean displayed as dotted line. EP, east Pacific; WP, west Pacific; EIO, east Indian Ocean; SIO, southwest Indian Ocean; NIO, northwest Indian Ocean; NA, north Atlantic; SA, south Atlantic. Number below each region abbreviation is the number of shark tracks for that region. (C) Mean monthly CRI (Left) and overlap (Right) experienced by individuals from a range of vessel types (error bars denote ± SE). F, fishing; P, passenger; O, other; T, tanker; C, cargo. (D) Mean monthly CRI correlated with total number of confirmed large-vessel-related mortalities recorded from each region (SI Appendix, Table S8). Dotted line shows best fit from linear regression.
Fig. 5.
Fig. 5.
Final tracked locations in relation to vessel traffic. (A) Time series depth profile of an individual shark showing depth use toward the end of the tracking period. Normal diving behavior was apparent before the red highlighted segment where an unusually slow descent (4.46 m⋅min−1 ± 0.89 SD) occurred until a depth of 1,504 m (black dotted line), when the tag was released and floated to the surface. This type of observation occurs as a result of an individual dying and slowly sinking. (Inset) Tag pop-off location within a heavily trafficked area in the central Gulf of Mexico where the average density within the 1° × 1° cell where the track ended was 97.42 vessels per ∼784 km2 (2011 to 2014 annual mean). (B) Differences between the actual final locations and randomized runs of final locations (n = 100) for the overlap coefficient (Far Left; OC, P < 0.001, 95% CI: [0.041, 0.042]) and mean vessel density (Center; VD, P < 0.001, 95% CI: [107.16, 111.25]) for all tracks (n = 348) at the 1° × 1° cell resolution scale. (Far Right) The sum of VD within cells for all ARGOS locations (n = 184, P < 0.05, 95% CI: [5,548.89, 5,792.73]). (Center Right) The oceanic ARGOS locations only (>200-m depth; n = 98, P < 0.001, 95% CI: [3,292.11, 3,523.76]) at the 0.25° × 0.25° cell resolution scale. Violin plots and points show spread of the randomized data (n = 100), thick lines show the median of randomized runs, and the dotted red line shows the actual final location values. Points have been spread for ease of interpretation. (C) Global binary map of busy shipping routes (defined as the 90th percentile of vessel density within a cell; 31 for the 2011 to 2014 annual mean). Highlighted regions show (1) fine-scale examples of final tracked locations and vessel traffic density (2011 to 2014 annual mean) in the west Pacific region, where red arrows highlight examples of final locations overlapping with or close to busy shipping routes and (2) an example of an individual whale shark in the east Indian Ocean region where it travels offshore from the tagging site at Ningaloo, Australia (tracking duration, 92 d; distance traveled, 4,971.78 km) and ceases transmission while in a busy shipping route (vessel density, 375.25). (D) Example of a collision outcome in the form of a major-vessel-related injury on the dorsal surface of a whale shark; credit: S.J.P.

References

    1. United Nations Conference on Trade and Development (UNCTAD), Review of maritime transport 2020 (2020). https://unctad.org/system/files/official-document/rmt2020_en.pdf. Accessed 25 January 2022.
    1. United Nations Conference on Trade and Development (UNCTAD), Review of maritime transport 1995 (1995). https://unctad.org/system/files/official-document/rmt1995_en.pdf. Accessed 25 January 2022.
    1. Sequeira A. M. M., et al. , Overhauling ocean spatial planning to improve marine megafauna conservation. Front. Mar. Sci. 6, 639 (2019).
    1. Schoeman R. P., Patterson-Abrolat C., Plön S., A global review of vessel collisions with marine animals. Front. Mar. Sci. 7, 292 (2020).
    1. Queiroz N., et al. , Global spatial risk assessment of sharks under the footprint of fisheries. Nature 572, 461–466 (2019). - PubMed

Publication types

LinkOut - more resources