. 2022 Aug 15:210:114299.
doi: 10.1016/j.bios.2022.114299. Epub 2022 Apr 26.

Assessment of fibrinolytic status in whole blood using a dielectric coagulometry microsensor

Affiliations

Assessment of fibrinolytic status in whole blood using a dielectric coagulometry microsensor

Sina Pourang et al. Biosens Bioelectron. .

Abstract

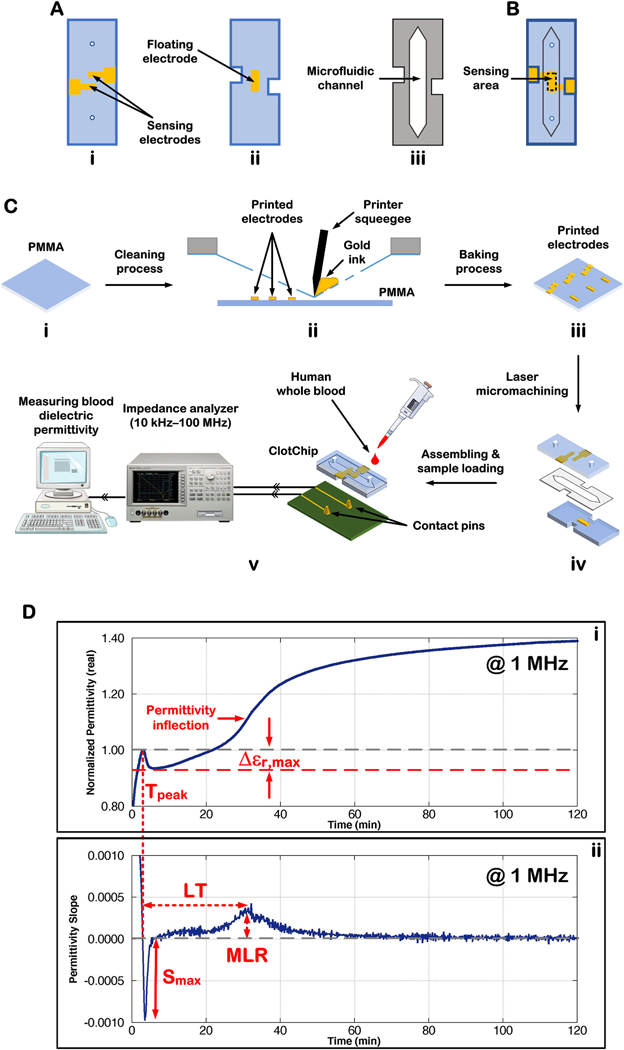
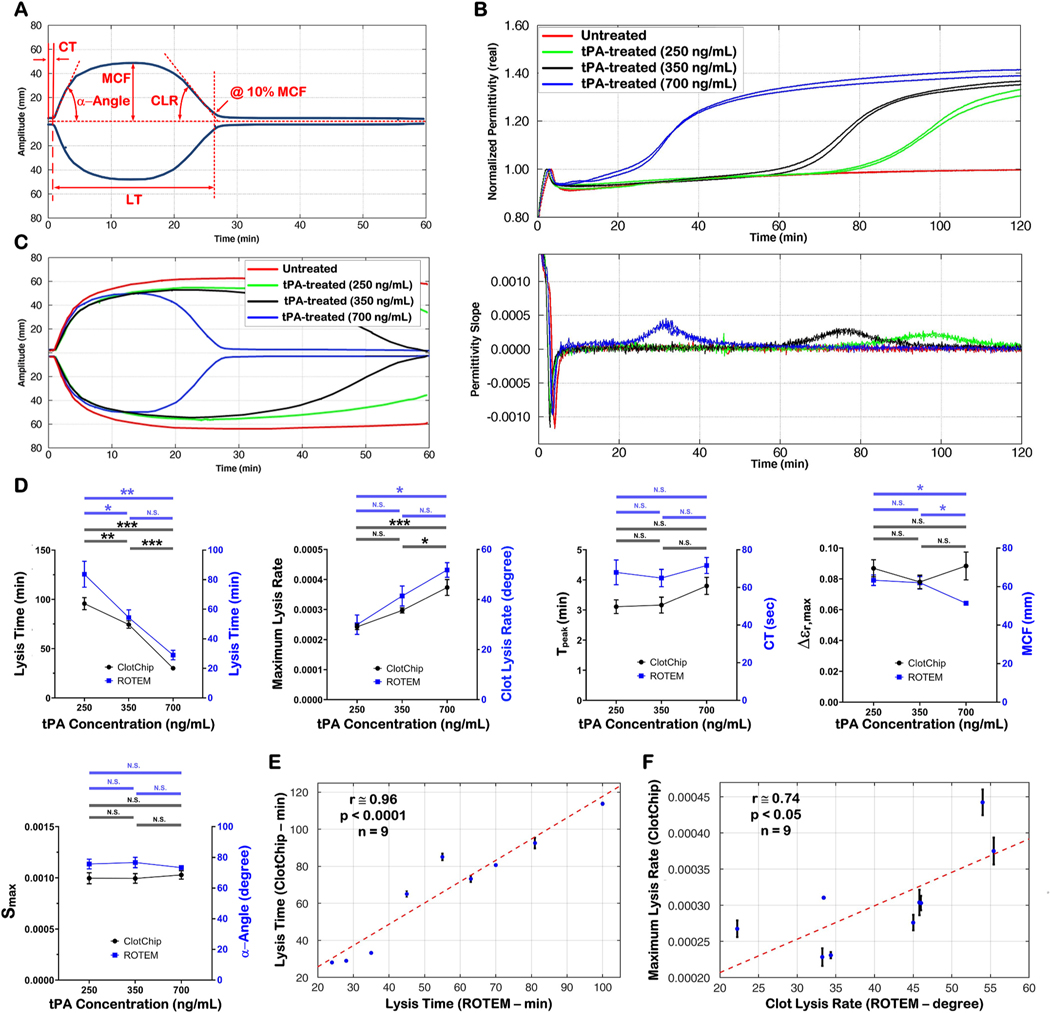
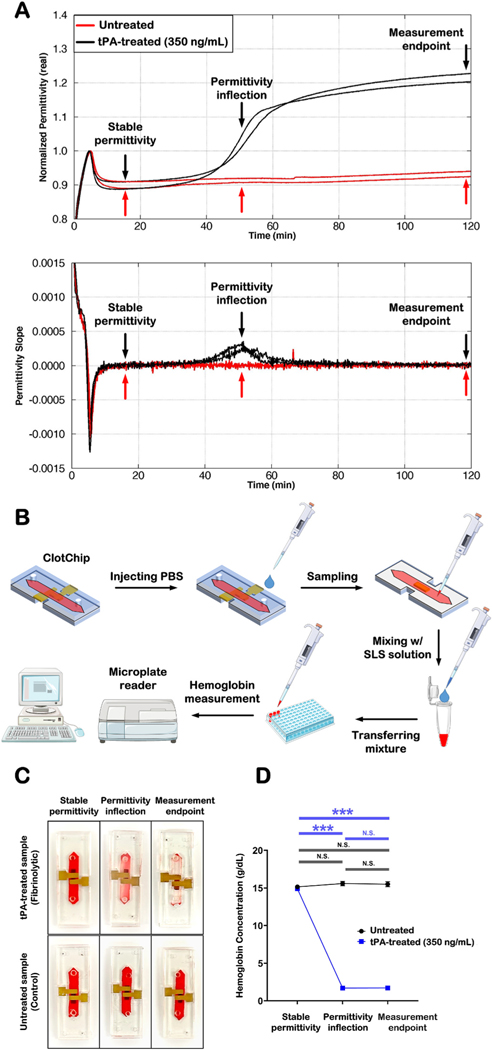
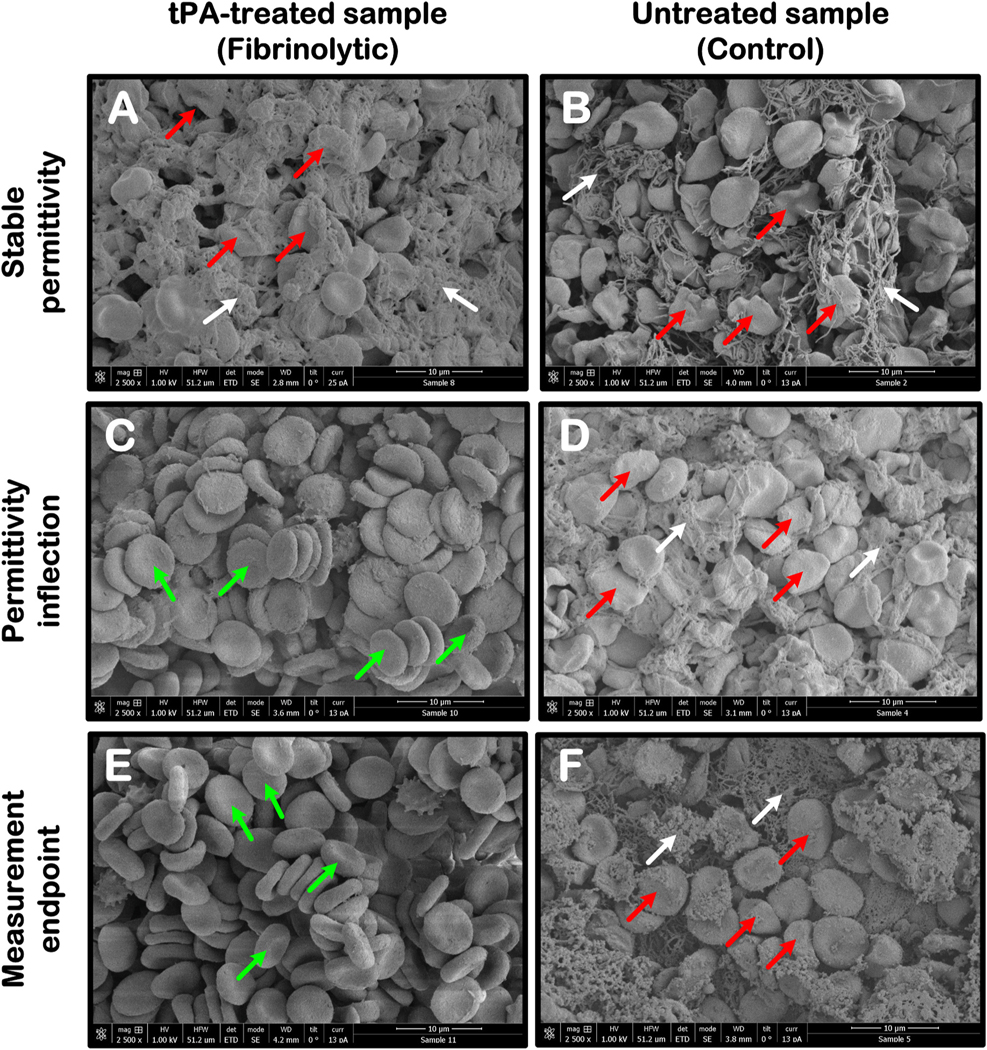
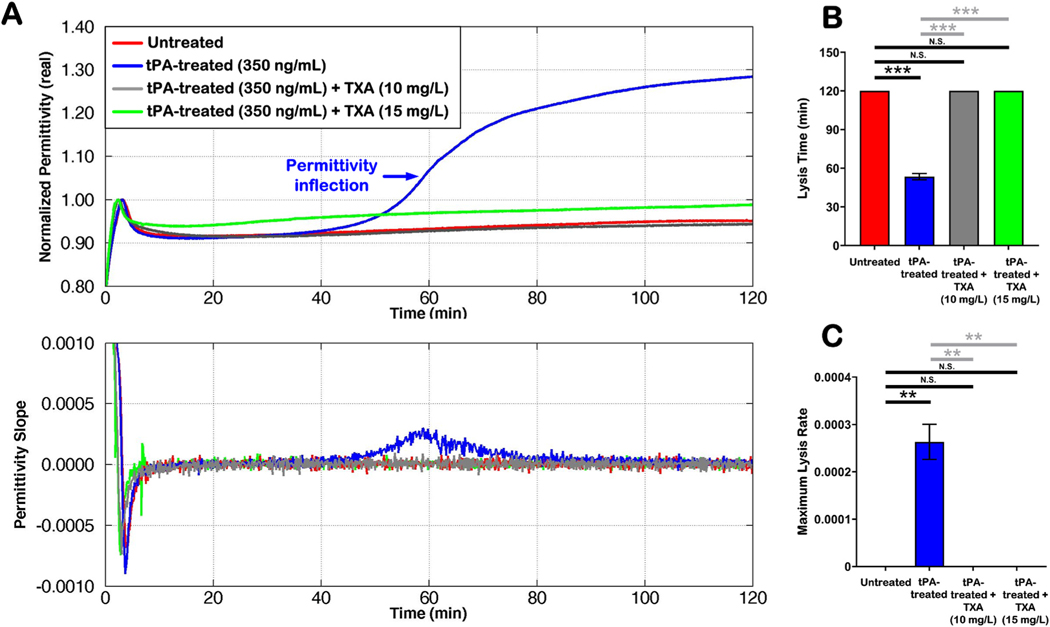
Rapid assessment of the fibrinolytic status in whole blood at the point-of-care/point-of-injury (POC/POI) is clinically important to guide timely management of uncontrolled bleeding in patients suffering from hyperfibrinolysis after a traumatic injury. In this work, we present a three-dimensional, parallel-plate, capacitive sensor - termed ClotChip - that measures the temporal variation in the real part of blood dielectric permittivity at 1 MHz as the sample undergoes coagulation within a microfluidic channel with <10 μL of total volume. The ClotChip sensor features two distinct readout parameters, namely, lysis time (LT) and maximum lysis rate (MLR) that are shown to be sensitive to the fibrinolytic status in whole blood. Specifically, LT identifies the time that it takes from the onset of coagulation for the fibrin clot to mostly dissolve in the blood sample during fibrinolysis, whereas MLR captures the rate of fibrin clot lysis. Our findings are validated through correlative measurements with a rotational thromboelastometry (ROTEM) assay of clot viscoelasticity, qualitative/quantitative assessments of clot stability, and scanning electron microscope imaging of clot ultrastructural changes, all in a tissue plasminogen activator (tPA)-induced fibrinolytic environment. Moreover, we demonstrate the ClotChip sensor ability to detect the hemostatic rescue that occurs when the tPA-induced upregulated fibrinolysis is inhibited by addition of tranexamic acid (TXA) - a potent antifibrinolytic drug. This work demonstrates the potential of ClotChip as a diagnostic platform for rapid POC/POI assessment of fibrinolysis-related hemostatic abnormalities in whole blood to guide therapy.

Keywords: Dielectric coagulometry; Dielectric spectroscopy; Fibrinolysis monitoring; Microfluidics; Point-of-care diagnostics; Whole blood coagulation.


Figures

Fig. 1.
Fig. 1.
ClotChip structure, fabrication, and testing. A) Illustration of the three sensor’s layers including two polymethyl methacrylate (PMMA) plastic substrates with (i) sensing and (ii) floating gold electrodes, as well as (iii) a double-sided-adhesive (DSA) film with thickness of 250 μm that was laser-micromachined to form the walls of a microfluidic channel. B) Assembled ClotChip sensor after attaching the two PMMA layers together using the DSA film. The total sample volume in the microfluidic channel was <10 μL. C) Illustration of ClotChip fabrication steps and testing procedure. (i–ii) The gold sensing and floating electrodes were screen-printed onto a single pre-cleaned PMMA plastic substrate using a thick-film printer. (iii–iv) The PMMA substrate was baked in an oven to dry the printed electrodes and then laser-micromachined (along with the DSA film) to create the individual ClotChip sensor layers as shown in A. (v) Assembled ClotChip sensor was loaded with human whole blood and interfaced with an impedance analyzer for measurements of the blood dielectric permittivity in a frequency range of 10 kHz–100 MHz. D) Example of the ClotChip readout curve and related parameters for a human whole blood sample undergoing coagulation in a tissue plasminogen activator (tPA)-induced fibrinolytic environment. (i) Tpeak and Δεr,max were derived from the normalized real part of blood dielectric permittivity at 1 MHz. (ii) Smax, lysis time (LT), and maximum lysis rate (MLR) were derived from the first derivative of the readout curve (i. e., permittivity slope).
Fig. 2.
Fig. 2.
ClotChip and rotational thromboelastometry (ROTEM) parameters in a fibrinolytic environment. A) Example of the ROTEM profile and related parameters for a human whole blood sample undergoing coagulation in a tPA-induced fibrinolytic environment. B) ClotChip readout curve and its first derivative for an untreated whole blood sample as well as samples treated with three different concentrations of tPA. All samples had tissue factor (TF) added to them at a concentration of 1 pg/mL. C) ROTEM profiles obtained for the four blood samples used in B. D) Variation of ClotChip and ROTEM parameters with different tPA concentrations. The lysis time (LT) parameter of both assays showed significant sensitivity to tPA concentrations, with the LT parameter decreasing as tPA concentrations increased. Similarly, the ClotChip maximum lysis rate (MLR) and ROTEM clot lysis rate (CLR) parameters exhibited sensitivity to tPA concentrations, with both parameters increasing as tPA concentrations increased. Error bars are presented as mean ± standard error of mean (SEM) of six ClotChip and three ROTEM measurements for each tPA concentration. E) A very strong positive correlation (r ≅ 0.96, p < 0.0001, n = 9) was observed between the LT parameters of ClotChip and ROTEM assays. F) A strong positive correlation (r ≅ 0.74, p < 0.05, n = 9) was observed between the ClotChip MLR and ROTEM CLR parameters. Error bars in E–F are presented as mean ± SEM of duplicate ClotChip measurements.
Fig. 3.
Fig. 3.
Qualitative and quantitative analyses of fibrin clot stability inside the microfluidic channel in a fibrinolytic environment. A) ClotChip readout curve and its first derivative for an untreated whole blood sample as well as a sample treated with tPA at a concentration of 350 ng/mL. The samples had TF added to them at a concentration of 1 pg/mL. To assess fibrin clot stability, three different time points were selected on the readout curve corresponding to (i) when permittivity variation after Tpeak had largely stabilized, (ii) fibrinolysis-induced permittivity inflection point on the tail end of the curve, and (iii) measurement endpoint. B) Illustration of the procedure for clot stability analysis at each of the three time points. First, 100 μL of phosphate-buffered saline (PBS) was injected into the ClotChip microfluidic channel. Next, 5 μL of the sample was collected from the microfluidic channel and mixed with sodium lauryl sulphate (SLS) solution. The mixture was then transferred to well plates for measuring the hemoglobin concentration of the mixture with a microplate reader. C) Visual observation of fibrin clots inside the ClotChip microfluidic channel at the three pre-defined time points after PBS injection. The tPA-treated (fibrinolytic) sample showed a stable clot at the first time point, with PBS unable to enter the microfluidic channel from the inlet port. By the time point of permittivity inflection, the fibrin clot had mostly dissolved and washed away after PBS injection. By the measurement endpoint, the microfluidic channel was devoid of any blood. In contrast, the untreated (control) sample maintained a stable clot throughout the 2-h duration of this experiment, with no sign of the clot dissolving and washing away after PBS injection. D) Output of microplate reader for hemoglobin measurements was in very good agreement with the visual observation of fibrin clots in C. Error bars are presented as mean ± SEM of three measurements for each untreated and tPA-treated sample at each time point.
Fig. 4.
Fig. 4.
Scanning electron microscope (SEM) images of fibrin clots for tPA-treated (fibrinolytic) and untreated (control) samples at three different time points on the ClotChip readout curve indicated in Fig. 3. A–B) Both samples formed stable clots as indicated by the deformation of red blood cells (RBCs) and their trapping in a netted fibrin mesh by the time the permittivity variation had stabilized. C–D) By the time point of permittivity inflection, the fibrin mesh had broken down in the fibrinolytic sample due to tPA-induced upregulated fibrinolysis, with the RBCs largely retrieving their biconcave disk-like shape. These changes were not observed in the control sample. E–F) By the measurement endpoint, the fibrin mesh had fully dissolved in the fibrinolytic sample, whereas the control sample continued to maintain a stable clot. The arrows point to the presence of the fibrin mesh (white) as well as examples of biconcave disk-like RBCs (green) and severely deformed RBCs (red).
Fig. 5.
Fig. 5.
Assessment of tranexamic acid (TXA) effect on upregulated fibrinolysis. A) ClotChip readout curve and its first derivative for an untreated whole blood sample, a sample treated with tPA at a concentration of 350 ng/mL, and the same tPA-treated sample with the addition of TXA at two different concentrations to inhibit the tPA-induced upregulated fibrinolysis. All samples had TF added to them at a concentration of 1 pg/mL. The ClotChip B) LT and C) MLR parameters could detect the correction in hemostatic function that occurred with TXA addition. In the absence of fibrin clot lysis within the 2-h duration of these experiments for the untreated and TXA-treated samples, a value of 120 min was assigned to LT for plotting the data. Error bars are presented as mean ± SEM of duplicate measurements.

Similar articles

Cited by

References

    1. Asami K, Sekine K, 2007. Dielectric modeling of erythrocyte aggregation in blood. J. Phys. D Appl. Phys 40, 2197–2204. 10.1088/0022-3727/40/7/051. - DOI
    1. Bakhshiani M, Suster MA, Mohseni P, 2016. A palmtop platform for miniaturized dielectric spectroscopy from MHz to GHz. Proc. IEEE Int. New Circ. Syst. (NEWCAS) Conf. 10.1109/NEWCAS.2016.7604805. - DOI - PubMed
    1. Brill JB, Brenner M, Duchesne J, Roberts D, Ferrada P, Horer T, Kauvar D, Khan M, Kirkpatrick A, Ordonez C, Perreira B, Priouzram A, Cotton BA, 2021. The role of TEG and ROTEM in damage control resuscitation. Shock 56, 52–61. 10.1097/SHK.0000000000001686. - DOI - PMC - PubMed
    1. Brohi K, Cohen MJ, Ganter MT, Matthay MA, Mackersie RC, Pittet JF, 2007. Acute traumatic coagulopathy: initiated by hypoperfusion: modulated through the protein C pathway? Ann. Surg 245, 812–818. 10.1097/01.sla.0000256862.79374.31. - DOI - PMC - PubMed
    1. Cakmak O, Ermek E, Kilinc N, Bulut S, Baris I, Kavakli IH, Yaralioglu GG, Urey H, 2015. A cartridge based sensor array platform for multiple coagulation measurements from plasma. Lab Chip 15, 113–120. 10.1039/c4lc00809j. - DOI - PubMed