. 2022 Aug:169:28-40.
doi: 10.1016/j.yjmcc.2022.04.012. Epub 2022 May 6.

Partial and complete loss of myosin binding protein H-like cause cardiac conduction defects

Affiliations

Partial and complete loss of myosin binding protein H-like cause cardiac conduction defects

David Y Barefield et al. J Mol Cell Cardiol. 2022 Aug.

Abstract

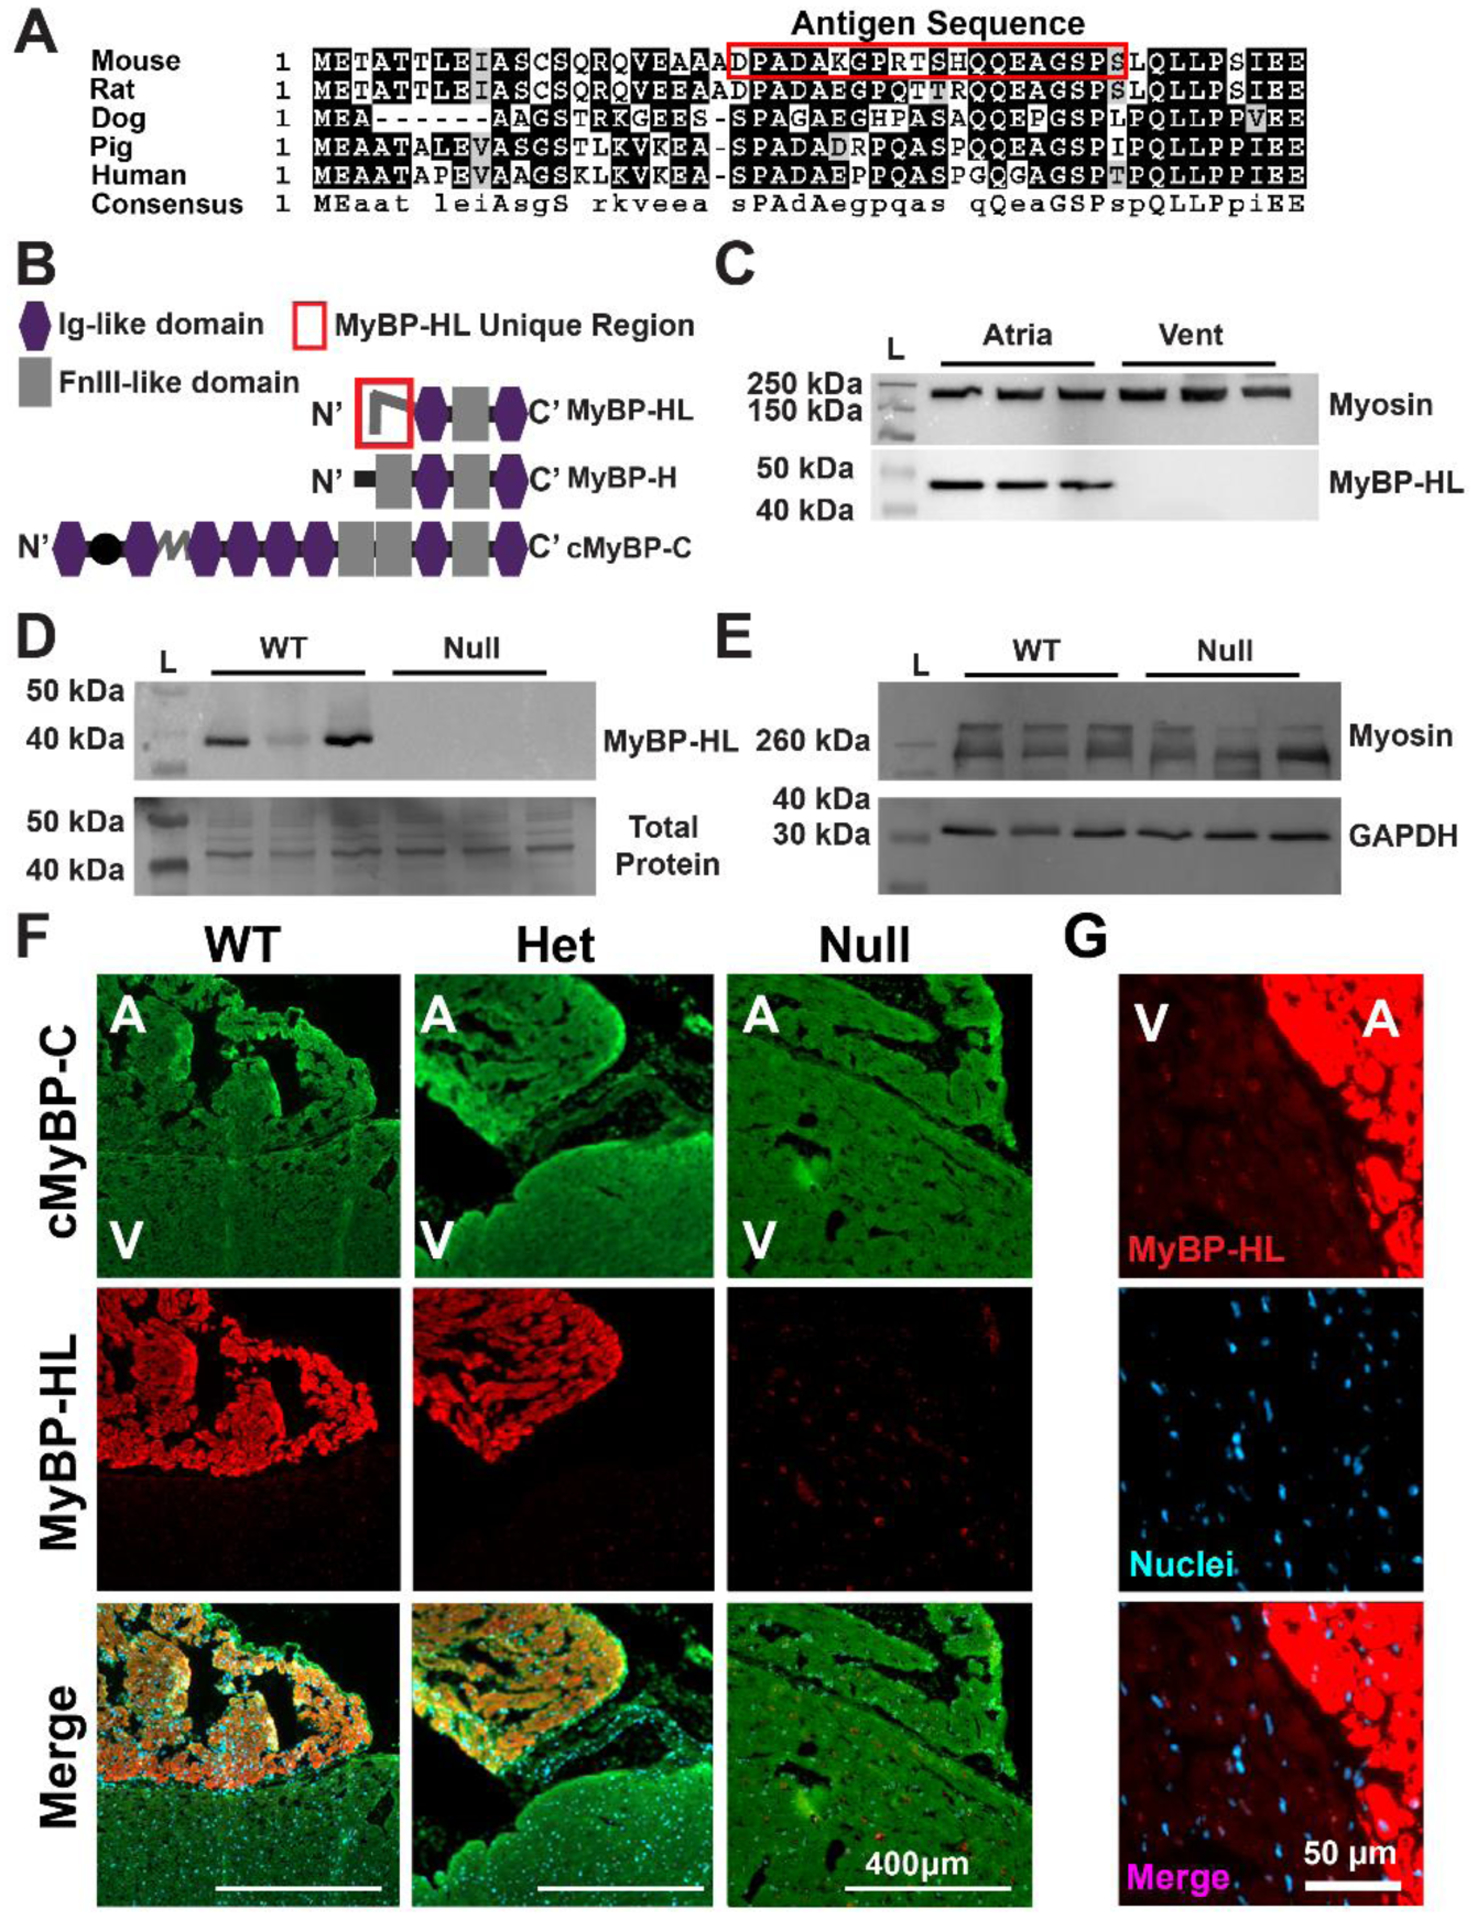
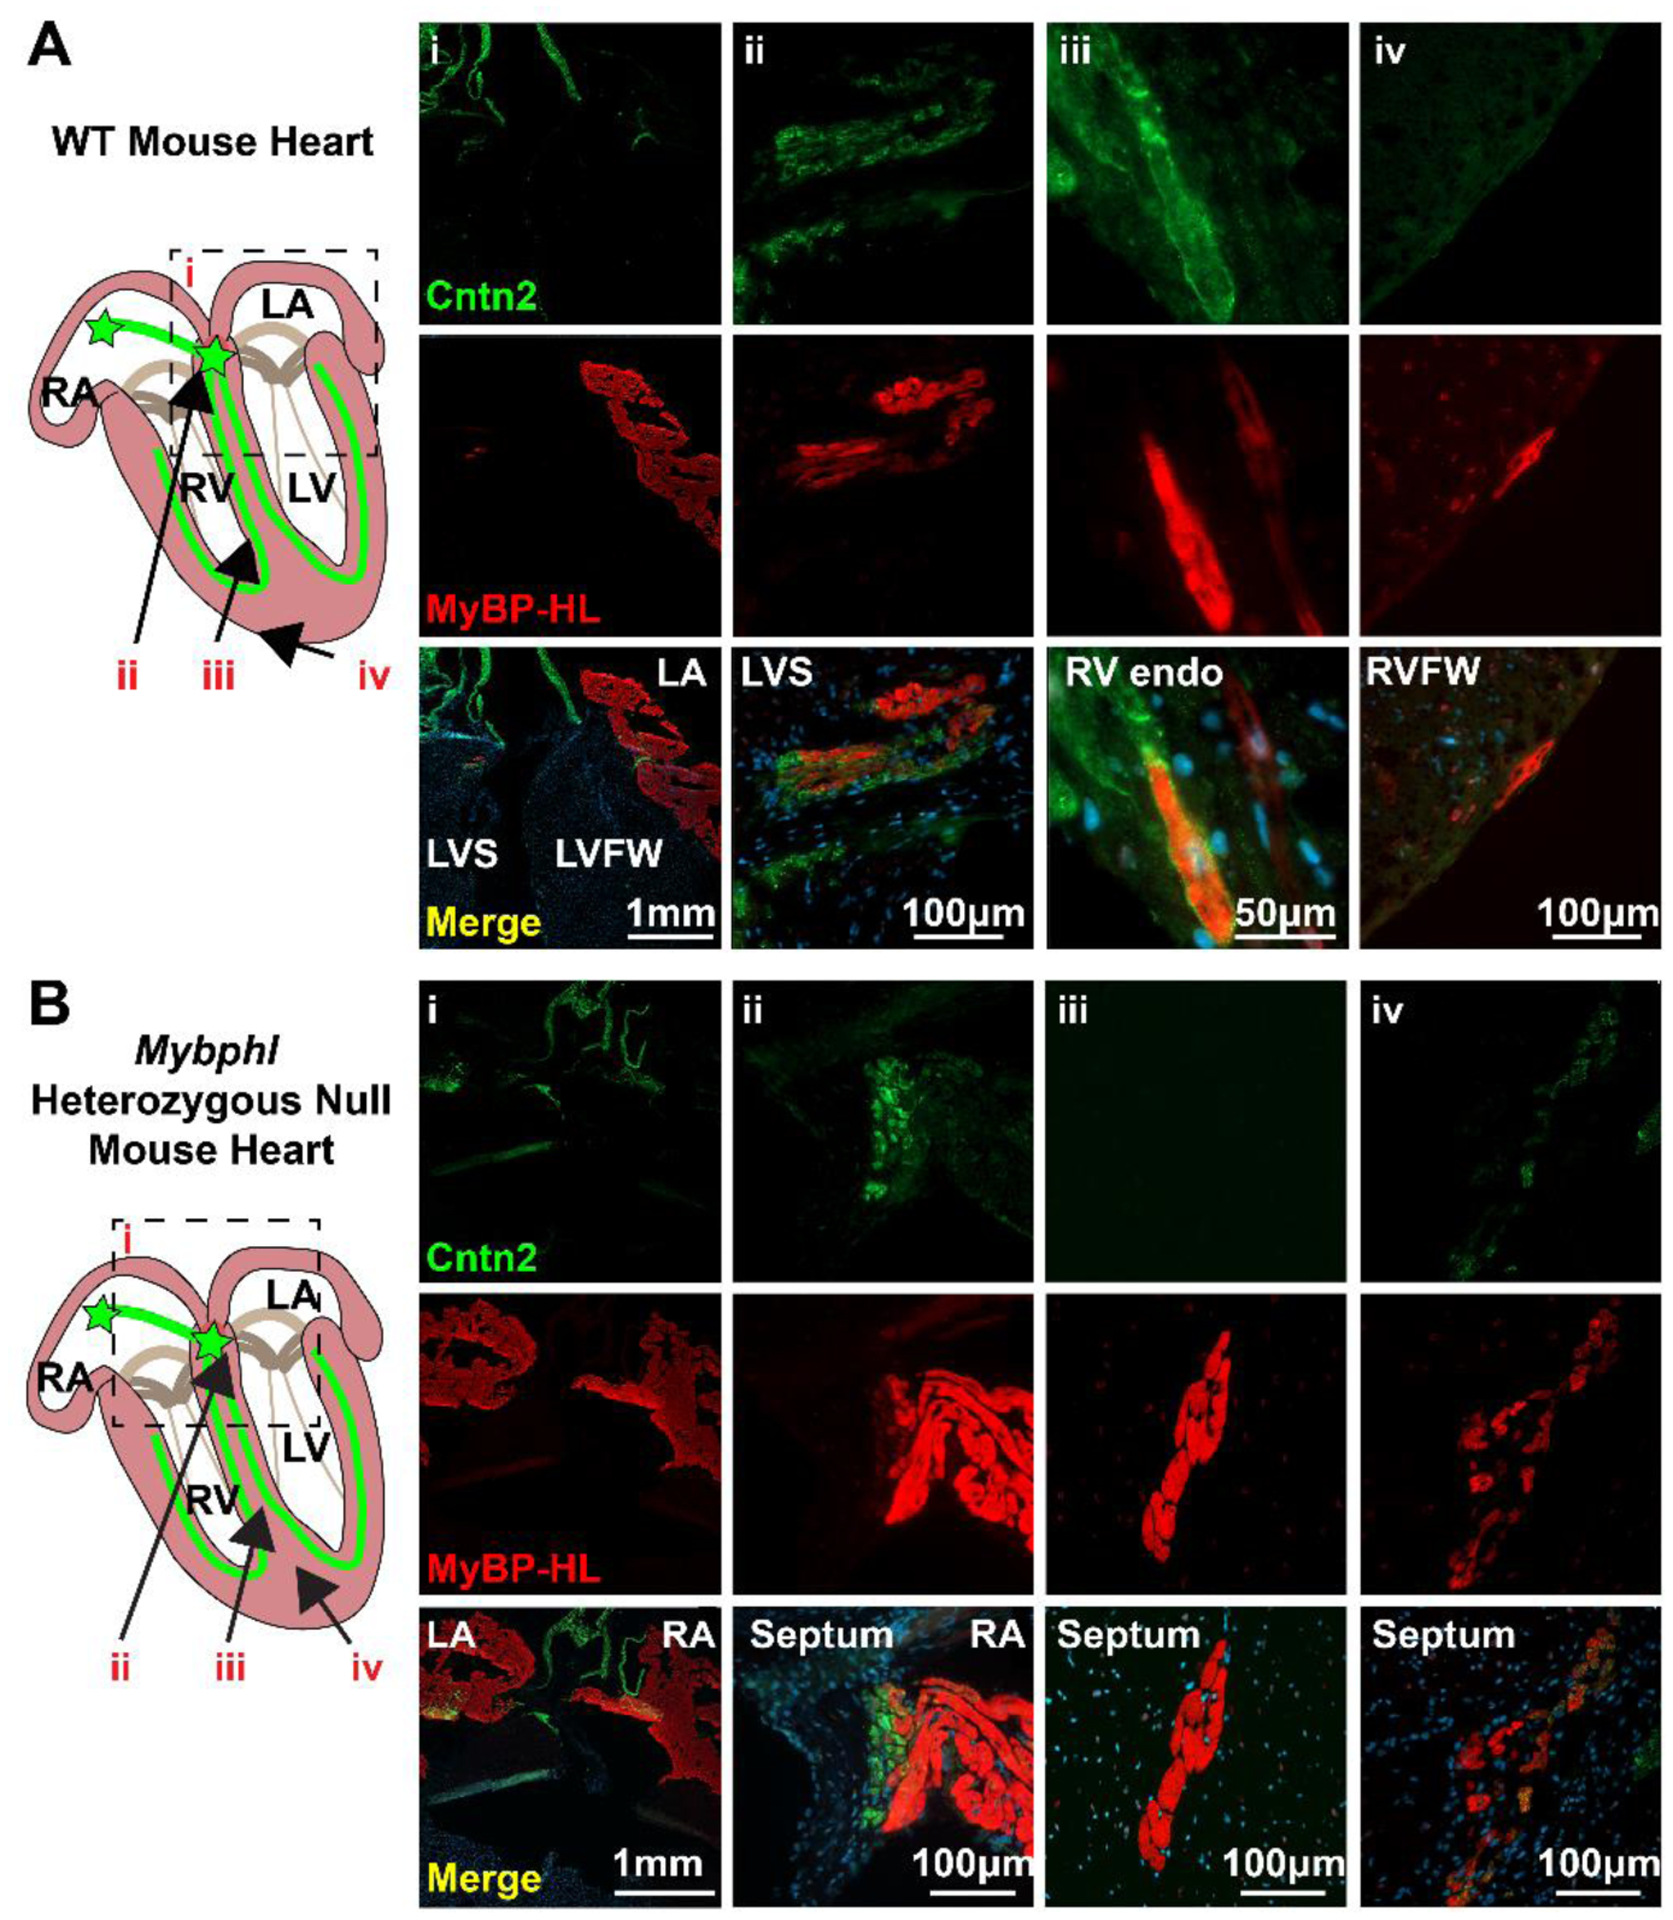
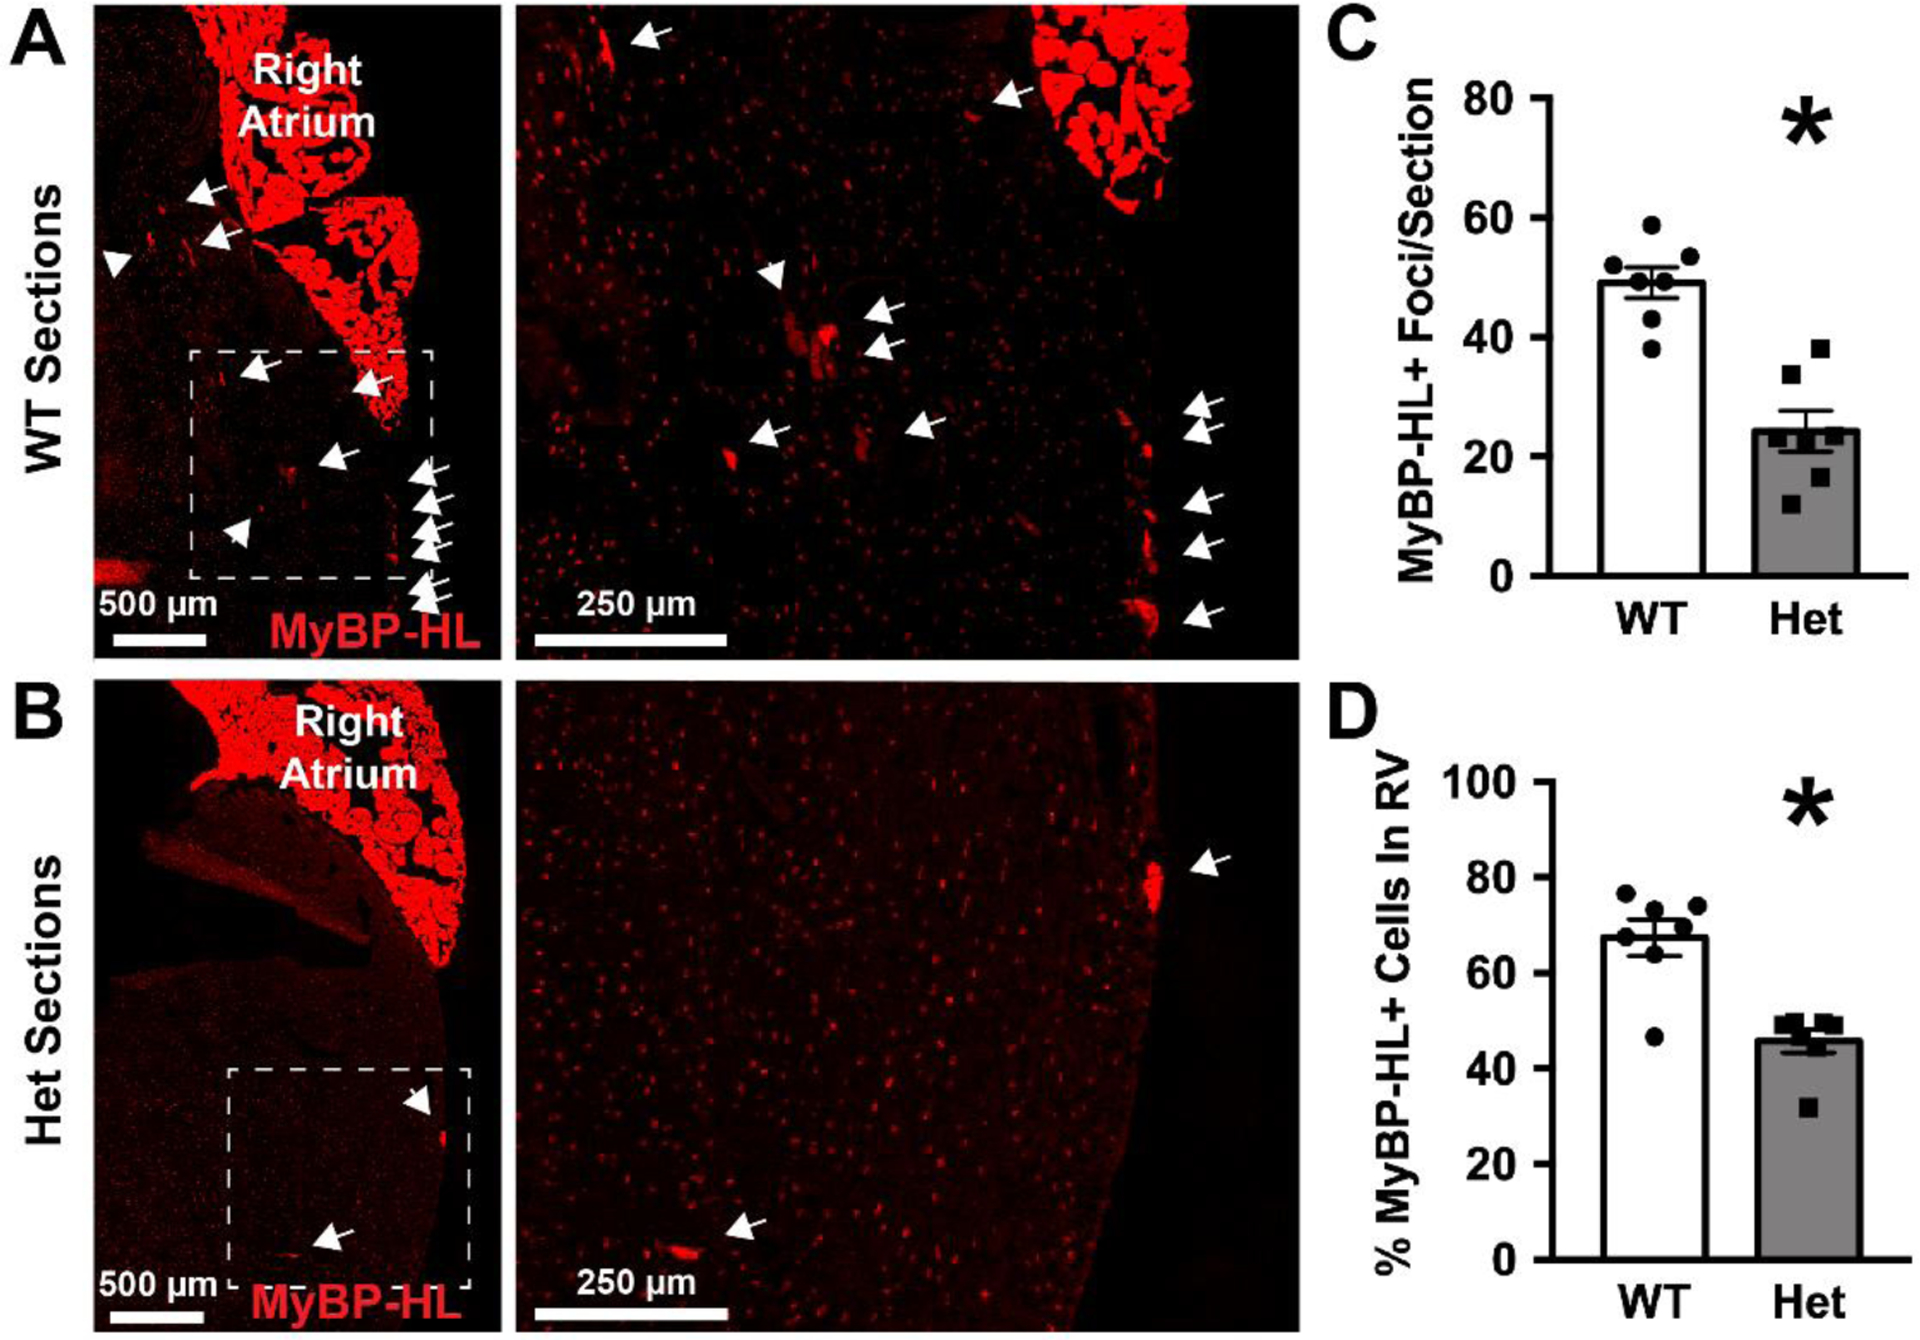
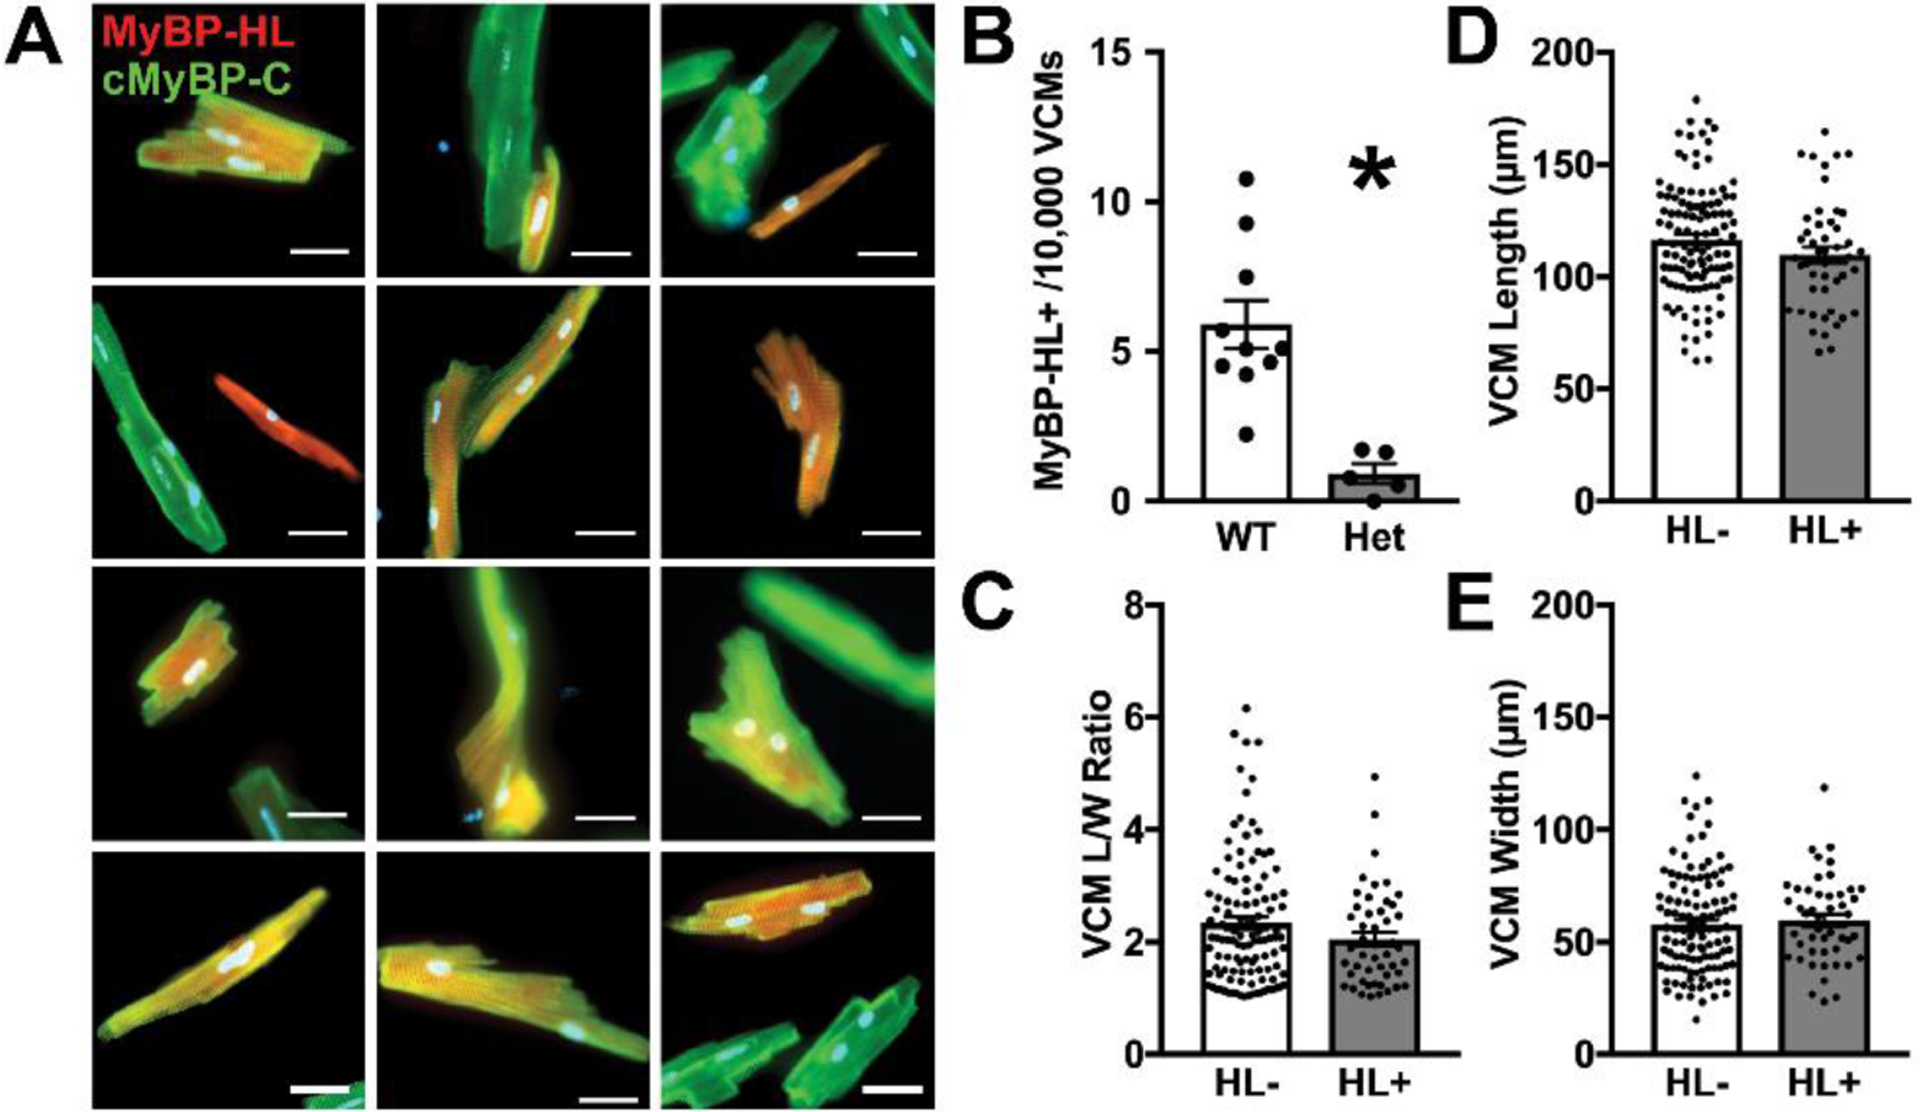
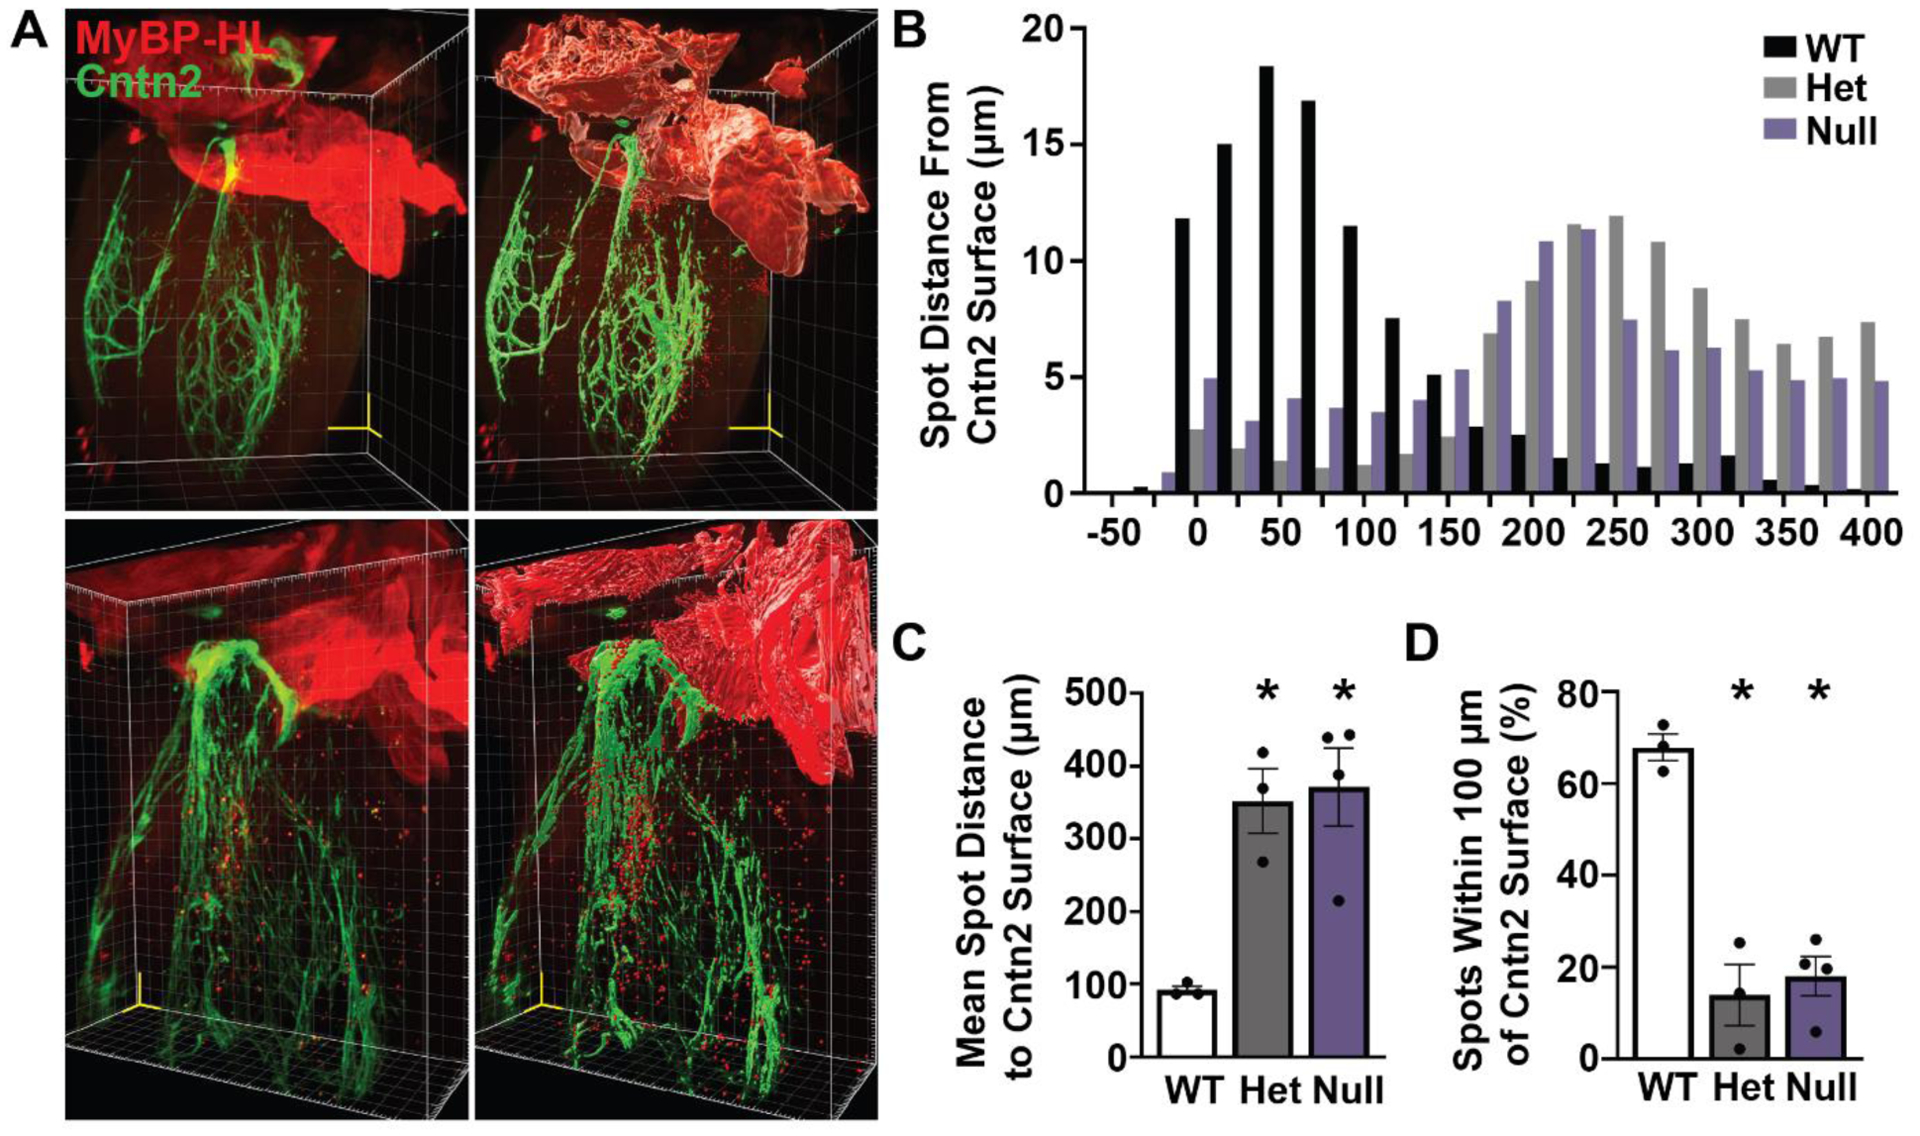
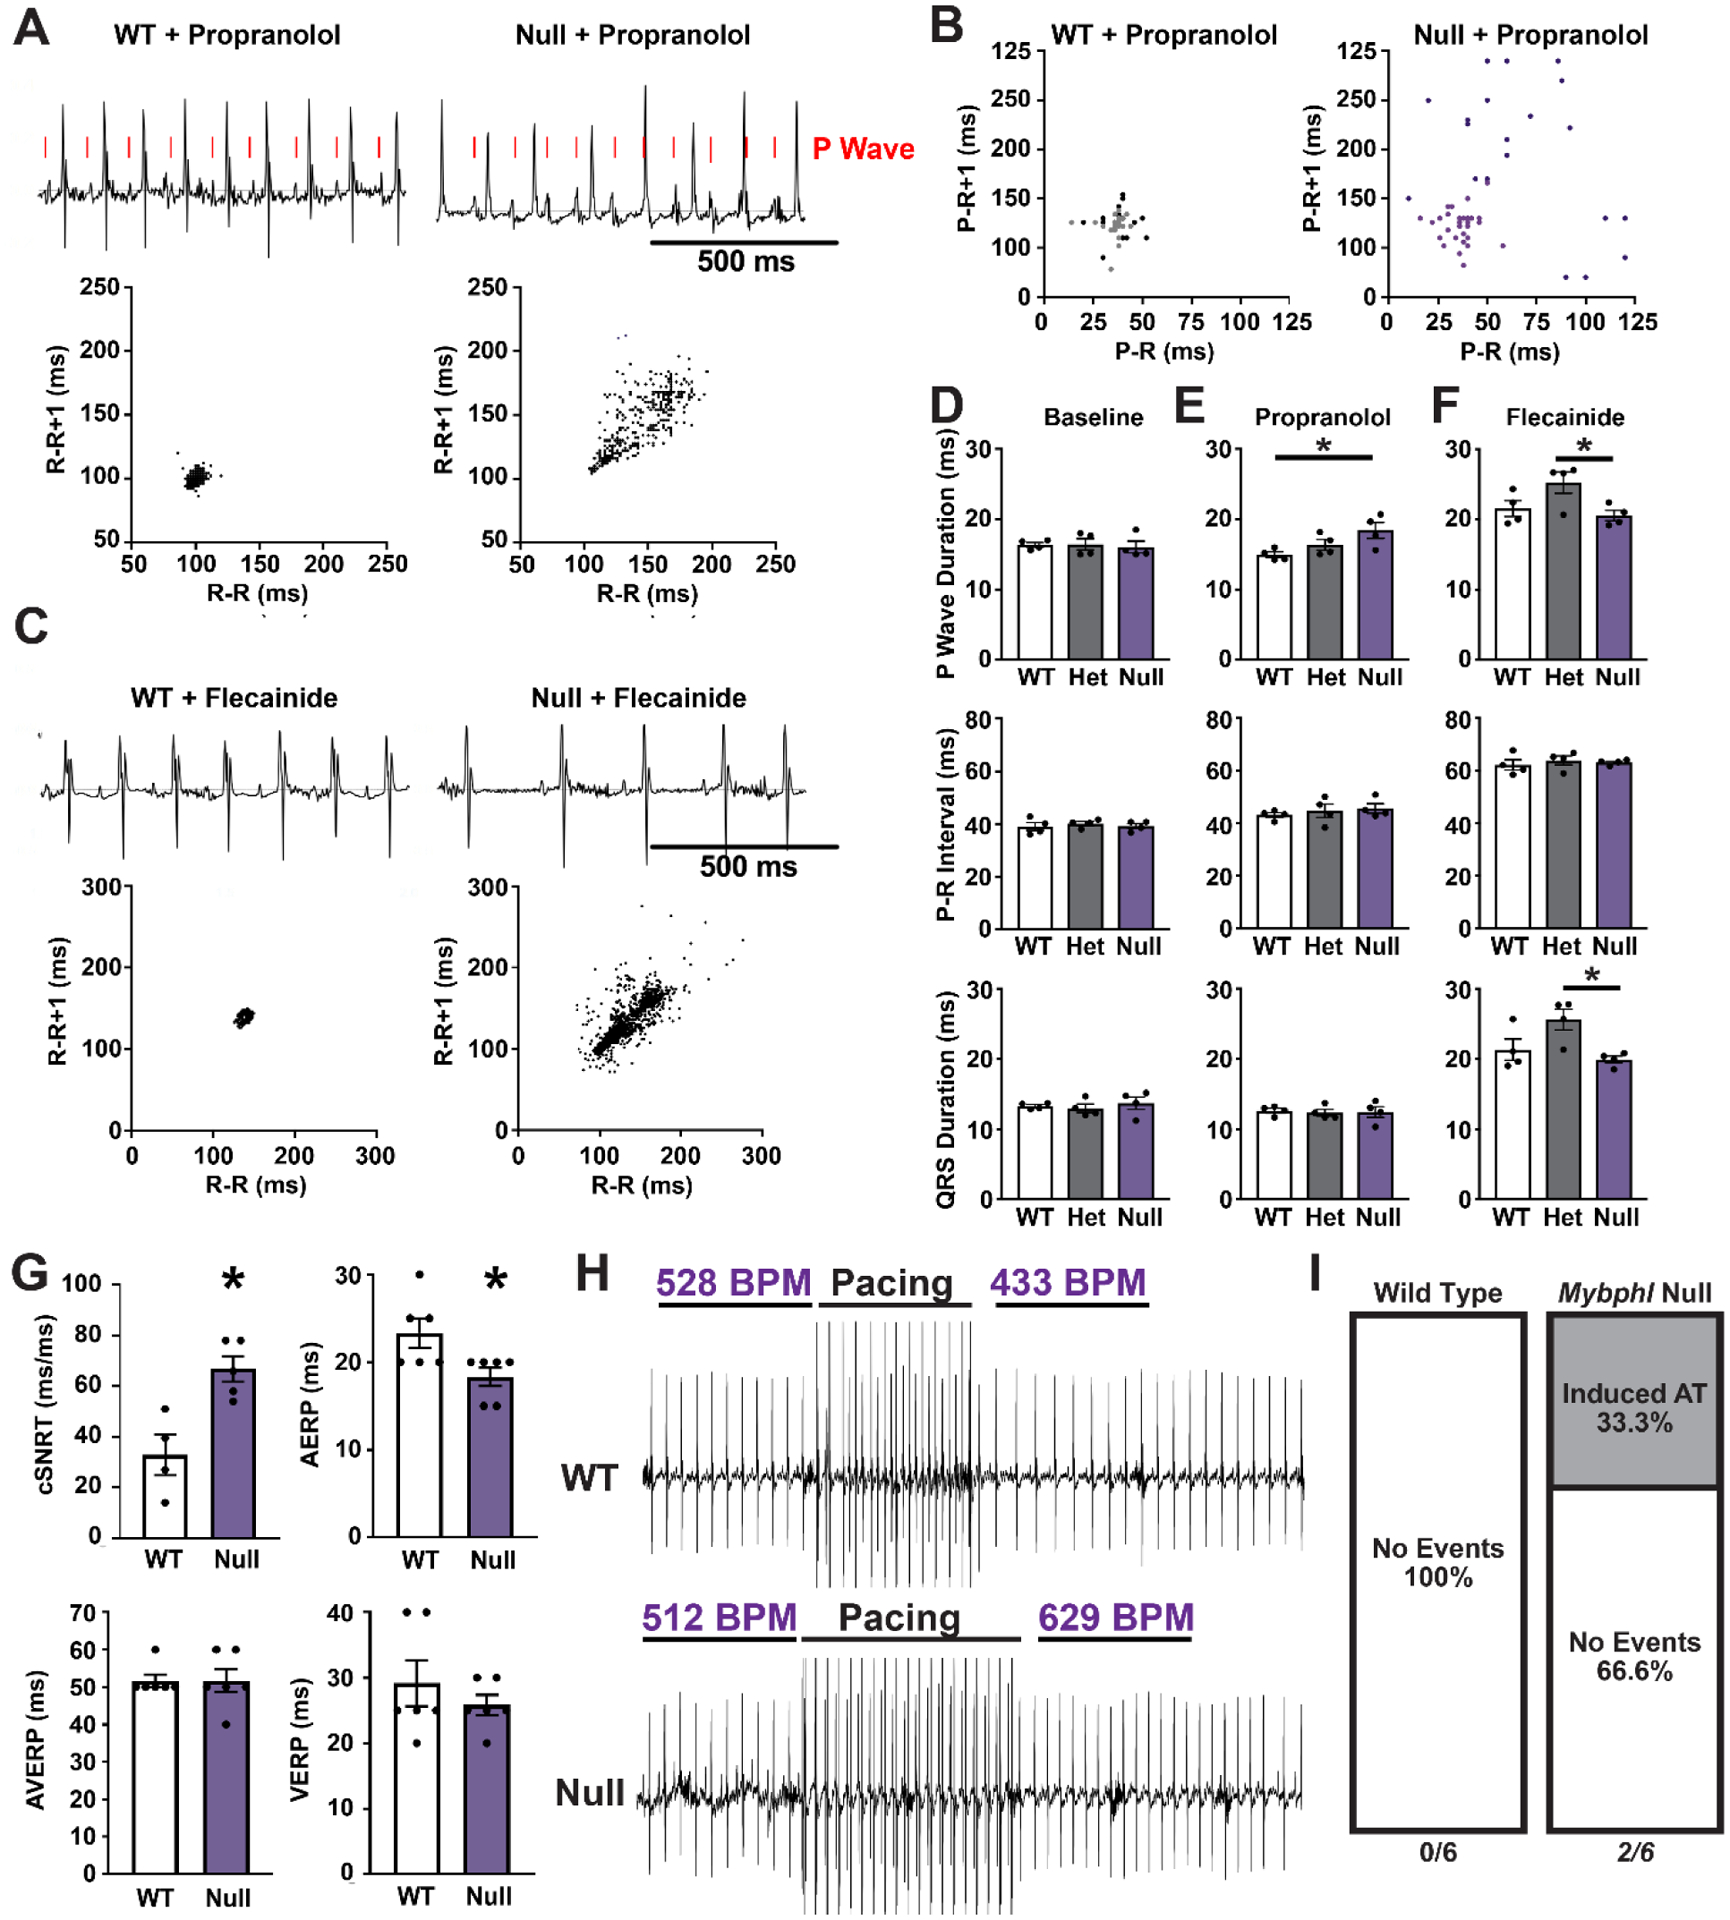
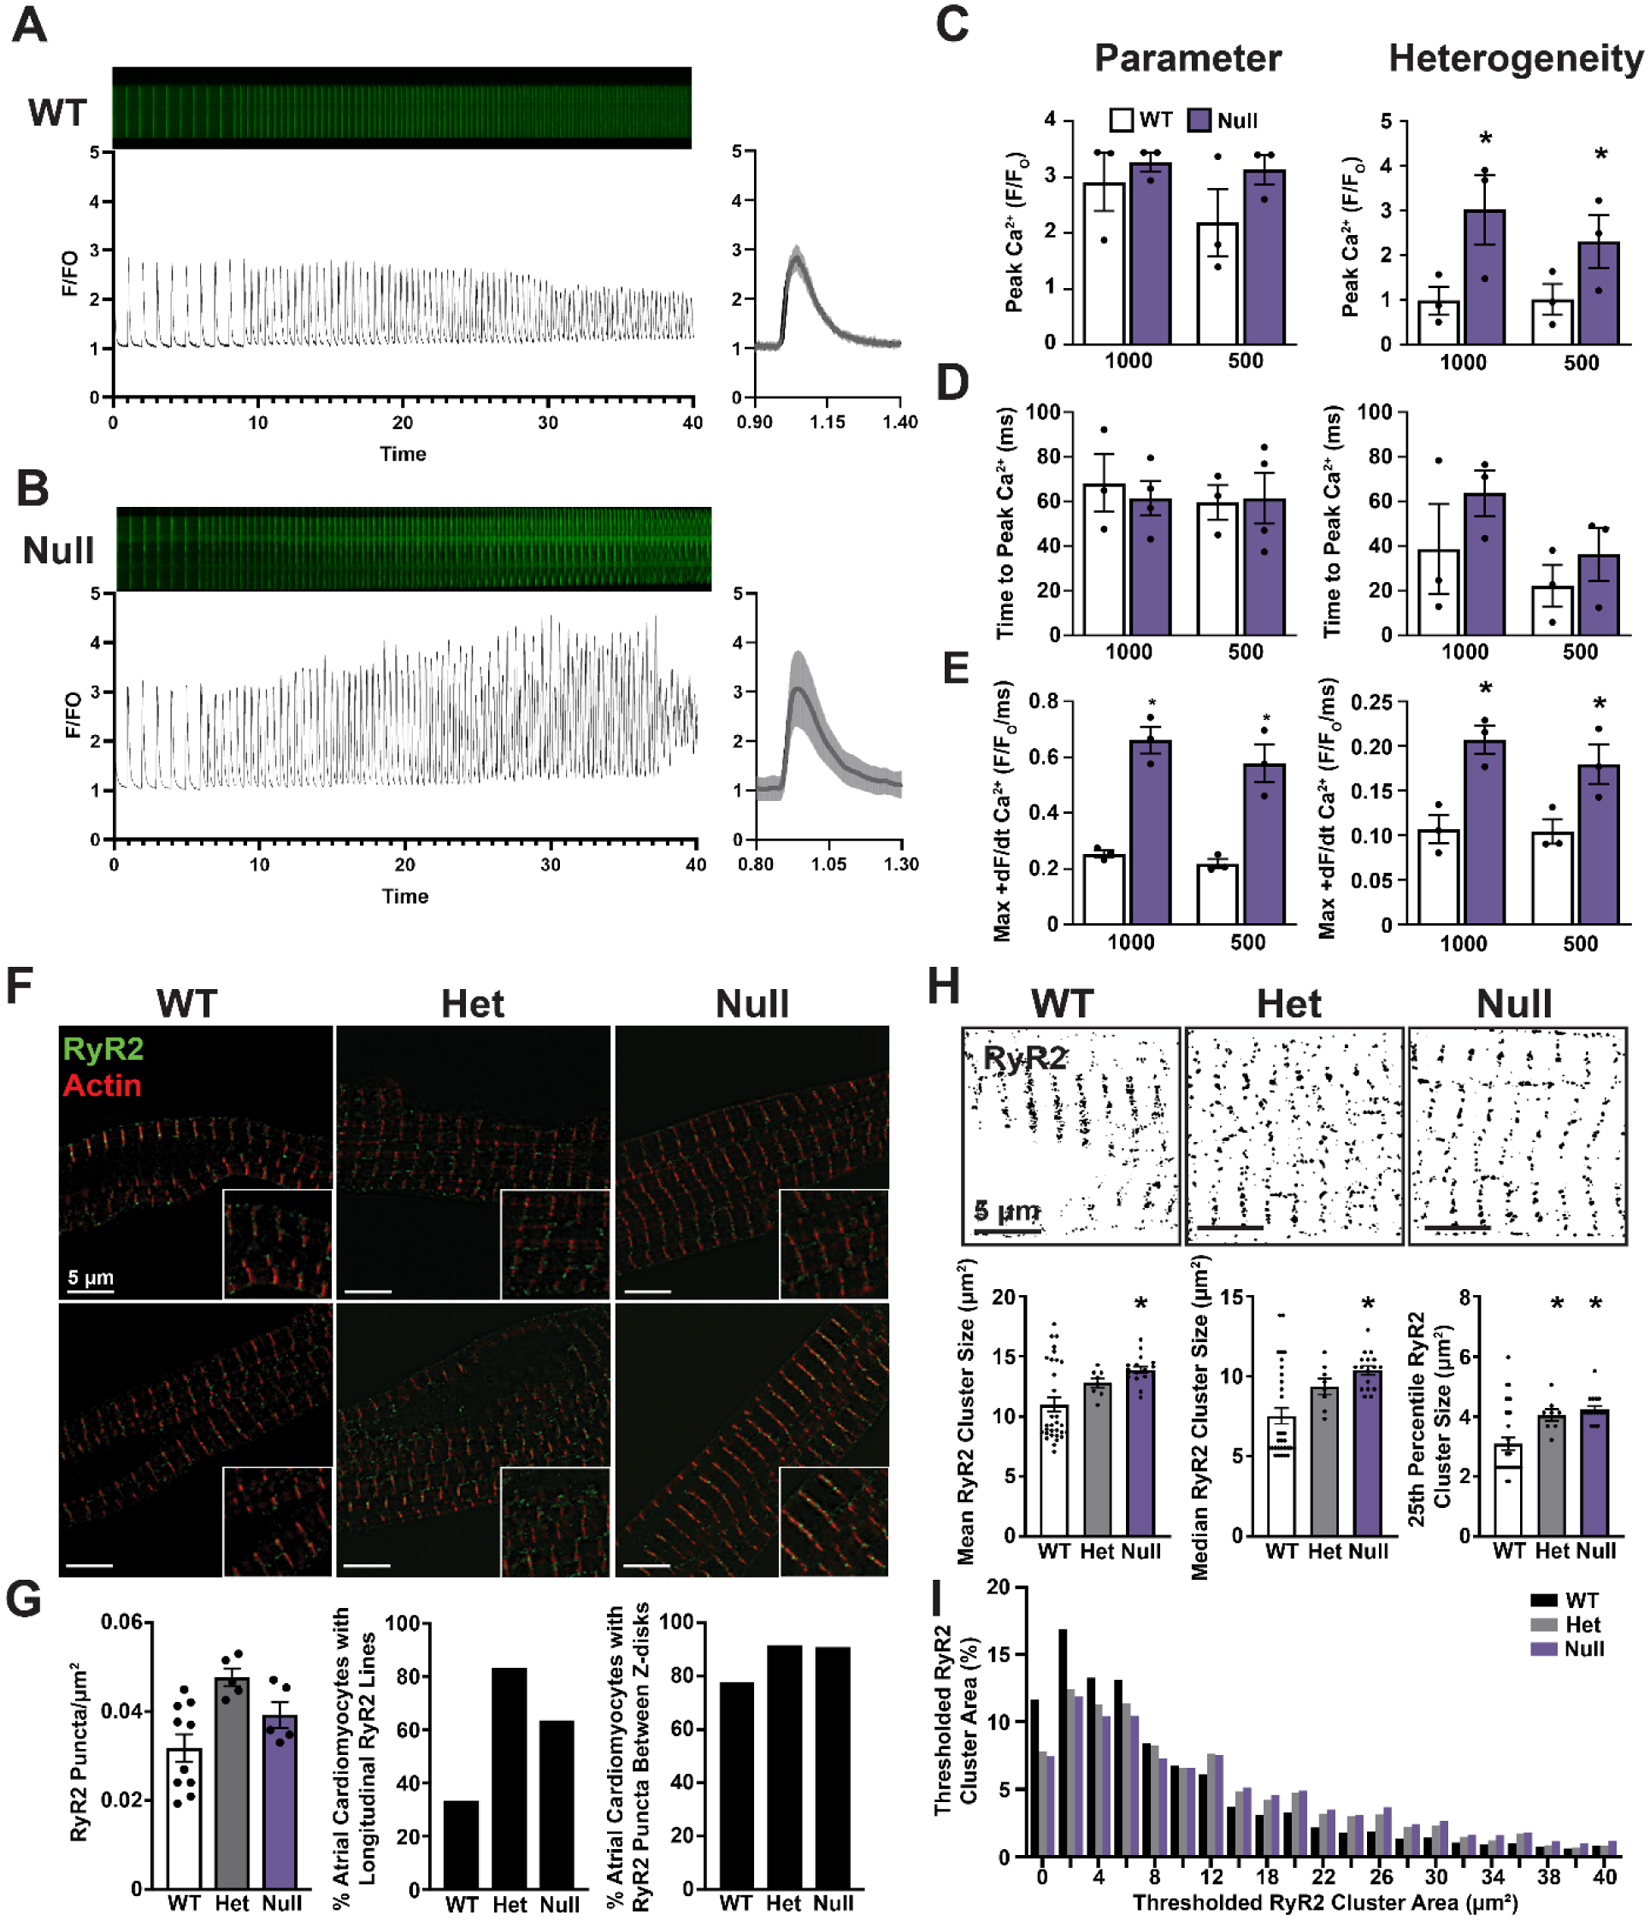
A premature truncation of MYBPHL in humans and a loss of Mybphl in mice is associated with dilated cardiomyopathy, atrial and ventricular arrhythmias, and atrial enlargement. MYBPHL encodes myosin binding protein H-like (MyBP-HL). Prior work in mice indirectly identified Mybphl expression in the atria and in small puncta throughout the ventricle. Because of its genetic association with human and mouse cardiac conduction system disease, we evaluated the anatomical localization of MyBP-HL and the consequences of loss of MyBP-HL on conduction system function. Immunofluorescence microscopy of normal adult mouse ventricles identified MyBP-HL-positive ventricular cardiomyocytes that co-localized with the ventricular conduction system marker contactin-2 near the atrioventricular node and in a subset of Purkinje fibers. Mybphl heterozygous ventricles had a marked reduction of MyBP-HL-positive cells compared to controls. Lightsheet microscopy of normal perinatal day 5 mouse hearts showed enrichment of MyBP-HL-positive cells within and immediately adjacent to the contactin-2-positive ventricular conduction system, but this association was not apparent in Mybphl heterozygous hearts. Surface telemetry of Mybphl-null mice revealed atrioventricular block and atrial bigeminy, while intracardiac pacing revealed a shorter atrial relative refractory period and atrial tachycardia. Calcium transient analysis of isolated Mybphl-null atrial cardiomyocytes demonstrated an increased heterogeneity of calcium release and faster rates of calcium release compared to wild type controls. Super-resolution microscopy of Mybphl heterozygous and homozygous null atrial cardiomyocytes showed ryanodine receptor disorganization compared to wild type controls. Abnormal calcium release, shorter atrial refractory period, and atrial dilation seen in Mybphl null, but not wild type control hearts, agree with the observed atrial arrhythmias, bigeminy, and atrial tachycardia, whereas the proximity of MyBP-HL-positive cells with the ventricular conduction system provides insight into how a predominantly atrial expressed gene contributes to ventricular arrhythmias and ventricular dysfunction.

Keywords: Atrial cardiomyocyte; Cardiomyopathy; MYBPHL; MyBP-HL; Myosin binding protein; Ventricular conduction system.


Figures

Figure 1.
Figure 1.. MyBP-HL is found primarily in the atria.
(A) Alignment of the amino terminal residues of MyBP-HL across five species shows similarities between rat and mouse, with less conservation between rodents and larger mammals. (B) Domain structure schematic of MyBP-HL and related myosin binding proteins depicting the MyBP-HL-specific amino-terminal sequence used to generate the antibody. (C) Immunoblotting using the anti-MyBP-HL antibody on protein lysate from mouse atria and ventricles shows atrial expression of MyBP-HL with total sarcomere content represented with myosin immunoblotting. N = 3 hearts, 2 male, 1 female. (D) Immunoblot using total atrial protein from wild type and homozygous Mybphl null mouse hearts showed reactivity with a 40 kDa protein that is absent in Mybphl null atria. N = 3 hearts, 1 male, 2 female per genotype. Total protein content of the membrane shown. N = 3 hearts per genotype. (E) Immunoblotting of the same protein lysates from (D) for total sarcomere content with myosin and GAPDH as a loading control shows similar sarcomere content from WT and Mybphl homozygous null atria. (F) Immunofluorescence microscopy of sectioned frozen mouse hearts immunostained for cMyBP-C found in both atria (A) and ventricle (V), with MyBP-HL localized to the atria in wild type (WT) and heterozygous Mybphl mice. MyBP-HL protein was absent from Mybphl homozygous null hearts. (G) The MyBP-HL antibody shows off-target staining on the nuclear membrane, noticeable in WT ventricle sections.
Figure 2.
Figure 2.. MyBP-HL is found in the atrioventricular transition tissue and a subset of the ventricle.
(A) Immunofluorescence microscopy of 5 μm thick frozen sections of wild type mouse hearts stained with MyBP-HL (red) and the ventricular conduction system marker contactin-2 (Cntn2). Panels show: low (i) and high (ii) magnification images of the interventricular septum at the base of the heart where atrial tissue enters the ventricle and MyBP-HL staining overlaps with contactin-2 in the ventricle. (iii) A contactin-2 stained Purkinje fiber in the RV endocardial wall shows co-staining with MyBP-HL in some ventricular conduction system cardiomyocytes. (iv) MyBP-HL-stained ventricular cardiomyocytes on the RV epicardium with no associated contactin-2 staining. (B) Immunofluorescence microscopy of 5 μm thick frozen sections of Mybphl heterozygous mouse hearts stained with MyBP-HL (red) and the ventricular conduction system marker contactin-2 (green). Panels show: low (i) and high (ii) magnification images of the interventricular septum at the base of the heart where atrial tissue enters the ventricle and MyBP-HL staining overlaps with contactin-2 in the ventricle. (iii) A large cluster of MyBP-HL positive cells in the LV septum with no associated contactin-2 staining. (iv) A multicellular cluster of MyBP-HL positive cells in the septum with overlapping contactin-2 staining. Female hearts.
Figure 3.
Figure 3.. MyBP-HL heterozygous hearts have reduced numbers of ventricular MyBP-HL foci.
(A) Right ventricular free wall region from a WT heart stained with MyBP-HL (red), with expanded view of the RV free wall showing individual MyBP-HL-positive foci (arrows). (B) Right ventricular free wall region from a Mybphl heterozygous heart stained with MyBP-HL and contactin-2 show fewer and larger MyBP-HL foci. Speckled red background signal in panels A and B are off target staining from this antibody that occurs perinuclearly throughout the heart. (C) Quantification of the numbers of MyBP-HL foci per section. (D) Quantification of the percentage of MyBP-HL foci that were found in the RV free wall. N = average foci count per slide from 4 – 6 sections/slide. N = 7 WT, 7 Het slides. Female hearts. * = P< 0.05 by two-tailed t-test
Figure 4.
Figure 4.. MyBP-HL expressing ventricular cardiomyocytes have diverse morphologies with fewer MyBP-HL-positive ventricular cells in heterozygous hearts.
(A) Isolated ventricular cardiomyocytes stained with MyBP-HL (red) and cMyBP-C (green). (B) The number of MyBP-HL positive cells counted in total ventricular cardiomyocyte single cell preparations. N = average frequency in isolations from 10 WT mice, 5 Het mice. * = P< 0.05 by two-tailed t-test. (C – E) The length/width ratio, cell length, and cell width values for isolated MyBP-HL positive ventricular cardiomyocytes compared to MyBP-HL negative ventricular cardiomyocytes. N = 6 WT isolations, 4 male, 2 female; 112 MyBP-HL(−) cells, 48 MyBP-HL(+) ventricular cardiomyocytes.
Figure 5.
Figure 5.. Ventricular MyBP-HL puncta are enriched near contactin-2 stained Purkinje fibers.
(A) Reconstructed images from 5 μm step size Z-stacks taken using lightsheet microscopy of a WT perinatal day 5 mouse heart immunostained for MyBP-HL (red) and contactin-2 (Cntn2) (green). Yellow scale volume 500 μm/side. Rendering of surface feature details (right panels) of the MyBP-HL stained atria and contactin-2 stained ventricular conduction system, as well as single spot renderings of MyBP-HL positive ventricular foci. (B) A histogram of the percentage of the shortest distance from each MyBP-HL spot to the contactin-2 surface in Mybphl WT, Het, and Null hearts showed enrichment of MyBP-HL spots near the contactin-2 surface in WT mice. (C) The mean shortest distance between MyBP-HL spots and the contactin-2 surface is significantly increased in Het and Null hearts. (D) WT hearts show most MyBP-HL spots are located within 100 μm of the contactin-2 surface. N = 3 WT, 3 Het, 4 Null. Mixed sex litters. * = p > 0.05 by One-Way ANOVA.
Figure 6.
Figure 6.. Loss of Mybphl results in atrial and ventricular conduction dysfunction.
(A) Conscious ambulatory electrocardiogram recordings on WT and Mybphl null mice following acute propranolol injection shows dissociation of the P-waves in null mice. Poincaré plots of the R-R interval show increased heart rate variability (400 consecutive R waves from single representative animals). (B) Poincaré plots of the P-R intervals taken during 1 – 2 second periods of atrioventricular dissociation in Mybphl null mice illustrate the variable P-R interval. Corresponding period of WT traces shown. Data from two mice, (dark and light dots) shown per genotype. Male and female per genotype. (C) Conscious ambulatory telemetry recordings on WT and Mybphl null mice following acute flecainide injection slows heart rates in both groups, with Mybphl null mice exhibiting high R-R variability (plots show 400 consecutive beats from single representative animals). (D) P-wave duration, P-R interval, and QRS duration measurements obtained from conscious ambulatory telemetry from WT, heterozygous, and homozygous Mybphl null mice, at baseline or following either acute propranolol treatment (E) or flecainide treatment (F). Data averaged from two minutes of recording. N = 4 mice per genotype, both with 2 Male, 2 Female. * = P <0.05 by One-Way ANOVA. (G) Durations for corrected sinus node recovery time (cSNRT), atrial effective refractory period (AERP), atrioventricular node effective refractory period (AVERP), and ventricular effective refractory period (VERP) from intracardiac recordings. N = 6 mice per group. * = P< 0.05 by two-tailed t-test. (H, I) Intracardiac programed stimulation at 50 ms cycle lengths elicited periods of atrial tachycardia in 2 out of 6 Mybphl null mice but this programed stimulation was unable to elicit tachycardia in WT mice. Pre- and post-pacing heart rates are marked above the example traces. N = 6 mice per group, all female.
Figure 7.
Figure 7.. Mybphl heterozygous and homozygous null atrial cardiomyocytes show heterogenous calcium release and aberrant ryanodine receptor organization.
Line scanning confocal images from isolated atrial cardiomyocytes loaded with Cal520 calcium indicator dye and the associated calcium transient profiles from WT (A) and Null (B) groups. Single 1000 ms transient shown with standard deviation across a single cell. (C) Peak calcium transient amplitude at 1000 ms and 500 ms pacing cycle lengths (left) and the heterogeneity index (right) of peak amplitude measured along the length of each cell. N = 3 mice per group, two male, one female WT mice and one male, two female Null mice with averages of 8, 8, and 13 WT cells; 23, 13, and 13 Null cells. (D) Time to peak calcium release at each cycle length (left) and heterogeneity index (right) of time to peak calcium release. (E) The maximal rate of calcium release (+dR/dt) at each frequency and the heterogeneity index of the maximal rate of calcium release. (F) Structured illumination microscopy images of isolated atrial cardiomyocytes stained with anti-ryanodine receptor 2 antibodies and fluorescent conjugated phalloidin to mark actin. (G) Quantification of RyR2 puncta per area, the percent occurrence of cells exhibiting longitudinal lines of RyR2 puncta between myofibers, and the percent of cardiomyocytes with RyR2 puncta outside the peri-Z-disk region. N = Average of all cells from WT, 10; Het 5, Null 5 animals. WT 18 cells, Het 12 cells, Null 11 cells. (H) Otsu thresholding of structured illumination microscopy images and quantification of average RyR2 cluster size, as well as the cluster size of each cell at the 25th percentile and median values. Clusters measured from N = WT 32, Het 8, Null 17 individual cardiomyocytes. (I) Histogram of RyR2 cluster size from thresholded images. N = WT 32, Het 8, Null 17 Individual cardiomyocytes from 2 male, 1 female WT mouse, two female Het mice, and one male, one female null mouse.

Similar articles

Cited by

References

    1. Barefield DY, Puckelwartz MJ, Kim EY, Wilsbacher LD, Vo AH, Waters EA, Earley JU, Hadhazy M, Dellefave-Castillo L, Pesce LL, McNally EM, Experimental Modeling Supports a Role for MyBP-HL as a Novel Myofilament Component in Arrhythmia and Dilated Cardiomyopathy, Circulation 136(16) (2017) 1477–1491. - PMC - PubMed
    1. Alyonycheva T, Cohen-Gould L, Siewert C, Fischman DA, Mikawa T, Skeletal muscle-specific myosin binding protein-H is expressed in Purkinje fibers of the cardiac conduction system, Circ Res 80(5) (1997) 665–72. - PubMed
    1. Mouton J, Loos B, Moolman-Smook JC, Kinnear CJ, Ascribing novel functions to the sarcomeric protein, myosin binding protein H (MyBPH) in cardiac sarcomere contraction, Exp Cell Res 331(2) (2015) 338–51. - PubMed
    1. Mouton JM, van der Merwe L, Goosen A, Revera M, Brink PA, Moolman-Smook JC, Kinnear C, MYBPH acts as modifier of cardiac hypertrophy in hypertrophic cardiomyopathy (HCM) patients, Hum Genet 135(5) (2016) 477–483. - PubMed
    1. McNally EM, Barefield DY, Puckelwartz MJ, The genetic landscape of cardiomyopathy and its role in heart failure, Cell Metab 21(2) (2015) 174–182. - PMC - PubMed

Publication types