. 2022 Aug 15:257:119244.
doi: 10.1016/j.neuroimage.2022.119244. Epub 2022 May 6.

Graph theory analysis identified two hubs that connect sensorimotor and cognitive and cortical and subcortical nociceptive networks in the non-human primate

Affiliations

Graph theory analysis identified two hubs that connect sensorimotor and cognitive and cortical and subcortical nociceptive networks in the non-human primate

Ruiqi Wu et al. Neuroimage. .

Abstract

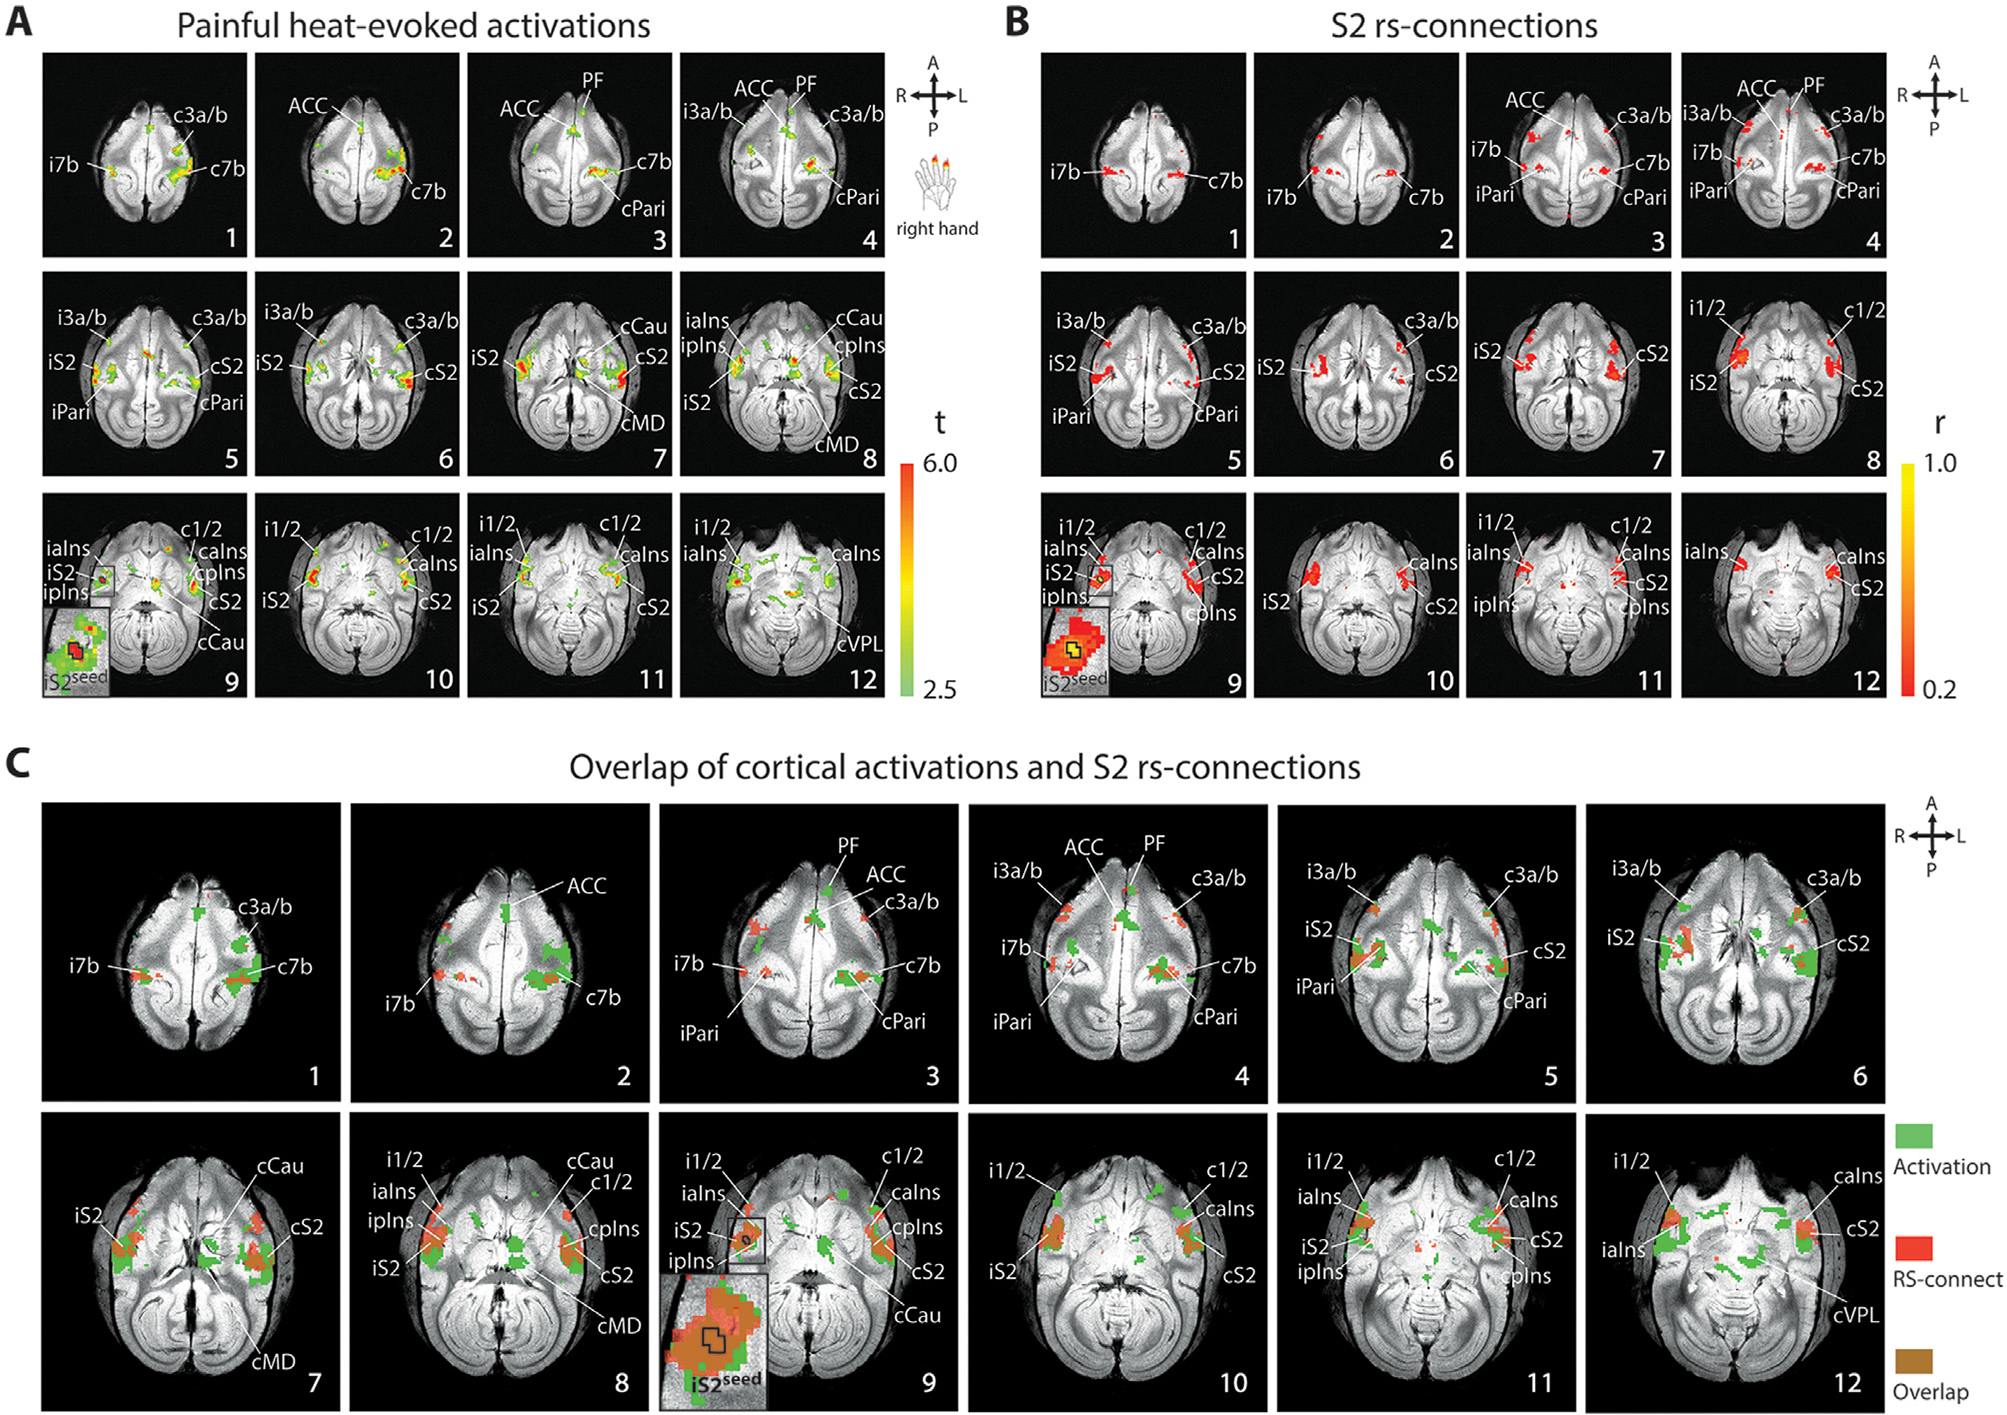
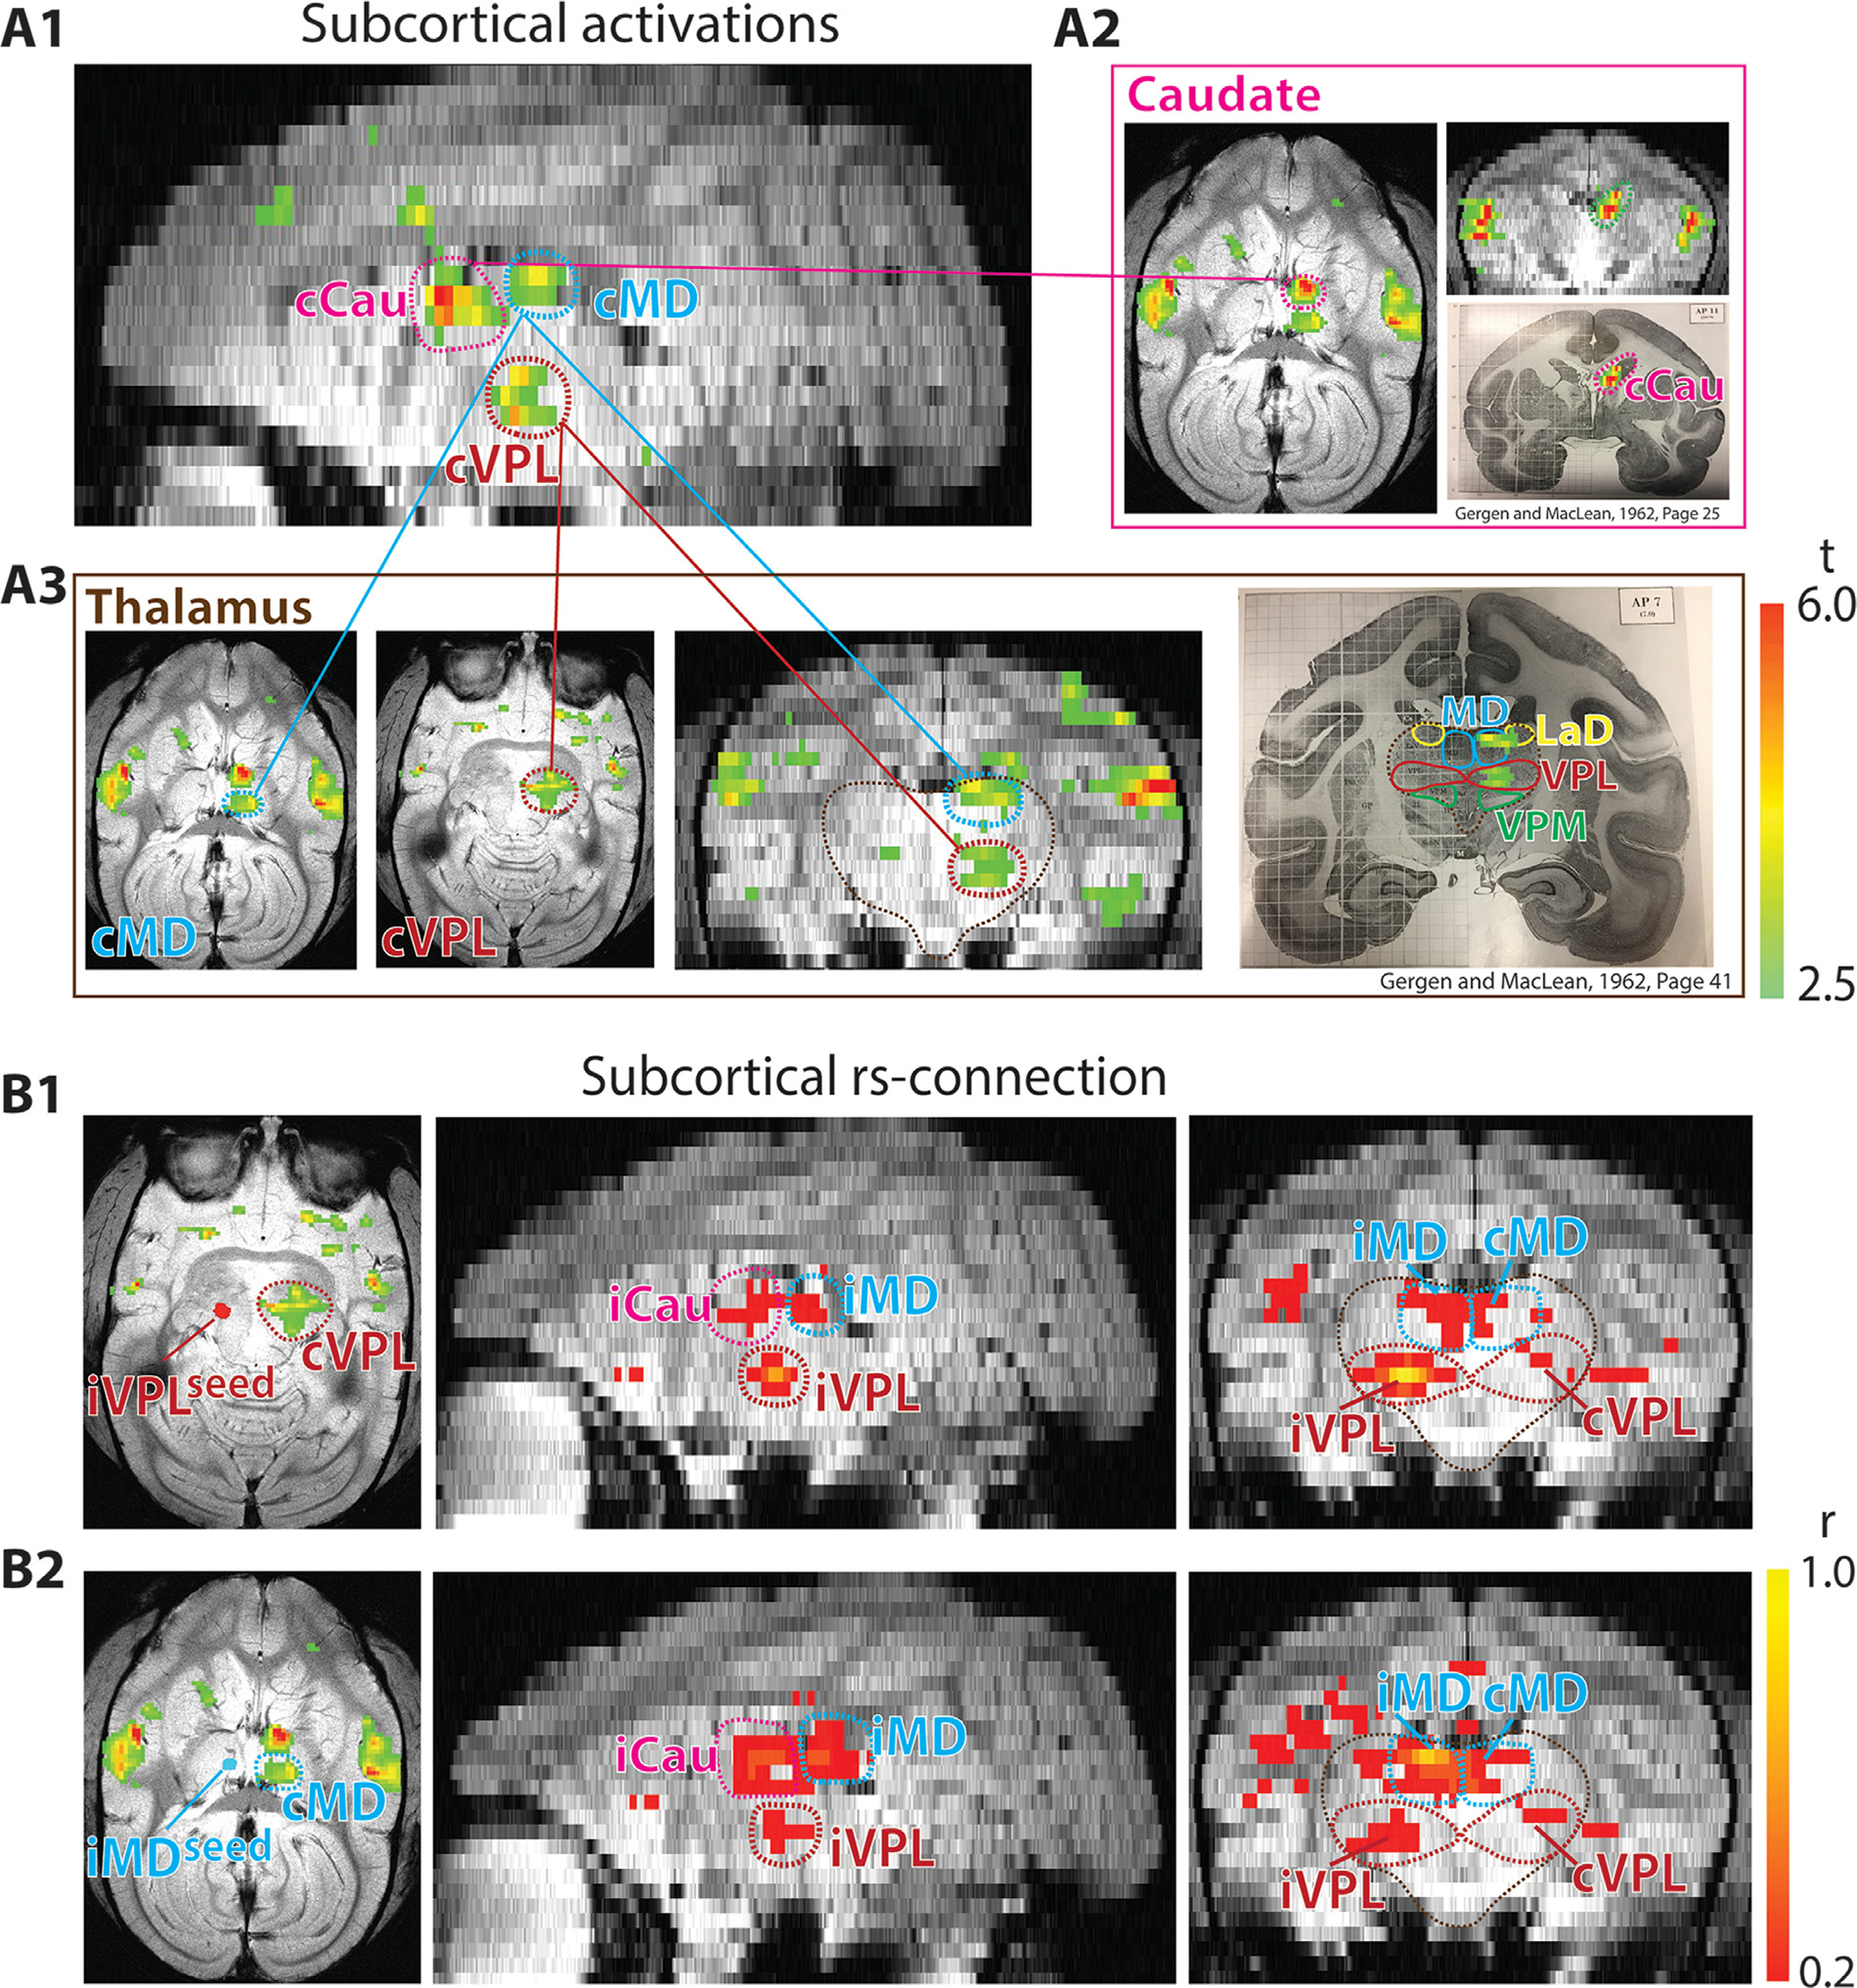
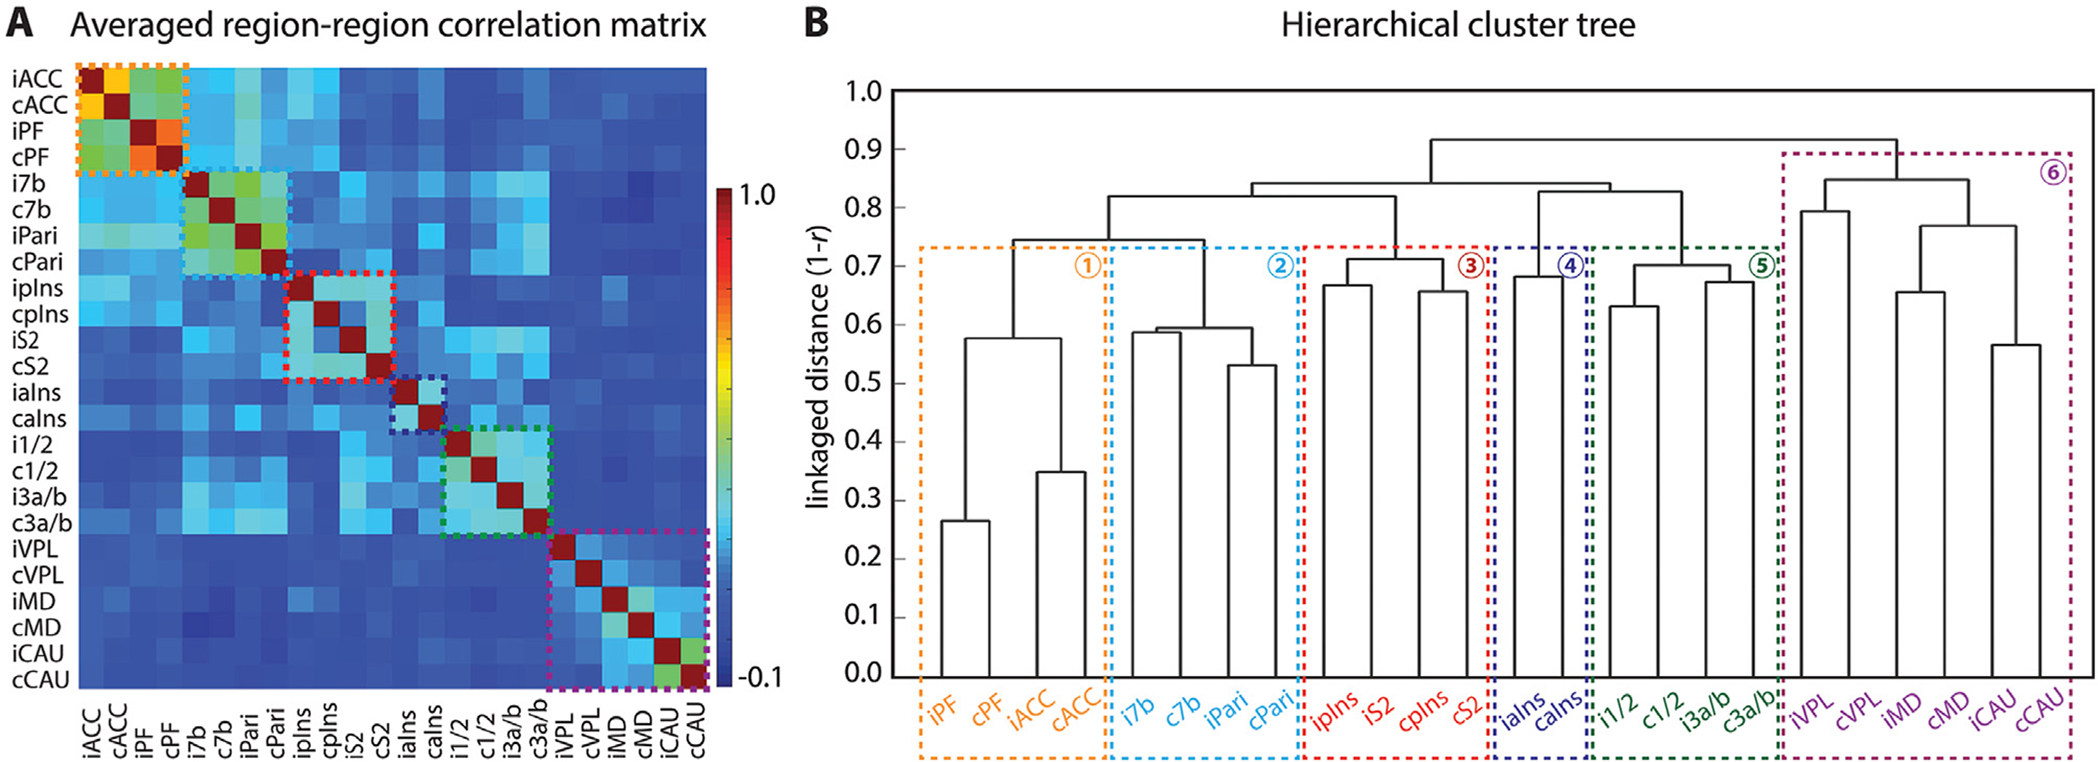
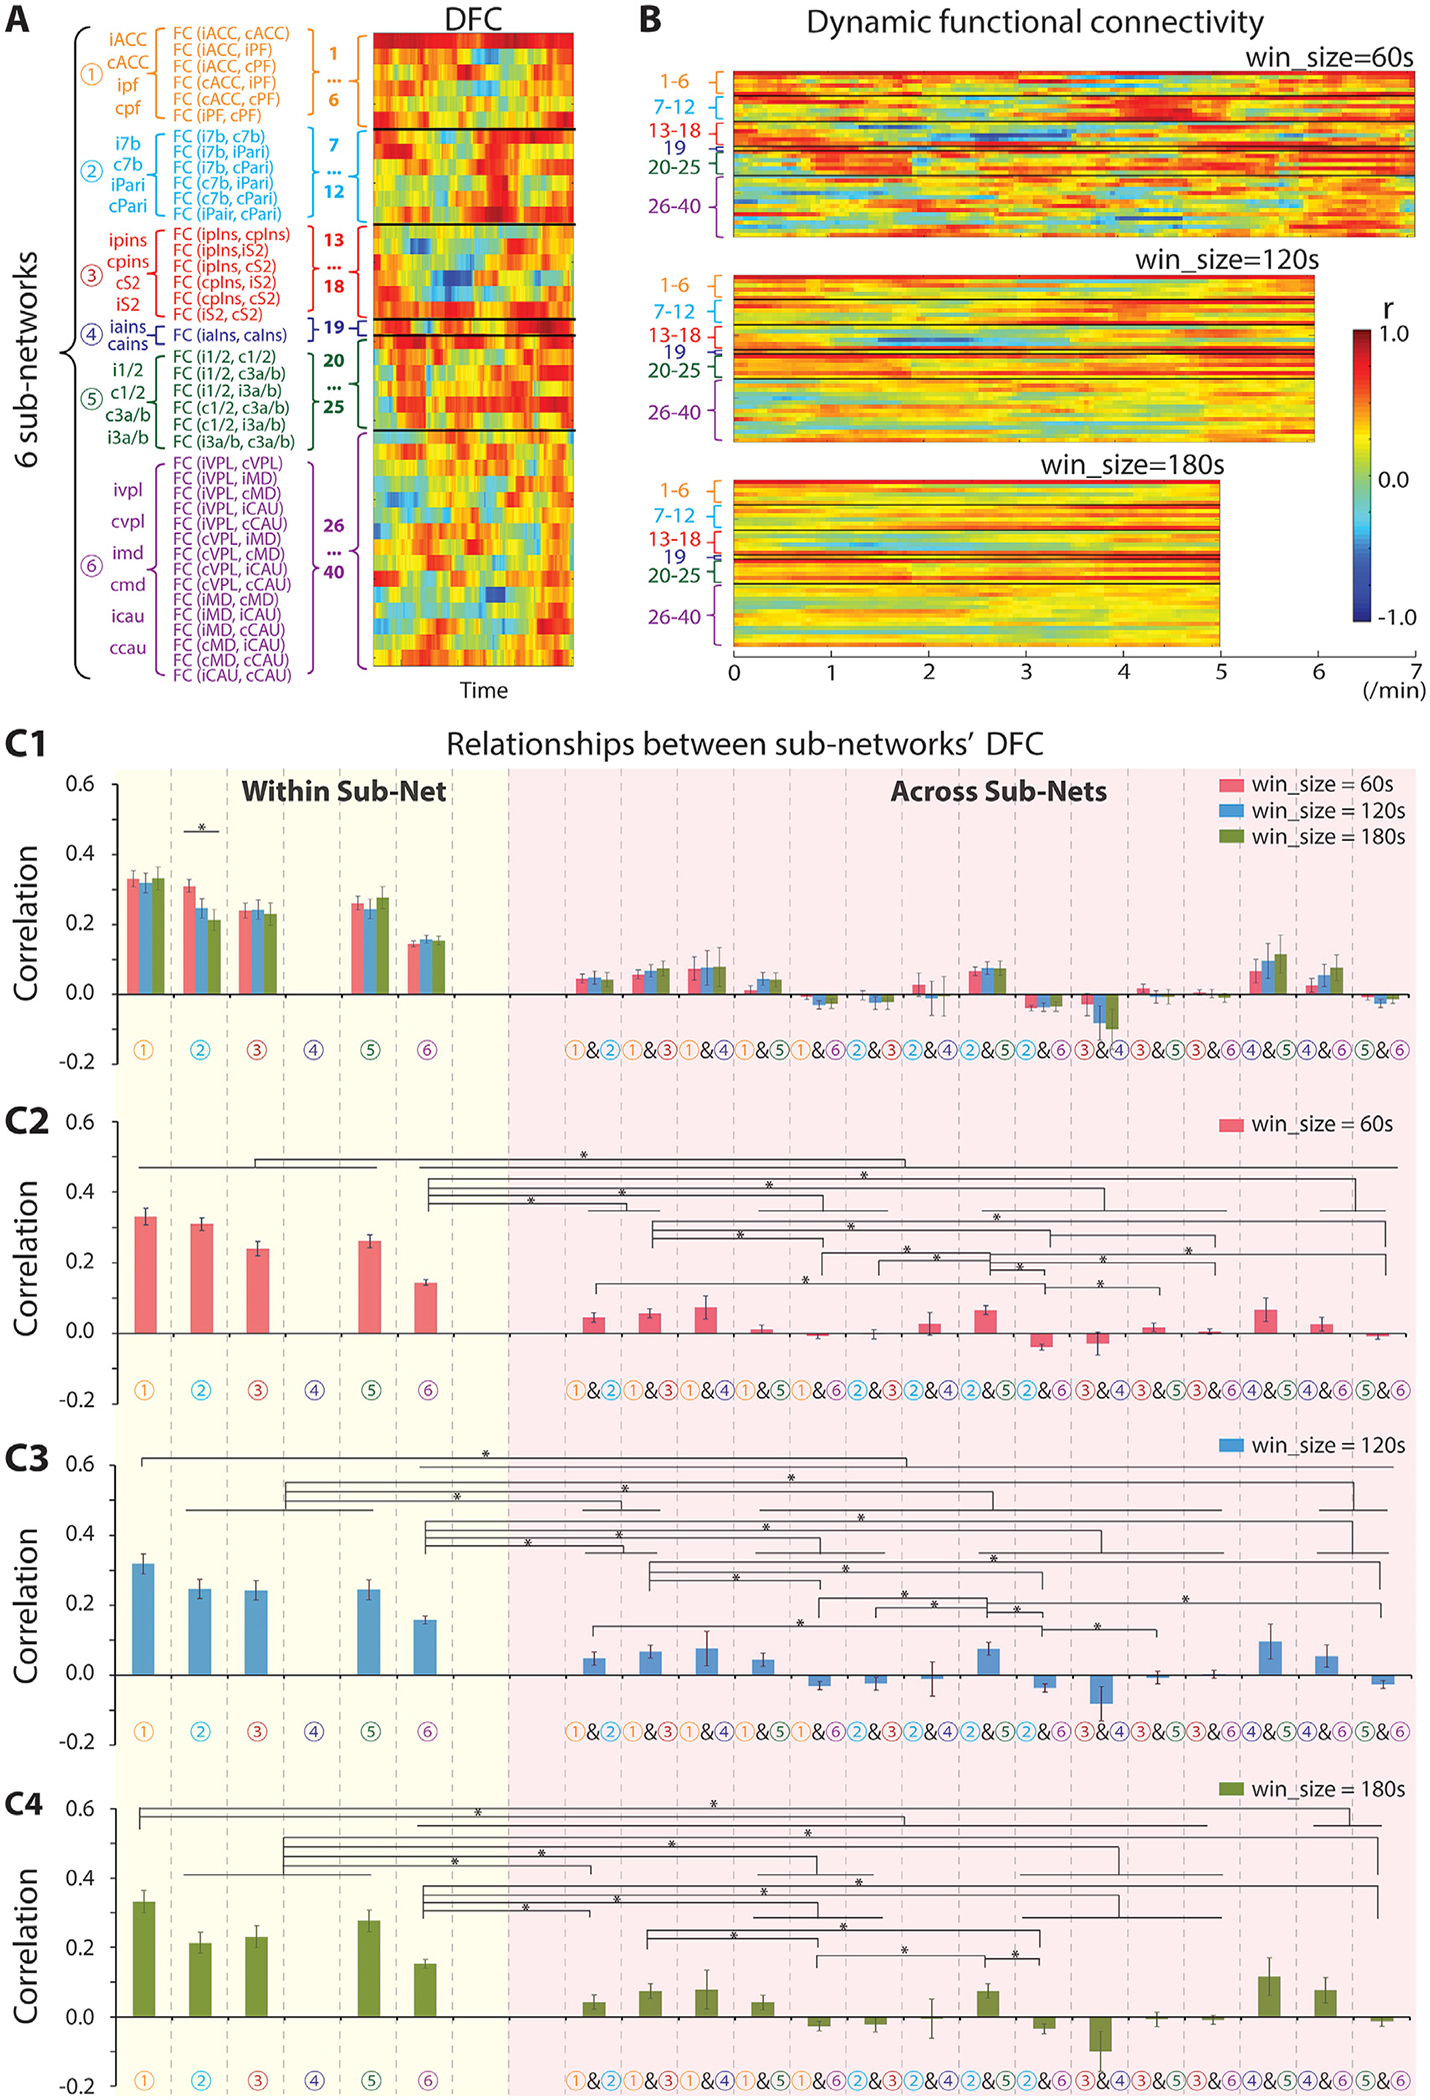
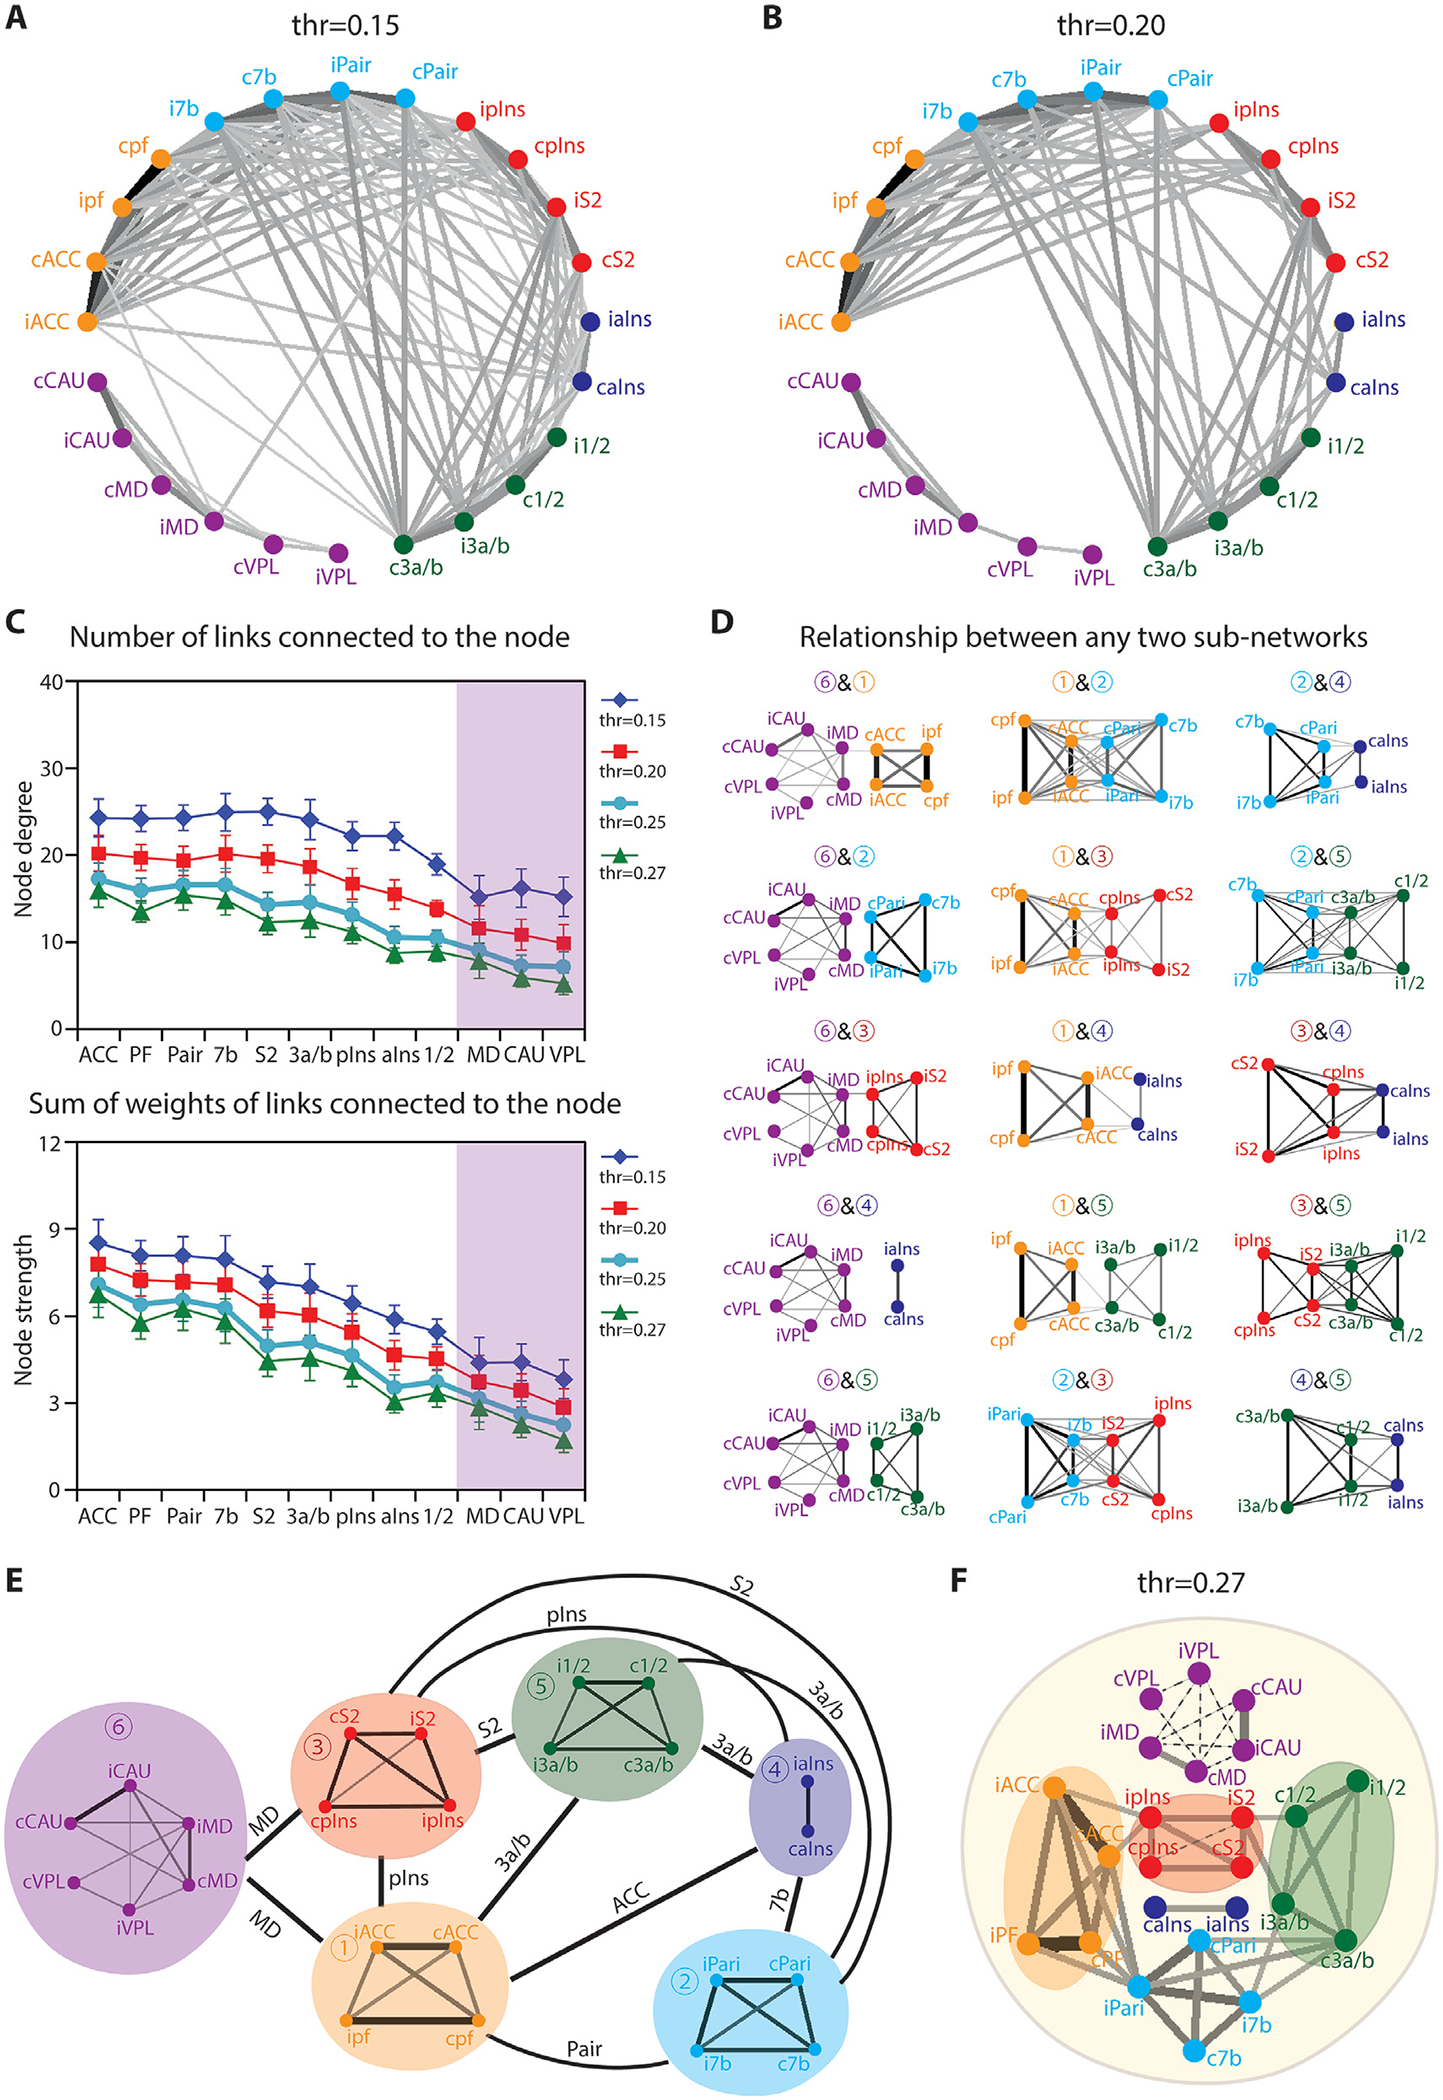
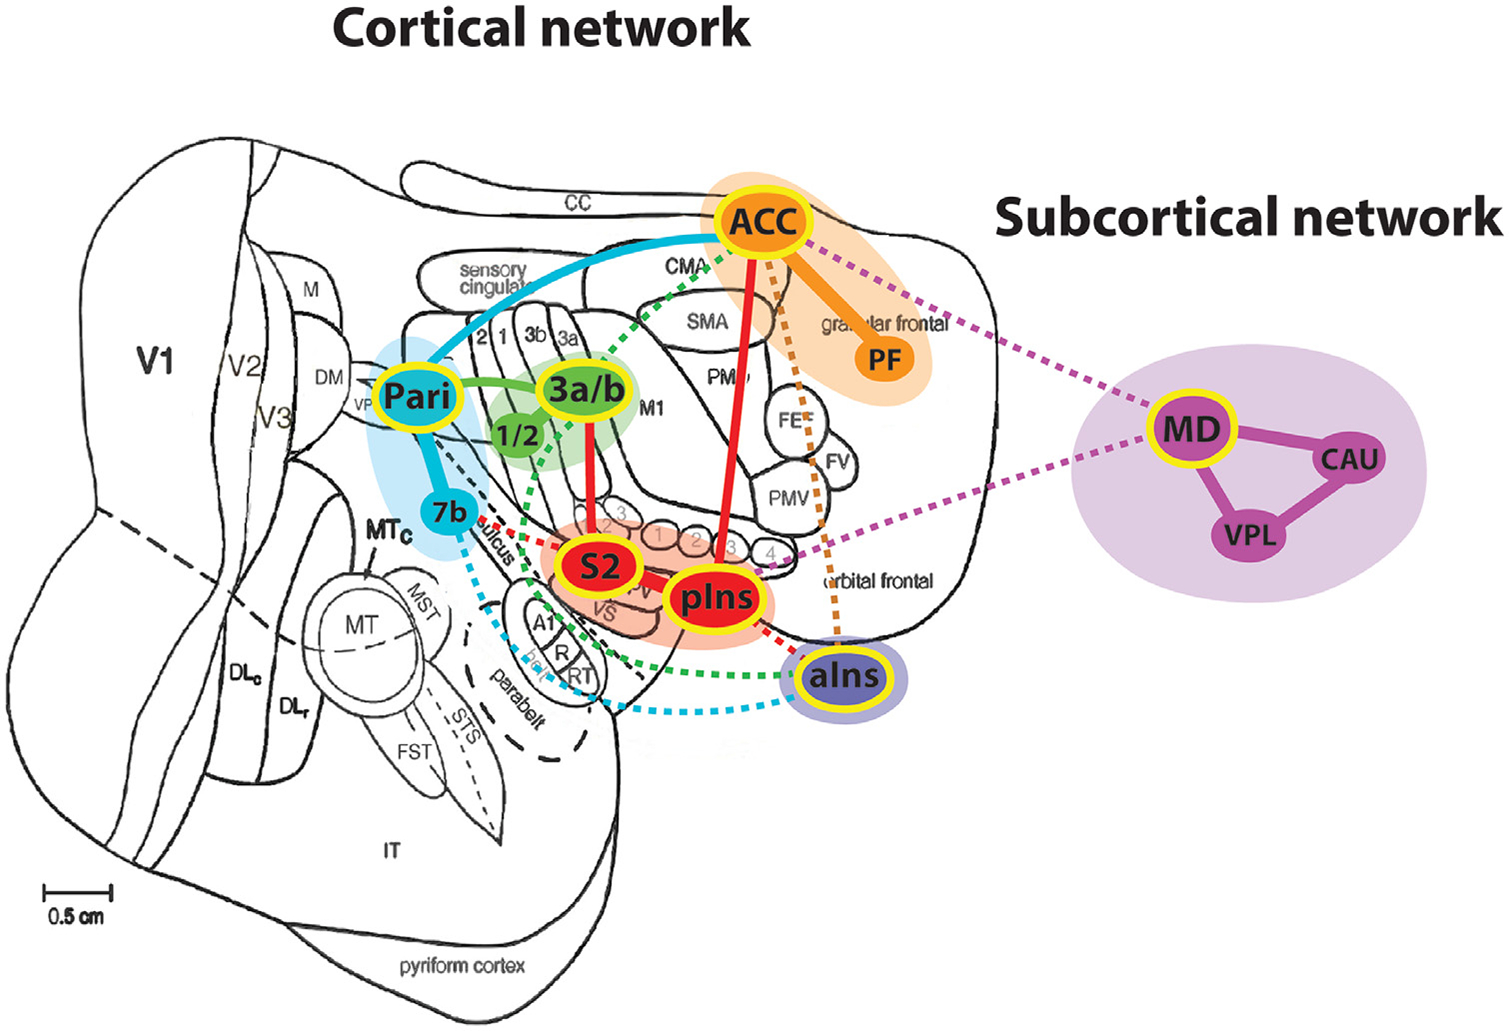
Pain perception involves multiple brain regions and networks. Understanding how these brain networks work together is fundamental for appreciating network-wise changes reported in patients with chronic pain disorders. Parcellating pain related networks and understanding their causal relationships is the first step to understand how painful information is processed, integrated, and modulated, and it requires direct manipulation of specific brain regions. Nonhuman primates (NHP) offer an ideal model system to achieve these goals because cortical and subcortical regions in the NHP brain are established based on a variety of different types of data collected in a way that is not feasible or, at least, extremely difficult in humans (i.e., histology data, tract-tracing, intracerebral recordings). In addition, different methodological techniques can also help characterize and further understand these brain cortical and subcortical regions over the course of development. Here we used a heat nociceptive stimulation that is proven to elicit activity of nociceptive neurons in the cortex to refine and parcellate the whole brain nociceptive functional networks, to identify key network hubs, and to characterize network-wise temporal dynamic signatures using high-resolution fMRI. We first functionally localized 24 cortical and subcortical regions that responded to heat nociceptive stimuli (somatosensory area 1/2, area 3a/3b, S2, posterior insula (pIns), anterior insula, area 7b, posterior parietal cortex, anterior cingulate cortex (ACC), prefrontal cortex, caudate, and mediodorsal (MD) and ventral posterior lateral (VPL) thalamic nuclei) and used them as seeds in resting state fMRI (rsfMRI) data analysis. We applied both hierarchical clustering and graph-theory analyses of the pairwise rsfMRI correlation metrics and identified five cortical and one subcortical sub-networks: strong resting state functional connectivity (rsFC) between ACC and prefrontal regions, parietal cortex and area 7b, S2 and posterior insula, areas 3a/3b and 1/2 within the S1 cortex, and thalamic MD and caudate nuclei. The rsFC strengths between cortical areas within each subnetwork were significantly stronger than those between subcortical regions. Regions within each sub-network also exhibited highly correlated temporal dynamics at rest, but the overall dynamic patterns varied drastically across sub-networks. Graph-theory analysis identified the MD nucleus as a hub that connects subcortical and cortical nociceptive sub-networks. The S2-pIns connection joins the sensory and affective/cognitive sub-networks.

Keywords: Brain network; Graph theory; Non-human primate; Pain; Resting-state functional connectivity; Whole brain.


Conflict of interest statement

Declaration of Competing Interest None.

Figures

Fig. 1.
Fig. 1.
Similarity and spatial correspondence of nociceptive heat-evoked cortical fMRI activation and cortical nociceptive rsFC of ipsilateral S2 in one representative squirrel monkey (SM-H, session 1). (A) Axial images, sampled from top to bottom of the brain, show multi-run fMRI activation to simultaneous 47 °C heat stimulation of the right-hand D2 and D3 distal and middle phalanges (n = 12 runs). Color bar indicates the range of t-values. The S2 seed is outlined by black line on slice 9. Orientations (A: anterior, P: posterior, R: right, L: left) and slice numbers are marked on the images. (B) Multiple run averaged nociceptive iS2-seed based rsFC maps illustrate intrinsic connections of S2 seed among pain-related cortical regions (n = 4 runs). (C) Spatial composite maps (brown) of nociceptive cortical activation (green) and intrinsic functional connectivity maps of the S2 nociceptive region (red). Axial slices represented are 1 mm apart. ACC: anterior cingulate cortex; caIns: contralateral anterior insula; cCAU: contralateral caudate; cMD: contralateral mediodorsal thalamic nucleus; cPari: contralateral posterior parietal cortex; cpIns: contralateral posterior insula; cS2: contralateral secondary somatosensory cortex; cVPL: contralateral ventral posterolateral thalamic nucleus; c1/2: contralateral area 1/2; c3a/b: contralateral area 3a/3b; c7b: contralateral area 7b; iaIns: ipsilateral anterior insula; iPari: ipsilateral posterior parietal cortex; ipIns: ipsilateral posterior insula; iS2: ipsilateral secondary somatosensory cortex; iS2seed: ipsilateral S2 seed; i1/2:ipsilateral area 1/2; i3a/b: ipsilateral area 3a/3b; i7b: ipsilateral area 7b; PF: prefrontal cortex.
Fig. 2.
Fig. 2.
Comparison of nociceptive heat-evoked fMRI activation in subcortical regions and rsFC pattern of nociceptive thalamic nucleus. Results shown for the same representative session as Fig. 1 (session 1 of SM-H). (A1-A3) Heat-evoked subcortical activation maps in the reconstructed (sagittal (A1), axial and coronal (A2-A3) planes with the corresponding squirrel monkey atlas (Gergen and MacLean, 1962, pages 25 and 41) show the subcortical activation locations in caudate (Cau) nucleus (A2) and medial dorsal (MD) and ventral posterolateral (VPL) thalamic nuclei (A3). (B1-B2) Multi-run nociceptive ipsilateral VPL-seed (B1) and ipsilateral MD-seed based subcortical connections at rest in axial and coronal images. VPL and MD seeds are indicated on the heat maps (left of B1 and B2 respectively).
Fig. 3.
Fig. 3.
Functional connectivity relationships among the regions identified in nociceptive activation maps. (A) A 2D matrix plot of the group (n = 14 resting state runs, 4 sessions and 3 monkeys) averaged inter-regional correlation strength (r-value, see color bar for range). (B) Hierarchical cluster tree organization of connectivity strength rankings of all 24 seeds. Six sub-networks are parsed. The y-axis indicates the distance (1-r) used for clustering with a weighted average-linkage algorithm (WPGMA). A total of 14 resting-state fMRI runs from 4 sessions were included in the quantification.
Fig. 4.
Fig. 4.
Temporal dynamic functional connectivity (DFC) features of six nociceptive sub-networks. (A) Scheme of DFC analysis across six sub-networks and a representative DFC example from one run of session 1 of SM-H. (B) Example of a DFC profile of the seed regions with sliding-window sizes of 60 s (top), 120 s (middle), and 180 s (bottom). (C1) DFC relationships within (yellow column) and across sub-networks (pink column). (C2-C4) DFC relationships within (yellow column) and across sub-networks (pink column) with sliding-window size of 60 s (C2), 120 s (C3), and 180 s (C4). The total number of DFC pairs within sub-network 1, 2, 3, or 5 is 210, and that from 6 is 1470. The number of DFC pairs across sub-networks 1 & 2, 1 & 3, 1 & 5, 2 & 3, 2 & 5, or 3 & 5 is 504, across sub-network 1 & 4, 2 & 4, 3 & 4, or 4 & 5 is 84, across sub-network 1 & 6, 2 & 6, 3 & 6, or 5 & 6 is 1260, and across sub-network 4 & 6 is 210. Sidak’s multiple comparisons test, *p < 0.05, Error bars indicate standard error.
Fig. 5.
Fig. 5.
Graph theory analysis of global nociceptive networks. (A-B) Node-node connections of pain related-regions thresholded at r = 0.15 (p < 0.05, A) and r = 0.20 (p < 0.01, B). (C) Node degree (upper) and strength (lower) of pain related-regions at thresholds of r = 0.15 (p < 0.05, blue line), r = 0.20 (p < 0.01, red line), r = 0.25 (p < 0.005, cyan line), and r = 0.27 (p < 0.001, green line). (D) Plots of connectivity strengths between any pairs of sub-network at the threshold of r = 0.15 (p < 0.05). (E) Schematic summary of the relationships among the six pain sub-networks. (F) Relationship among sub-networks at the threshold of r = 0.27 (p < 0.001).
Fig. 6.
Fig. 6.
Schematic illustration of nociceptive networks identified in the squirrel monkey brain. Modified from Kaas and Collins (2001). Regions with yellow outline indicate the subnetwork hubs. Dotted lines indicate weaker connections. Each color represents one subnetwork. ACC: anterior cingulate cortex; aIns: anterior insula; CAU: caudate; MD: mediodorsal thalamic nucleus; Pari: posterior parietal cortex; PF: prefrontal cortex; pIns: posterior insula; S2: secondary somatosensory cortex; VPL: ventral posterolateral thalamic nucleus; 1/2: area 1/2; 3a/b: area 3a/3b; 7b: area 7b.

References

    1. Apkarian AV, Baliki MN, Farmer MA, 2013. Predicting transition to chronic pain. Curr. Opin. Neurol. 26, 360–367. - PMC - PubMed
    1. Apkarian AV, Bushnell MC, Treede RD, Zubieta JK, 2005. Human brain mechanisms of pain perception and regulation in health and disease. Eur. J. Pain 9, 463–484. - PubMed
    1. Baliki MN, Geha PY, Apkarian AV, Chialvo DR, 2008. Beyond feeling: chronic pain hurts the brain, disrupting the default-mode network dynamics. J. Neurosci. 28, 1398–1403. - PMC - PubMed
    1. Chen LM, Dillenburger BC, Wang F, Friedman RM, Avison MJ, 2011. High-resolution functional magnetic resonance imaging mapping of noxious heat and tactile activations along the central sulcus in new world monkeys. Pain 152, 522–532. - PMC - PubMed
    1. Chen LM, Dillenburger BC, Wang F, Tang CH, 2012. Differential fMRI activation to noxious heat and tactile stimuli in parasylvian areas of new world monkeys. Pain 153, 158–169. - PMC - PubMed

Publication types