. 2022 Aug;33(8):824-835.
doi: 10.1016/j.annonc.2022.04.450. Epub 2022 May 6.

Deciphering radiological stable disease to immune checkpoint inhibitors

Affiliations

Deciphering radiological stable disease to immune checkpoint inhibitors

J Luo et al. Ann Oncol. 2022 Aug.

Abstract

Background: 'Stable disease (SD)' as per RECIST is a common but ambiguous outcome in patients receiving immune checkpoint inhibitors (ICIs). This study aimed to characterize SD and identify the subset of patients with SD who are benefiting from treatment. Understanding SD would facilitate drug development and improve precision in correlative research.

Patients and methods: A systematic review was carried out to characterize SD in ICI trials. SD and objective response were compared to proliferation index using The Cancer Genome Atlas gene expression data. To identify a subgroup of SD with outcomes mirroring responders, we examined a discovery cohort of non-small-cell lung cancer (NSCLC). Serial cutpoints of two variables, % best overall response and progression-free survival (PFS), were tested to define a subgroup of patients with SD with similar survival as responders. Results were then tested in external validation cohorts.

Results: Among trials of ICIs (59 studies, 14 280 patients), SD ranged from 16% to 42% in different tumor types and was associated with disease-specific proliferation index (ρ = -0.75, P = 0.03), a proxy of tumor kinetics, rather than relative response to ICIs. In a discovery cohort of NSCLC [1220 patients, 313 (26%) with SD to ICIs], PFS ranged widely in SD (0.2-49 months, median 4.9 months). The subset with PFS >6 months and no tumor growth mirrored partial response (PR) minor (overall survival hazard ratio 1.0) and was proposed as the definition of SD responder. This definition was confirmed in two validation cohorts from trials of NSCLC treated with durvalumab and found to apply in tumor types treated with immunotherapy in which depth and duration of benefit were correlated.

Conclusions: RECIST-defined SD to immunotherapy is common, heterogeneous, and may largely reflect tumor growth rate rather than ICI response. In patients with NSCLC and SD to ICIs, PFS >6 months and no tumor growth may be considered 'SD responders'. This definition may improve the efficiency of and insight derivable from clinical and translational research.

Keywords: RECIST; immunotherapy/checkpoint blockade; lung cancer.


Conflict of interest statement

Disclosure JL has received honoraria from Targeted Oncology and Physicians’ Education Resource. SW and QZ are former employees of AstraZeneca. MKC receives institutional research funding from Bristol-Myers Squibb; and has received personal fees from Merck, InCyte, Moderna, ImmunoCore, and AstraZeneca. ANS reports advisory board positions with Bristol-Myers Squibb, Immunocore, Novartis, and Castle Biosciences; and institutional research support from BMS, Immunocore, Xcovery, Polaris, Novartis, Pfizer, Checkmate Pharmaceuticals, and Foghorn Therapeutics. MAP reports consulting fees from Bristol-Myers Squibb, Merck, Array BioPharma, Novartis, Incyte, NewLink Genetics, Pfizer, and Aduro; honoraria from BMS and Merck; and institutional research support from Rgenix, Infinity, BMS, Merck, Array BioPharma, Novartis, and AstraZeneca. MHV reports receiving commercial research support from Bristol-Myers Squibb, Pfizer, and Genentech/Roche; honoraria from Novartis and Bristol-Myers Squibb; travel/accommodation from Astra Zeneca, Eisai, Novartis, and Takeda; and consultant/advisory board member for Aveo, Calithera Biosciences, Corvus Pharmaceuticals, Exelixis, Eisai, Merck, Onquality Pharmaceuticals, Novartis, and Pfizer. MSG has been a compensated consultant for Ultimate Opinions in Medicine LLC and MORE Health, Inc. AG and RR are employees of AstraZeneca. RR has a patent pending related to tumor mutation burden. MGK receives personal fees from AstraZeneca, Pfizer, Regeneron, and Daiichi-Sankyo; received honoraria for participation in educational programs from WebMD, OncLive, Physicians Education Resources, Prime Oncology, Intellisphere, Creative Educational Concepts, Peerview, i3 Health, Paradigm Medical Communications, AXIS, Carvive Systems, AstraZeneca, and Research to Practice; and received travel support from AstraZeneca, Pfizer, Regeneron, and Genentech; is an employee of Memorial Sloan Kettering. Memorial Sloan Kettering has received research funding from The National Cancer Institute (USA), The Lung Cancer Research Foundation, Genentech/Roche, and PUMA Biotechnology for research conducted by MGK. MSK has licensed testing for EGFR T790M to MolecularMD. MDH, as of November 2021, is an employee of AstraZeneca; has received personal fees from Achilles, Adagene, Adicet, Arcus, Blueprint Medicines, Bristol-Myers Squibb, DaVolterra, Eli Lilly, Genentech/Roche, Genzyme/Sanofi, Janssen, Immunai, Instil Bio, Mana Therapeutics, Merck, Mirati, Natera, Pact Pharma, Shattuck Labs, and Regeneron; has options from Factorial, Shattuck Labs, Immunai, and Arcus; and has a patent filed by Memorial Sloan Kettering related to the use of tumor mutation burden to predict response to immunotherapy (PCT/US2015/062208), which has received licensing fees from PGDx. All other authors have declared no conflicts of interest.

Figures
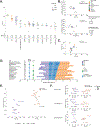
Figure 1.
Figure 1.. Stable disease (SD) in patients receiving immune checkpoint inhibitors (ICIs)
A. Percentage of patients with SD as their RECIST v1.1 best overall response (BOR) at the trial level by solid tumor type in the published literature. Non-small cell lung cancer (NSCLC) has the greatest number of patients (n=4,264) and one of the highest %SD (31%). Each bubble represents one arm from a phase I-III clinical trial of ICIs (PD-[L]1 monotherapy or in combination with CTLA-4 therapy). The area of the bubble is proportional to the number of patients enrolled in the study arm. Horizontal bars represent the weighted median %SD for that tumor type. Horizontal jitter within each column was introduced to better visualize differences among bubbles. The denominator for calculating %SD was the number of patients who received at least one dose of therapy. Exclusion criteria: tumor types with fewer than 100 total patients treated with therapy, trials where the number of patients who were not evaluable for RECIST BOR was either unknown or not clearly stated, and trials without published manuscripts. Search performed: August 8, 2020. Abbreviations: HCC = hepatocellular carcinoma; RCC = renal cell cancer; NSCLC = non-small cell lung cancer; dMMR = mismatch repair deficiency; HNSCC=head and neck squamous cell cancer; UCC = urothelial cell carcinoma; SCLC = small cell lung cancer, *Cervical includes cervical, vulvar, and vaginal cancer. B and C. Best overall response of the tumor types from phase I-III clinical trials of ICIs compared to proliferative index (PI), a commonly used signature calculated from RNA-seq data from TCGA tumors reflective of tumor kinetics. Among comparisons made between SD, PR/CR, and PI, only SD significantly associates with PI (ρ = −0.75, p=0.03). The area of the bubble is proportional to the number of patients enrolled in trials investigating the tumor type. The shading of the bubble is proportional to the number of TCGA tumors used to calculate mean PI. ^cpm = counts per million was used to normalize PI, *Cervical includes cervical, vulvar, and vaginal cancer D. Trials of patients with NSCLC from 1A ordered by %SD. %SD ranged from 22–39%. Abbreviations: TPS = PD-L1 expression by tumor proportion score, TC = PD-L1 expression on tumor cells, PR = partial response, SD = stable disease, PD = progressive disease E. %SD compared to either %PR/CR (purple) or %PD (orange) in PD-L1 expression unselected trials in patients with NSCLC. Lines are weighted linear least squares fit. F. %SD compared to either %PR/CR (purple) or %PD (orange) in 3 trials that had BOR data grouped by PD-L1 expression Keynote 042 (top), CheckMate 227 (middle), CheckMate 568 (bottom). Lines show weighted linear least squares fit.
Figure 2.
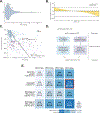
Figure 2.. SD is heterogenous and objective response criteria may identify SD responders
A. Violin showing distribution of progression free survival in 313 patients with BOR SD seen at MSK. PFS ranged from 0.2–49 months (median 4.9 months, interquartile range 3.4–8.6 months). Vertical dashed lines and percentages represent the median and interquartile range B. Distribution of patients with SD by best % change of the sum of target lesions per RECIST v1.1 (% best overall response, [%BOR]). %BOR ranged from −30 to +20% (median −2%, 2% shrinkage). C. PFS vs %BOR in patients with SD (n=313) (blue) and PR/CR (n=235) (purple). Each circle represents one patient. Stratifying the PR/CR group by the median (57% shrinkage), the darker purple circles represent the PR group (PR-minor) that is most similar in objective response to SD. Lines are linear least squares fit of SD and PR/CR. D. Flow diagram outlining approach to identifying responders in SD. We used serial cutpoints of %BOR and PFS as candidate definitions of SD responder. Each proposed definition was compared to the PR minor group by calculating log-rank hazard ratios (HR) for overall survival. Supplementary Figure 1 is an illustrated schema of the methods in greater detail. E. Matrix of PFS (horizontal) and %BOR (vertical) cutpoints used as candidate definitions of SD responder and resulting HRs when compared to PR minor. A PFS of > 6 months and no tumor growth defined the population of SD responder most similar to PR. The heatmap is shaded by HR using an inverse linear scale.
Figure 3.
Figure 3.. SD responders among patients who received ICIs
For each figure in this series, the donut (left) represents the % of patients in each response category and the Kaplan Meier (right) shows estimated overall survival of SD-responder compared to the subset of PR/CR most similar to SD, PR minor (PR and shrinkage of less than the median within PR/CR). The wedge within the donut is the % of patients who met our definition of SD responder (a PFS of > 6 months and no tumor growth). The three cohorts were A. the MSK discovery cohort (n=1220), B. the external validation cohort of patients with NSCLC who received ICIs in study CP1108 (n=326), and C. the external validation cohort of patients with NSCLC who received ICIs in study C006 (n=381). PR major = PR and shrinkage of at least the median within PR/CR.
Figure 4.
Figure 4.. SD responders among patients who received ICIs in multiple solid tumor types
For each figure in this series, the line (top) represents linear least squares fit and bootstrapped 95% CI for %BOR vs PFS for PR/CR. Also see Supplementary Figure 3. Kaplan-Meier estimated overall survival curves show SD-R vs PR-minor (middle) and SD-R vs non-SD-R (bottom). The cohorts include A. melanoma (MSK, n=99; SD-R vs PR-min HR=2.07, 95% CI 0.47–9.09, SD-R vs non-SD-R HR=0.26, 95% CI 0.10–0.71), bladder cancer (Danube study, durvalumab+/−tremelimumab, n=708, SD-R vs PR-min HR=1.49, 95% CI 1.03–2.15, SD-R vs non-SD-R HR=0.39, 95% CI 0.26–0.59), B. HNSCC (Eagle study, durvalumab+/−tremelimumab, n=487, SD-R vs PR-min HR=2.94, 95% CI 1.49–5.82, SD-R vs non-SD-R HR=0.44, 95% CI 0.29–0.66). ρ denotes the spearman rank correlation coefficient of PR/CR %BOR vs PFS. Hazard ratios (HR) and 95% confidence intervals (CIs) were calculated using the log-rank test.

References

    1. Moertel CG, Hanley JA. The effect of measuring error on the results of therapeutic trials in advanced cancer. Cancer 1976; 38 (1): 388–394. - PubMed
    1. World Health O. WHO handbook for reporting results of cancer treatment. Geneva: World Health Organization; 1979.
    1. Therasse P, Arbuck SG, Eisenhauer EA et al. New Guidelines to Evaluate the Response to Treatment in Solid Tumors. JNCI: Journal of the National Cancer Institute 2000; 92 (3): 205–216. - PubMed
    1. Eisenhauer EA, Therasse P, Bogaerts J et al. New response evaluation criteria in solid tumours: revised RECIST guideline (version 1.1). Eur J Cancer 2009; 45 (2): 228–247. - PubMed
    1. Hellmann MD, Nathanson T, Rizvi H et al. Genomic Features of Response to Combination Immunotherapy in Patients with Advanced Non-Small-Cell Lung Cancer. Cancer Cell 2018; 33 (5): 843–852 e844. - PMC - PubMed

Publication types

MeSH terms

Substances