. 2022;14(2):465-493.
doi: 10.1016/j.jcmgh.2022.04.013. Epub 2022 May 6.

Transcriptional Integration of Distinct Microbial and Nutritional Signals by the Small Intestinal Epithelium

Affiliations

Transcriptional Integration of Distinct Microbial and Nutritional Signals by the Small Intestinal Epithelium

Colin R Lickwar et al. Cell Mol Gastroenterol Hepatol. 2022.

Abstract

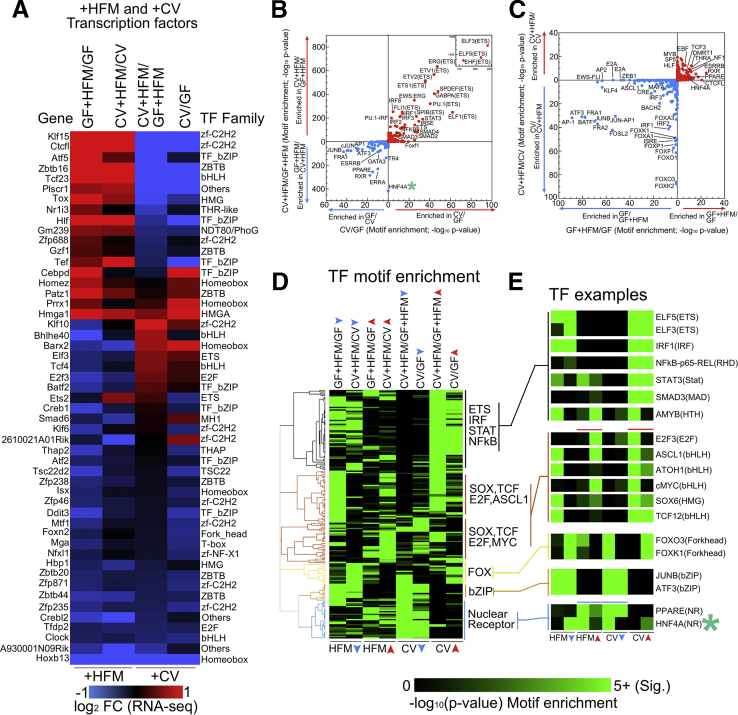
Background & aims: The intestine constantly interprets and adapts to complex combinations of dietary and microbial stimuli. However, the transcriptional strategies by which the intestinal epithelium integrates these coincident sources of information remain unresolved. We recently found that microbiota colonization suppresses epithelial activity of hepatocyte nuclear factor 4 nuclear receptor transcription factors, but their integrative regulation was unknown.

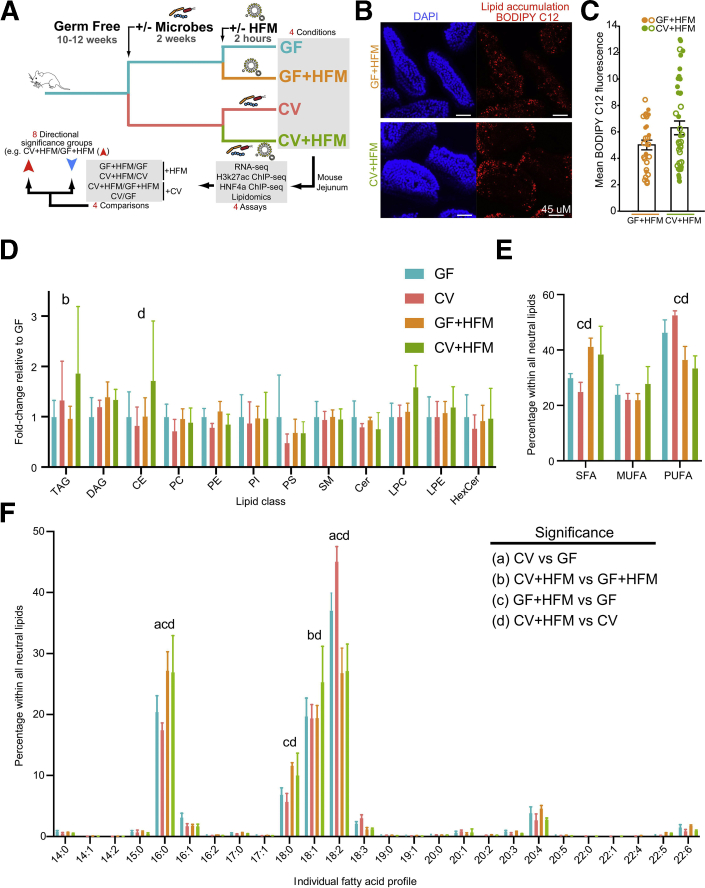
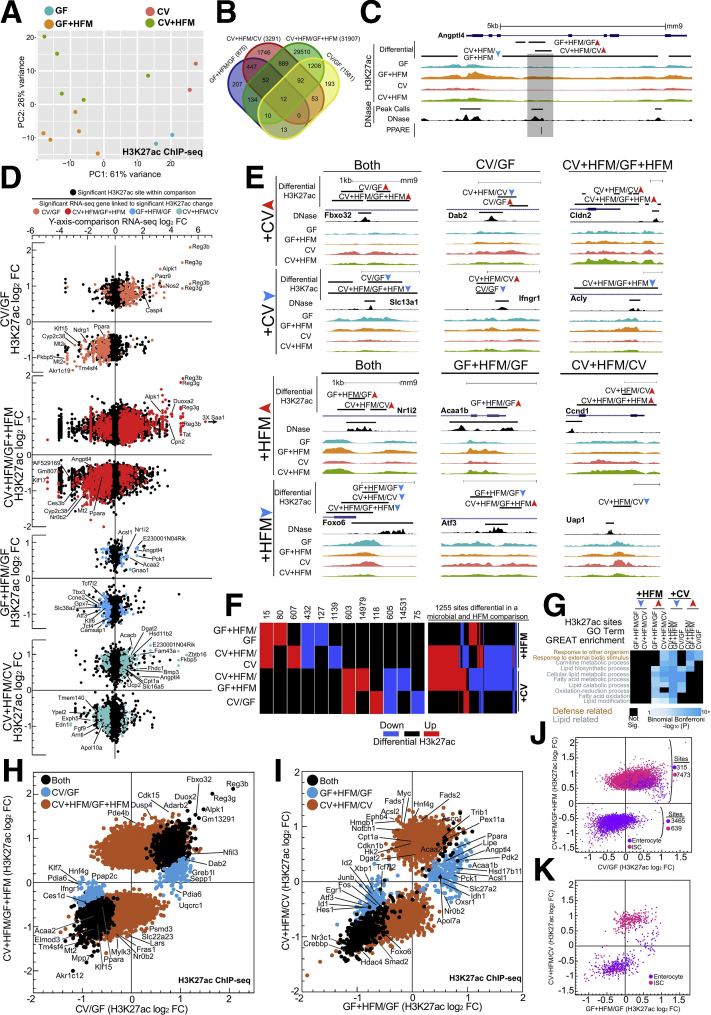
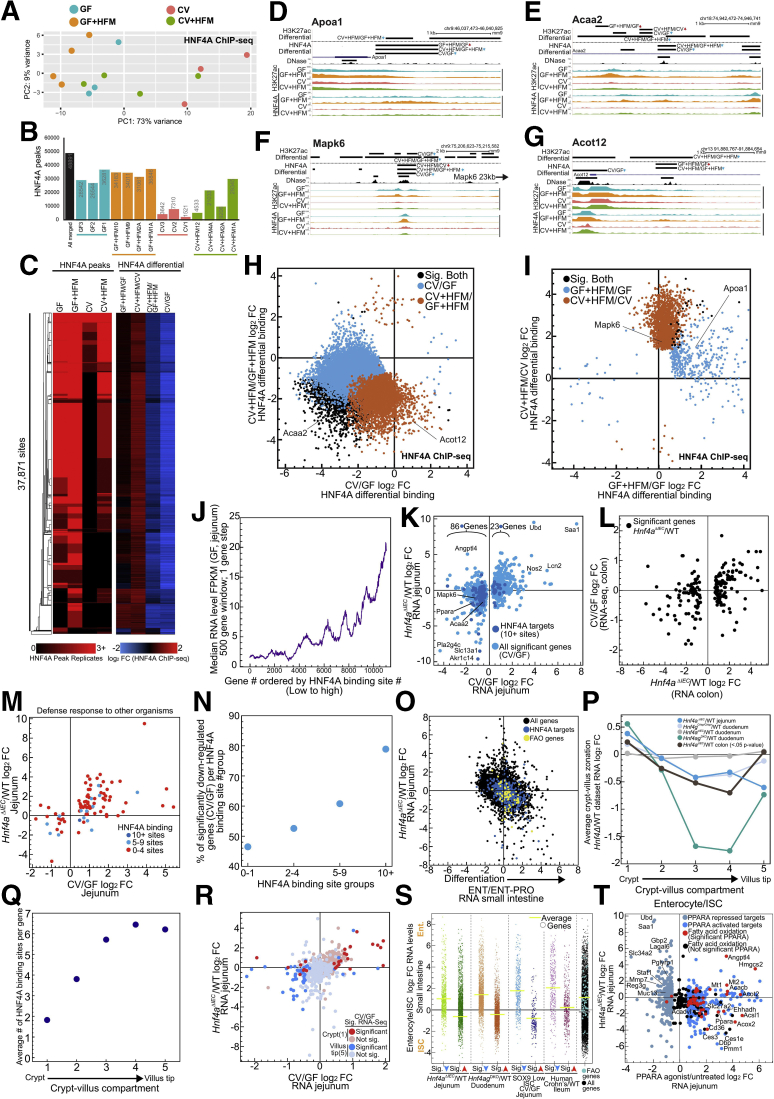
Methods: We compared adult mice reared germ-free or conventionalized with a microbiota either fed normally or after a single high-fat meal. Preparations of unsorted jejunal intestinal epithelial cells were queried using lipidomics and genome-wide assays for RNA sequencing and ChIP sequencing for the activating histone mark H3K27ac and hepatocyte nuclear factor 4 alpha.

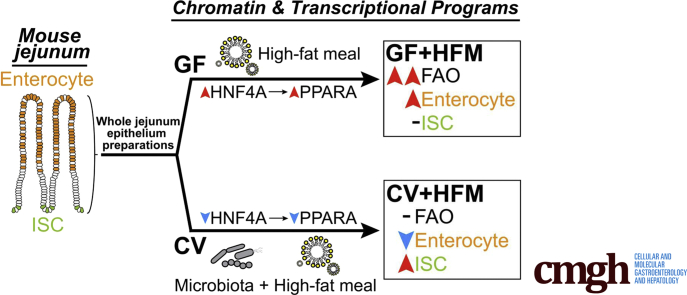
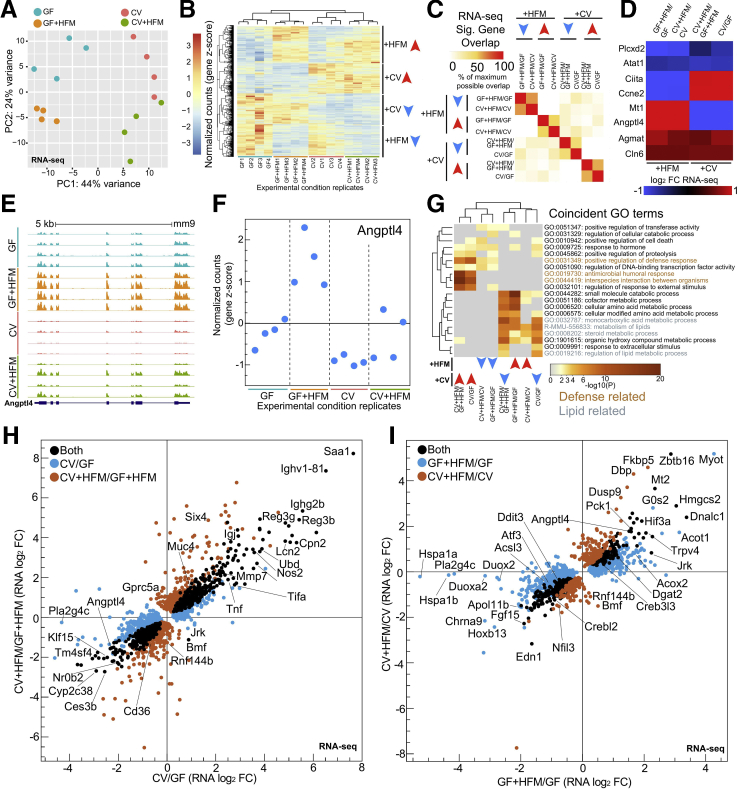
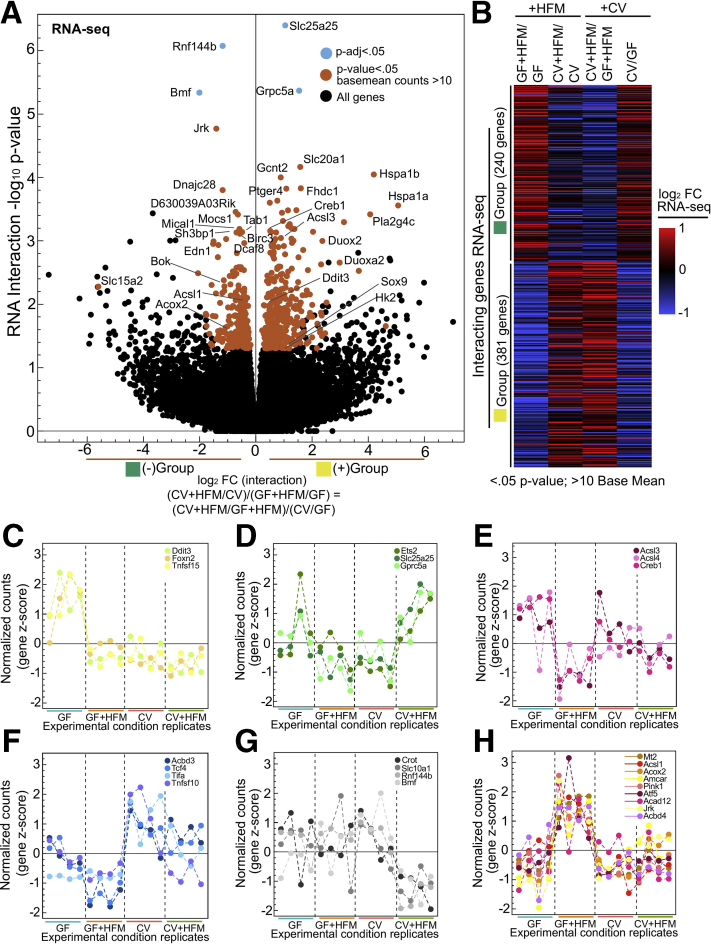
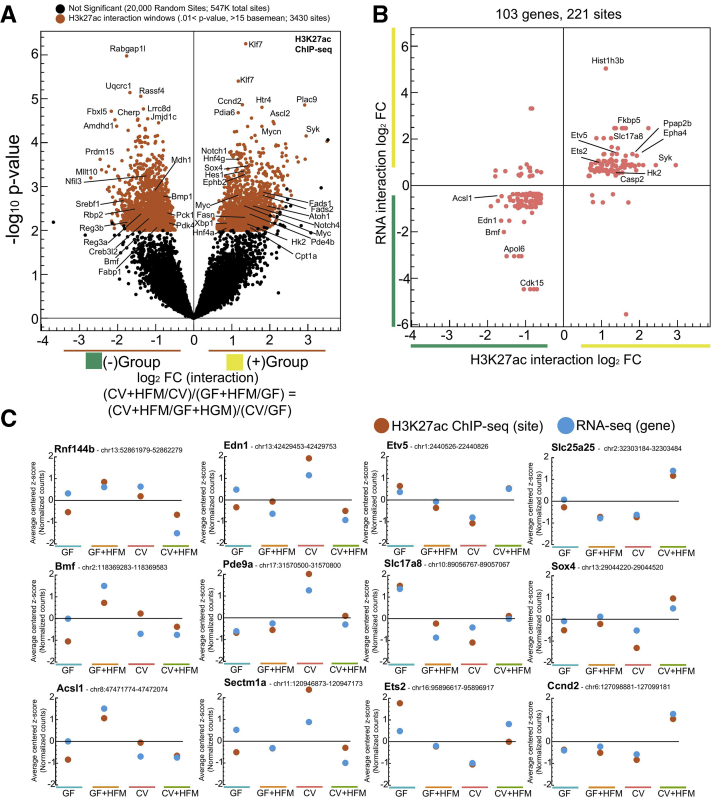
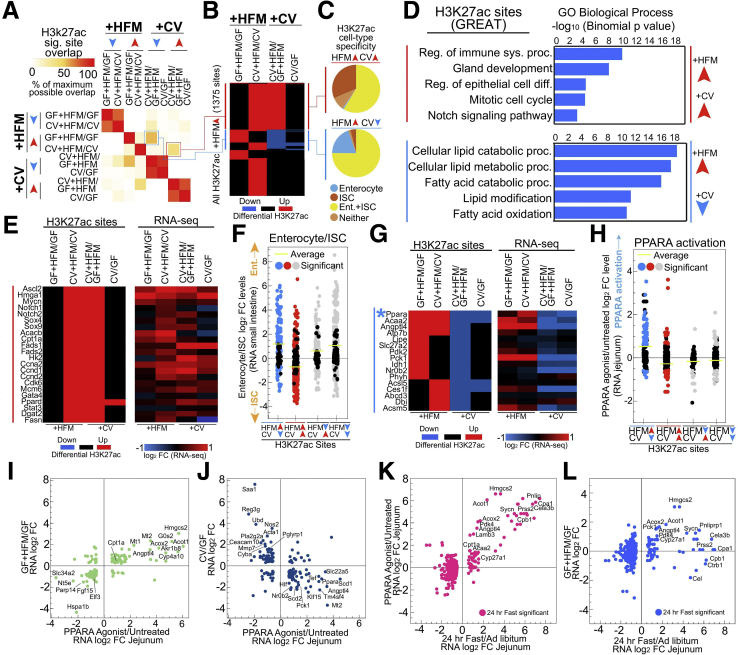
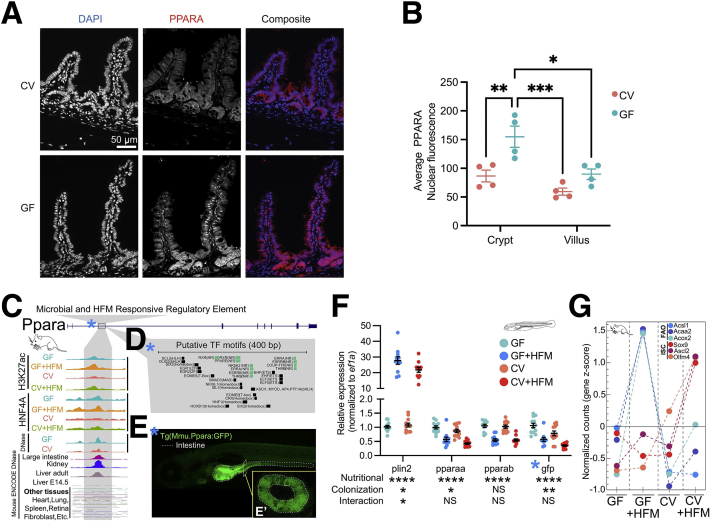
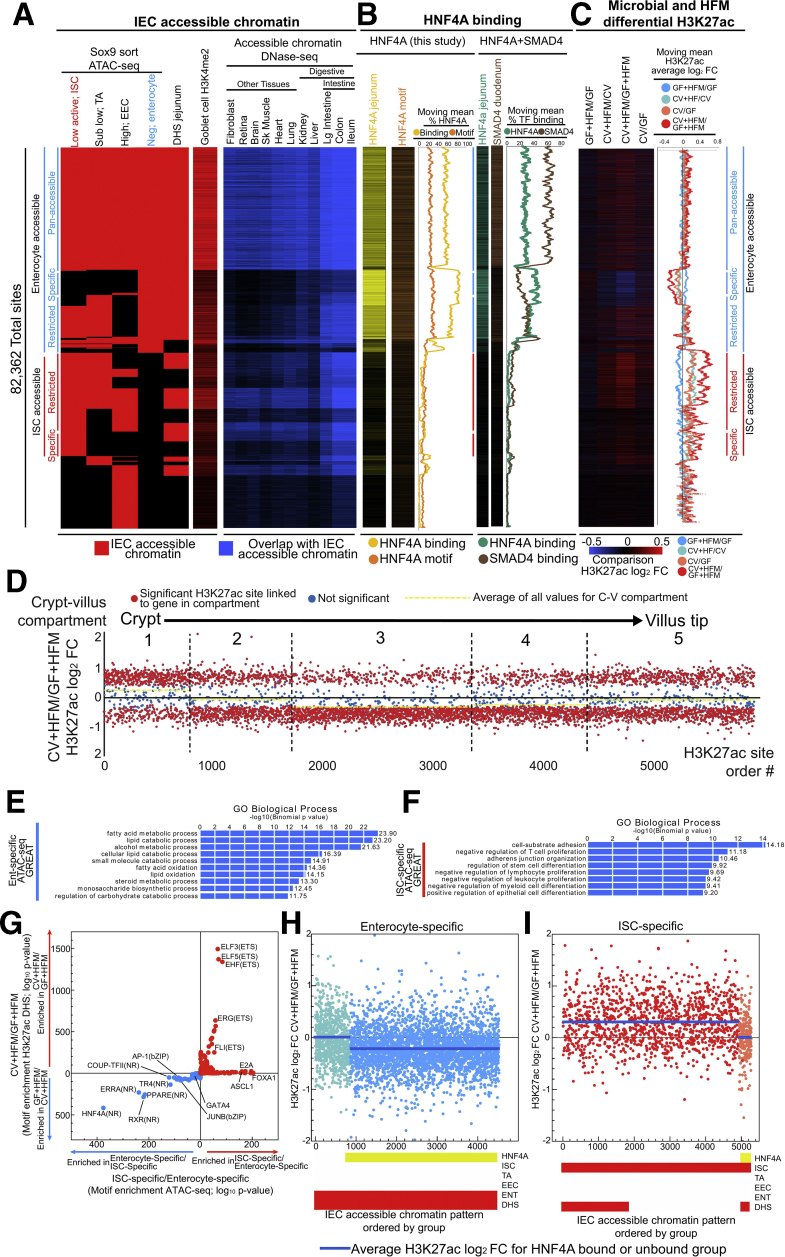
Results: Analysis of lipid classes, genes, and regulatory regions identified distinct nutritional and microbial responses but also simultaneous influence of both stimuli. H3K27ac sites preferentially increased by high-fat meal in the presence of microbes neighbor lipid anabolism and proliferation genes, were previously identified intestinal stem cell regulatory regions, and were not hepatocyte nuclear factor 4 alpha targets. In contrast, H3K27ac sites preferentially increased by high-fat meal in the absence of microbes neighbor targets of the energy homeostasis regulator peroxisome proliferator activated receptor alpha, neighbored fatty acid oxidation genes, were previously identified enterocyte regulatory regions, and were hepatocyte factor 4 alpha bound.

Conclusions: Hepatocyte factor 4 alpha supports a differentiated enterocyte and fatty acid oxidation program in germ-free mice, and that suppression of hepatocyte factor 4 alpha by the combination of microbes and high-fat meal may result in preferential activation of intestinal epithelial cell proliferation programs. This identifies potential transcriptional mechanisms for intestinal adaptation to multiple signals and how microbiota may modulate intestinal lipid absorption, epithelial cell renewal, and systemic energy balance.

Keywords: Chromatin; Intestine; Lipid Metabolism; Microbiome.


Figures

None
Graphical abstract
Figure 1
Figure 1
Impact of HFM and microbes on the mouse intestine. (A) Experimental schematic highlighting microbial and nutritional conditions, genomic assays, and analysis. (B) Confocal en face images of jejunal villi 2 hours after gavage with egg yolk labeled with BODIPY C12 (red) with nuclei labeled with DAPI (blue). (C) Quantification of mean BODIPY C12 fluorescence per villus. Data points represent individual villi (27 GF+HFM villi, 42 CV+HFM villi), with open and closed circles representing villi from 2 biological replicate mice per condition. Averages and standard deviations of villi measurements are shown. Student t test showed significant differences when comparing across villi (P = .023) but not mice (P = .304). (D) Relative abundance of major lipid classes in each sample type including neutral lipids (triacylglyceride [TAG]), diacylglyceride [DAG], cholesteryl ester [CE]), phospholipids (phosphatidylcholine [PC], phosphatidylethanolamine [PE], phosphatidylinositol [PI], phosphatidylserine [PS]), and polar lipids (sphingomyelin [SM], ceramide [Cer], lysophosphatidylcholine [LPC], lysophosphatidylethanolamine [LPE], hexosylceramides [HexCer]). All measurements were normalized to internal standards and are shown as fold change relative to GF. Two-way ANOVA revealed there was not a statistically significant interaction between treatment and lipid class (F33,144 = 0.8728, P = .6672). Simple main effects analysis showed that treatment did have a statistically significant effect on lipid class abundance (P = .0367). (E) Percentage of FAs detected across all neutral lipid classes (TAG, DAG, and CE) that are saturated FAs (SFA), monounsaturated FAs (MUFA), and polyunsaturated FAs (PUFA). Two-way ANOVA revealed there was a statistically significant interaction between treatment and FA saturation group (F6,36 = 13.93, P < .0001). Simple main effects analysis showed that treatment did not have a statistically significant effect on lipid class abundance (P > .9999). (F) Percentage of FAs detected across all neutral lipid classes (TAG, DAG, and CE) with the corresponding chain length and saturation. Two-way ANOVA revealed there was a statistically significant interaction between treatment and FA type (F75,312 = 10.98, P < .0001). Simple main effects analysis showed that treatment did not have a statistically significant effect on FA abundance (P > .9999). For the data shown in (D-F), significant differences (P < .05) by post hoc Tukey multiple comparisons tests are noted for (a) GF vs CV, (b) GF+HFM vs CV+HFM, (c) GF vs GF+HFM, and (d) CV vs CV+HFM. Data are shown as average and standard deviation of 4 mice per condition. See also Supplementary Table 1.
Figure 2
Figure 2
Impact of HFM and microbes on gene transcription in the mammalian intestine. (A) DESeq2 PCA of RNA-seq normalized counts in each replicate for the 4 conditions, with 4 mice per condition. Adonis permutational multivariate ANOVA of RNA-seq distance matrix; microbes: P = .002, R2 = 0.240; meal: P = .005, R2 = 0.169. (B) Heatmap of row z-scored normalized counts for genes significantly differential in at least one comparison by RNA-seq (P adjusted < .05). Examples of blocks of commonly behaving genes are marked for +HFM and +CV directional groups. (C) Pairwise comparison of maximum overlap of coincident significant RNA-seq genes (P adjusted <.05) for 8 directional significance groups shows generally coincident directionality and genes for +CV and +HFM comparisons. (D) Heatmap of example genes significantly different in both a +CV and +HFM comparison (P adjusted <.05). (E) UCSC screenshot for RNA-seq replicate levels at the mouse Angptl4 locus. (F) RNA-seq z-scored normalized counts of Angptl4, which are significant in both +CV and +HFM comparisons, show amplified relative expression in the GF+HFM condition. (G) Clustered heatmap of significance values for shared GO terms in at least 2 of 8 directional RNA-seq significance groups. (H) Scatterplot of significantly different gene log2 fold change for CV/GF and CV+HFM/GF+HFM RNA-seq (P adjusted <.05). (I) Same as (H) for GF+HFM/GF and CV+HFM/CV (P adjusted <.05).
Figure 3
Figure 3
Characterizing putative transcriptional interaction genes. (A) Volcano plot showing interaction log2 fold change versus –log10P value for typical (P adjusted <.05; blue) and lenient (P value <.05, >10 base mean counts; red) cutoffs identifies genes with greatest potential for interaction. In effect, the interaction log2 fold change represents the log2 ratio of (CV+HFM/CV)/(GF+HFM/GF) or (CV+HFM/GF+HFM)/(CV/GF), which are equivalent because these comparisons contain the same 4 conditions. Because negative (–, green) and positive (+, yellow) interactions are representative of the directionality of the fold change but not necessarily the nature of the interactions, these groups are also colored to help illustrate that property. (B) Heatmap of log2 FC for each comparison for interaction genes broken into the green and yellow groups. (C–H) RNA-seq z-scored normalized counts for example interacting genes, with each panel showing a different expression pattern.
Figure 4
Figure 4
Identification of nutritional and microbial regulatory regions in the mammalian intestine. (A) DESeq2 PCA of H3K27ac ChIP-seq normalized counts for all replicates for each condition. Replicates represent individual mice: CV = 2, CV+HFM = 5, GF = 2, and GF+HFM = 5. Adonis permutational multivariate ANOVA of H3K27ac distance matrix; microbes: P = .002, R2 = 0.234; meal: P = .102, R2 = 0.111. (B) Venn diagram of overlap for significant H3K27ac sites for +CV and +HFM comparisons (P adjusted <.05). (C) Average H3K27ac ChIP-seq and DNase-seq signal for various conditions at the Angptl4 locus. An accessible chromatin region coincident with a characterized PPAR binding site in intron 3 was microbially suppressed and +HFM induced. (D) Scatterplots of RNA-seq versus H3K27ac log2 fold change for all 4 comparisons using the single nearest gene neighboring the significantly differential H3K27ac site (P adjusted <.05). Colored dots represent associated genes significant by RNA-seq in that comparison (P adjusted <.05) and associated with differential H3K27ac sites. (E) Example loci showing significantly differential H3K27ac enrichment for various comparisons including across multiple comparisons. (F) Quantification of different patterns of differential H3K27ac DNase sites (P adjusted <.05). The number of sites is enumerated above the pattern for each group that is significantly differential in either a +CV or +HFM comparison (left). One thousand two hundred fifty-five regulatory regions are responsive in both a +CV and +HFM comparison (right). (G) Coincident GREAT GO terms enrichment for 8 H3K27ac directional significance groups. (H) Scatterplot of average H3K27ac sites with significantly different log2 fold change window for CV/GF and CV+HFM/GF+HFM (P adjusted <.05). (I) Same as (H) for GF+HFM/GF and CV+HFM/CV. (J) Scatterplot of significant H3K27ac sites for CV/GF and CV+HFM/GF+HFM log2 FC colored by overlap with enterocyte (purple) or ISC (pink) regulatory regions. (K) Same as (J) for GF+HFM/GF versus CV+HFM/CV.
Figure 5
Figure 5
Characterizing putative interaction regulatory regions. (A) Volcano plot showing interaction log2 fold change versus –log10P value for lenient (P value <.01, >15 base mean; red) cutoffs identifies H3K27ac regulatory windows with greatest potential for interaction. Twenty thousand out of 547,000+ enriched H3K27ac windows that did not pass the lenient interaction cutoff were chosen at random to represent noninteracting sites. (B) Scatterplot comparing H3K27ac log2 interaction windows fold change linked to the RNA log2 interaction fold change for genes that also show interaction reveals a positive correlation suggesting many of these regions are causal in contributing to the transcription patterns of these genes across +CV and +HFM conditions. (C) Selected putative H3K27ac interaction windows from each cluster showing consistent patterns of H3K27ac enrichment and relative RNA levels across the 4 conditions.
Figure 6
Figure 6
Microbial and nutritional stimuli signal to many of the same intestinal regulatory regions. (A) Pairwise comparison of maximum overlap of coincident significant H3K27ac sites (P adjusted <.05) for 8 directional significance groups identifies microbially responsive regulatory regions with CV+HFM/CV-up also being CV+HFM/GF+HFM-up (red) and GF+HFM/GF-up also being CV+HFM/GF+HFM-down (blue). (B) Heatmap of differential comparisons (P adjusted <.05) for all +HFM-up sites shows the proportion that is also microbially responsive. (C) Pie charts for red and blue +HFM-up groups that show the proportion that overlap with previously characterized enterocyte and ISC regulatory regions. (D) GREAT GO term enrichment for red and blue +HFM-up H3K27ac groups. (E) Heatmap of example red +HFM-up and +CV-up H3K27ac sites and their linked gene’s RNA-seq log2 fold change, including many loci associated with ISCs and proliferation. (F) Different combinations of differential H3K27ac sites that are both +HFM and +CV responsive show that only red sites that are +HFM-up and +CV-up are linked to genes that are preferentially expressed in ISCs relative to enterocytes. (G) Heatmap of example blue +HFM-up H3K27ac sites and their linked gene’s RNA-seq log2 fold change. Blue asterisk marks Ppara regulatory region that is characterized in Figure 7. (H) Different combinations of differential H3K27ac sites that are both +HFM and +CV responsive show that only blue sites that are +HFM-up and +CV-down are linked to genes that are activated by PPARA. (I) Scatterplot of genes that are significantly differential after PPARA activation and in GF+HFM/GF show a positive correlation. (J) Scatterplot of genes that are significantly differential after PPARA activation and in CV/GF show a negative correlation. (K) Scatterplot of log2 fold change levels for genes significant (<.005 P adjusted) in 24-hour fast/ad libitum versus PPARA activated genes. (L) Scatterplot of log2 fold change levels for genes significant (<.005 P adjusted) in 24-hour fast/ad libitum versus GF+HFM/GF shows many of the same PPARA targets are activated by fasting and HFM.
Figure 7
Figure 7
Characterization of the putative PPARA regulatory region that responds to microbes and HFM. (A) PPARA immunofluorescence of small intestinal villi (red) in GF and CV mice fed ad libitum. (B) Quantification of IEC PPARA nuclear fluorescence for the crypt and villus identifies higher nuclear fluorescence in GF mice. ∗P value ≤.05, ∗∗P value ≤.01, and ∗∗∗P value ≤.001; two-way ANOVA; n = 4 per condition. (C) Exploded view of H3K27ac region at mouse Ppara locus from Figure 6G that is +HFM-up and +CV-down showing signal across conditions for H3K27ac, HNF4A, and accessible chromatin for jejunum and numerous other tissues. (D) Putative TF motifs at the mouse Ppara regulatory region include multiple nuclear receptor sites, including PPARE. (E) Transgenic Tg(Mmu.Ppara:GFP) zebrafish at 6 days post-fertilization (dpf) with the mouse Ppara regulatory region upstream of a mouse cFos minimal promoter driving GFP shows expression largely limited to the anterior intestine. E' boxed inset shows a confocal cross section confirming the signal is specific to IECs. (F) Quantitative real-time polymerase chain reaction of a 4 condition experiment using whole 6 dpf Tg(Mmu.Ppara:GFP) zebrafish shows similar responses to colonization and HFM for pparaa and gfp. Significance calls for colonization, nutritional, and interaction based on 2-factor ANOVA: ∗P value ≤.05, ∗∗P value ≤.01, and ∗∗∗∗P value ≤.0001. Ten to 20 larvae per replicates; 11-12 replicates per condition. (G) FAO and ISC associated genes showing particular expression in IECs from GF+HFM and CV+HFM mice, respectively (Supplementary Table 2).
Figure 8
Figure 8
Enrichment of TF motifs implies HNF4A distinguishes sites that are differential between CV+HFM and GF+HFM. (A) Heatmap of TFs that are significantly different in at least one +HFM and one +CV comparison by RNA-seq. (B) Motif enrichment at DNase sites linked to +CV H3k27ac significance groups (P adjusted <.05) comparing CV/GF and CV+HFM/GF+HFM sites. For each significance +CV group the reciprocal direction is used as the background (e.g., CV/GF-up input versus CV/GF-down background). The –log10P values are plotted for motif enrichment. Both directions are plotted on the same axis with each analysis separated by colored arrows. HNF4A motif (green asterisk) was not differentially enriched between CV/GF directional H3K27ac sites but was substantially enriched in CV+HFM/GF+HFM-down sites relative to CV+HFM/GF+HFM-up sites. (C) Same as (B) for GF+HFM/GF versus CV+HFM/CV. (D) Clustering of enrichment motif score (–log10 P value) for TF motifs that are present in multiple comparisons for 8 directional significance groups. Data are shared with (B) and (C). (E) Example TF motif enrichment patterns including those coincident with red (+HFM-up and +CV-up) and blue (+HFM-up and +CV-down) H3K27ac sites.
Figure 9
Figure 9
HNF4A’s role in promoting IEC differentiation explains correlation between Hnf4a loss and microbially responsive genes. (A) DESeq2 PCA of HNF4A ChIP-seq normalized counts shows the CV condition deviates from all other conditions. Replicates represent individual mice: CV = 3, CV+HFM = 4, GF = 3, and GF+HFM = 4. Adonis permutational multivariate ANOVA of HNF4A distance matrix; microbes: P = .004, R2 = 0 .158; meal: P = .136, R2 = 0.094. (B) HNF4A peak numbers across GF, GF+HFM, CV, and CV+HFM as well as merged across all replicates and conditions (false discovery rate <0.05). (C) Clustered heatmap of HNF4A binding sites with peaks called in at least 2 replicates compared with log2 fold change for each of the 4 comparisons. (D–G) UCSC screenshot of HNF4A binding sites that are significantly differential, corresponding to (H) and (I) at the Apoa1 (D),Acaa2 (E), Mapk6 (F), and Acot12 (G) loci. (H) Scatterplot of significantly different log2 fold change for CV/GF and CV+HFM/GF+HFM HNF4A occupancy (false discovery rate <0.05). (I) Same as (H) for GF+HFM/GF and CV+HFM/CV HNF4A occupancy. (J) Genes ordered by the number of neighboring HNF4A binding sites show a positive correlation with gene expression level. (K) Scatterplot comparison between significantly differential microbial responsive genes and Hnf4aΔIEC/WT in the jejunum. Genes with more than 10 neighboring HNF4A sites are indicated (dark blue). (L) Scatterplot comparing genes that have significantly differential expression in Hnf4aΔIEC/WT colon versus CV/GF colon. (M) Scatterplot of significant CV/GF log2 fold change RNA-seq levels versus Hnf4aΔIEC/WT RNA levels for genes in the Defense Response GO term are not frequently linked to numerous HNF4A binding sites. (N) Percentage of significant CV/GF genes per HNF4A binding site group that are significantly down-regulated for different binding site group bins. (O) Scatterplot comparing small intestine RNA-seq log2 fold change for enterocyte/enterocyte-progenitor versus Hnf4aΔIEC/WT. 10+ HNF4A binding sites/targets (blue) contribute directly and indirectly to FAO genes (yellow) activation preferentially in enterocytes., (P) Comparison of genes that are preferentially expressed in 5 compartments along the crypt-villus axis for various Hnf4 deletion mutants in the intestine.,,, (Q) Average number of HNF4A binding sites per gene based on crypt-villus compartment groups. (R) Scatterplot comparing jejunal microbial response (CV/GF) to Hnf4aΔIEC/WT in jejunum colored for genes preferentially expressed in the crypt (red) and villus tip (blue)., (S) RNA-seq log2 fold change for small intestinal enterocyte/ISC RNA levels for groups of significantly differential down (blue arrow) and up (red arrow) genes from numerous published datasets showed a common impact of Hnf4aΔIEC/WT,Hnf4agDKO/WT, CV/GF in sorted ISCs, and human ileal Crohn’s on the crypt-villus/proliferation-differentiation axis. FAO genes are also more highly expressed in enterocytes versus ISCs (Supplementary Table 7). Yellow bars refer to the average enterocyte/ISC log2 fold change RNA levels for each group. Gray bar represents the average for all genes except FAO genes. (T) Scatterplot comparing PPARA-activated genes versus Hnf4aΔIEC/WT RNA levels in mouse jejunum identifies that PPARA targets and FAO genes are commonly reduced in Hnf4aΔIEC.
Figure 10
Figure 10
HNF4A-dominated enterocyte and HNF4A-absent ISC regulatory regions behave distinctly in response to microbes and HFM. (A) Organized heatmap of merged accessible chromatin peak calls for sites that were significantly enriched in at least 1 of the 4 sorted IEC cell types (red). Jejunal DHS sites and H3K4me2 sites from goblet cells are also included. Groups of sites that are accessible in enterocytes and ISCs are further broken down into whether they are accessible in other (restricted) or only their IEC type (specific). A subset of sites are accessible across IEC subtypes (pan-accessible). Corresponding accessible chromatin data overlap with other mouse tissues (blue) identifies patterns of enrichment., Groups of sites that correspond to enterocyte sites are marked with a straight blue line, and ISC but not enterocytes sites are marked with straight red lines. (B) Heatmap for HNF4A binding (yellow) and computationally detected HNF4A motif (orange) for sites ordered as in (A). These data are summarized with descending moving means (500 site window, 1 site step). A similar pattern is seen using a previously published jejunum HNF4A ChIP-seq dataset (teal). Duodenum SMAD4 ChIP-seq dataset (brown). (C) Heatmap for H3K27ac differential binding for sites ordered as in (A). These data are summarized with descending moving means (500 site window, 1 site step). (D) The log2FC for H3K27ac sites that are significantly different in at least one comparison for the CV+HFM/GF+HFM comparison grouped by their linked neighboring gene into 1 of 5 compartments based on preferential expression along the crypt-villus axis. Within the compartments, H3K27ac sites are ordered by random. H3K27ac sites that are significant by the comparison on the Y-axis are red dots. All nonsignificant sites are blue. Yellow dashed lines are average for all sites within that compartment. (E) GREAT GO term enrichment for enterocyte-specific sites. (F) GREAT GO term enrichment for ISC-specific sites. (G) Motif enrichment at ATAC-seq sites linked to ISC-specific and Ent-specific groups versus CV+HFM and GF+HFM groups. For each group the reciprocal direction is used as the background (i.e., ISC-specific input versus Ent-specific background). The –log10P values are plotted. Both directions are plotted on the same axis with each analysis separated by colored arrows. (H) Groups of accessible sites (red bars) further organized by if they are bound by HNF4A (yellow bars) show dependence on HNF4A binding for decreased enrichment in CV+HFM/GF+HFM H3K27ac signal at enterocyte-specific sites and increased (I) ISC-specific sites on average.

Similar articles

Cited by

References

    1. Soderholm A.T., Pedicord V.A. Intestinal epithelial cells: at the interface of the microbiota and mucosal immunity. Immunology. 2019;158:267–280. - PMC - PubMed
    1. Martinez-Guryn K., Hubert N., Frazier K., Urlass S., Musch M.W., Ojeda P., Pierre J.F., Miyoshi J., Sontag T.J., Cham C.M., Reardon C.A., Leone V., Chang E.B. Small intestine microbiota regulate host digestive and absorptive adaptive responses to dietary lipids. Cell Host Microbe. 2018;23:458–469 e5. - PMC - PubMed
    1. Patnode M.L., Beller Z.W., Han N.D., Cheng J., Peters S.L., Terrapon N., Henrissat B., Le Gall S., Saulnier L., Hayashi D.K., Meynier A., Vinoy S., Giannone R.J., Hettich R.L., Gordon J.I. Interspecies competition impacts targeted manipulation of human gut bacteria by fiber-derived glycans. Cell. 2019;179:59–73 e13. - PMC - PubMed
    1. Krautkramer K.A., Fan J., Backhed F. Gut microbial metabolites as multi-kingdom intermediates. Nat Rev Microbiol. 2021;19:77–94. - PubMed
    1. Byndloss M.X., Olsan E.E., Rivera-Chavez F., Tiffany C.R., Cevallos S.A., Lokken K.L., Torres T.P., Byndloss A.J., Faber F., Gao Y., Litvak Y., Lopez C.A., Xu G., Napoli E., Giulivi C., Tsolis R.M., Revzin A., Lebrilla C.B., Baumler A.J. Microbiota-activated PPAR-gamma signaling inhibits dysbiotic Enterobacteriaceae expansion. Science. 2017;357:570–575. - PMC - PubMed

Publication types