. 2022 Jun 15;42(24):4828-4840.
doi: 10.1523/JNEUROSCI.1965-21.2022. Epub 2022 May 9.

Neuropilin 2/Plexin-A3 Receptors Regulate the Functional Connectivity and the Excitability in the Layers 4 and 5 of the Cerebral Cortex

Affiliations

Neuropilin 2/Plexin-A3 Receptors Regulate the Functional Connectivity and the Excitability in the Layers 4 and 5 of the Cerebral Cortex

Hussain Y Khdour et al. J Neurosci. .

Abstract

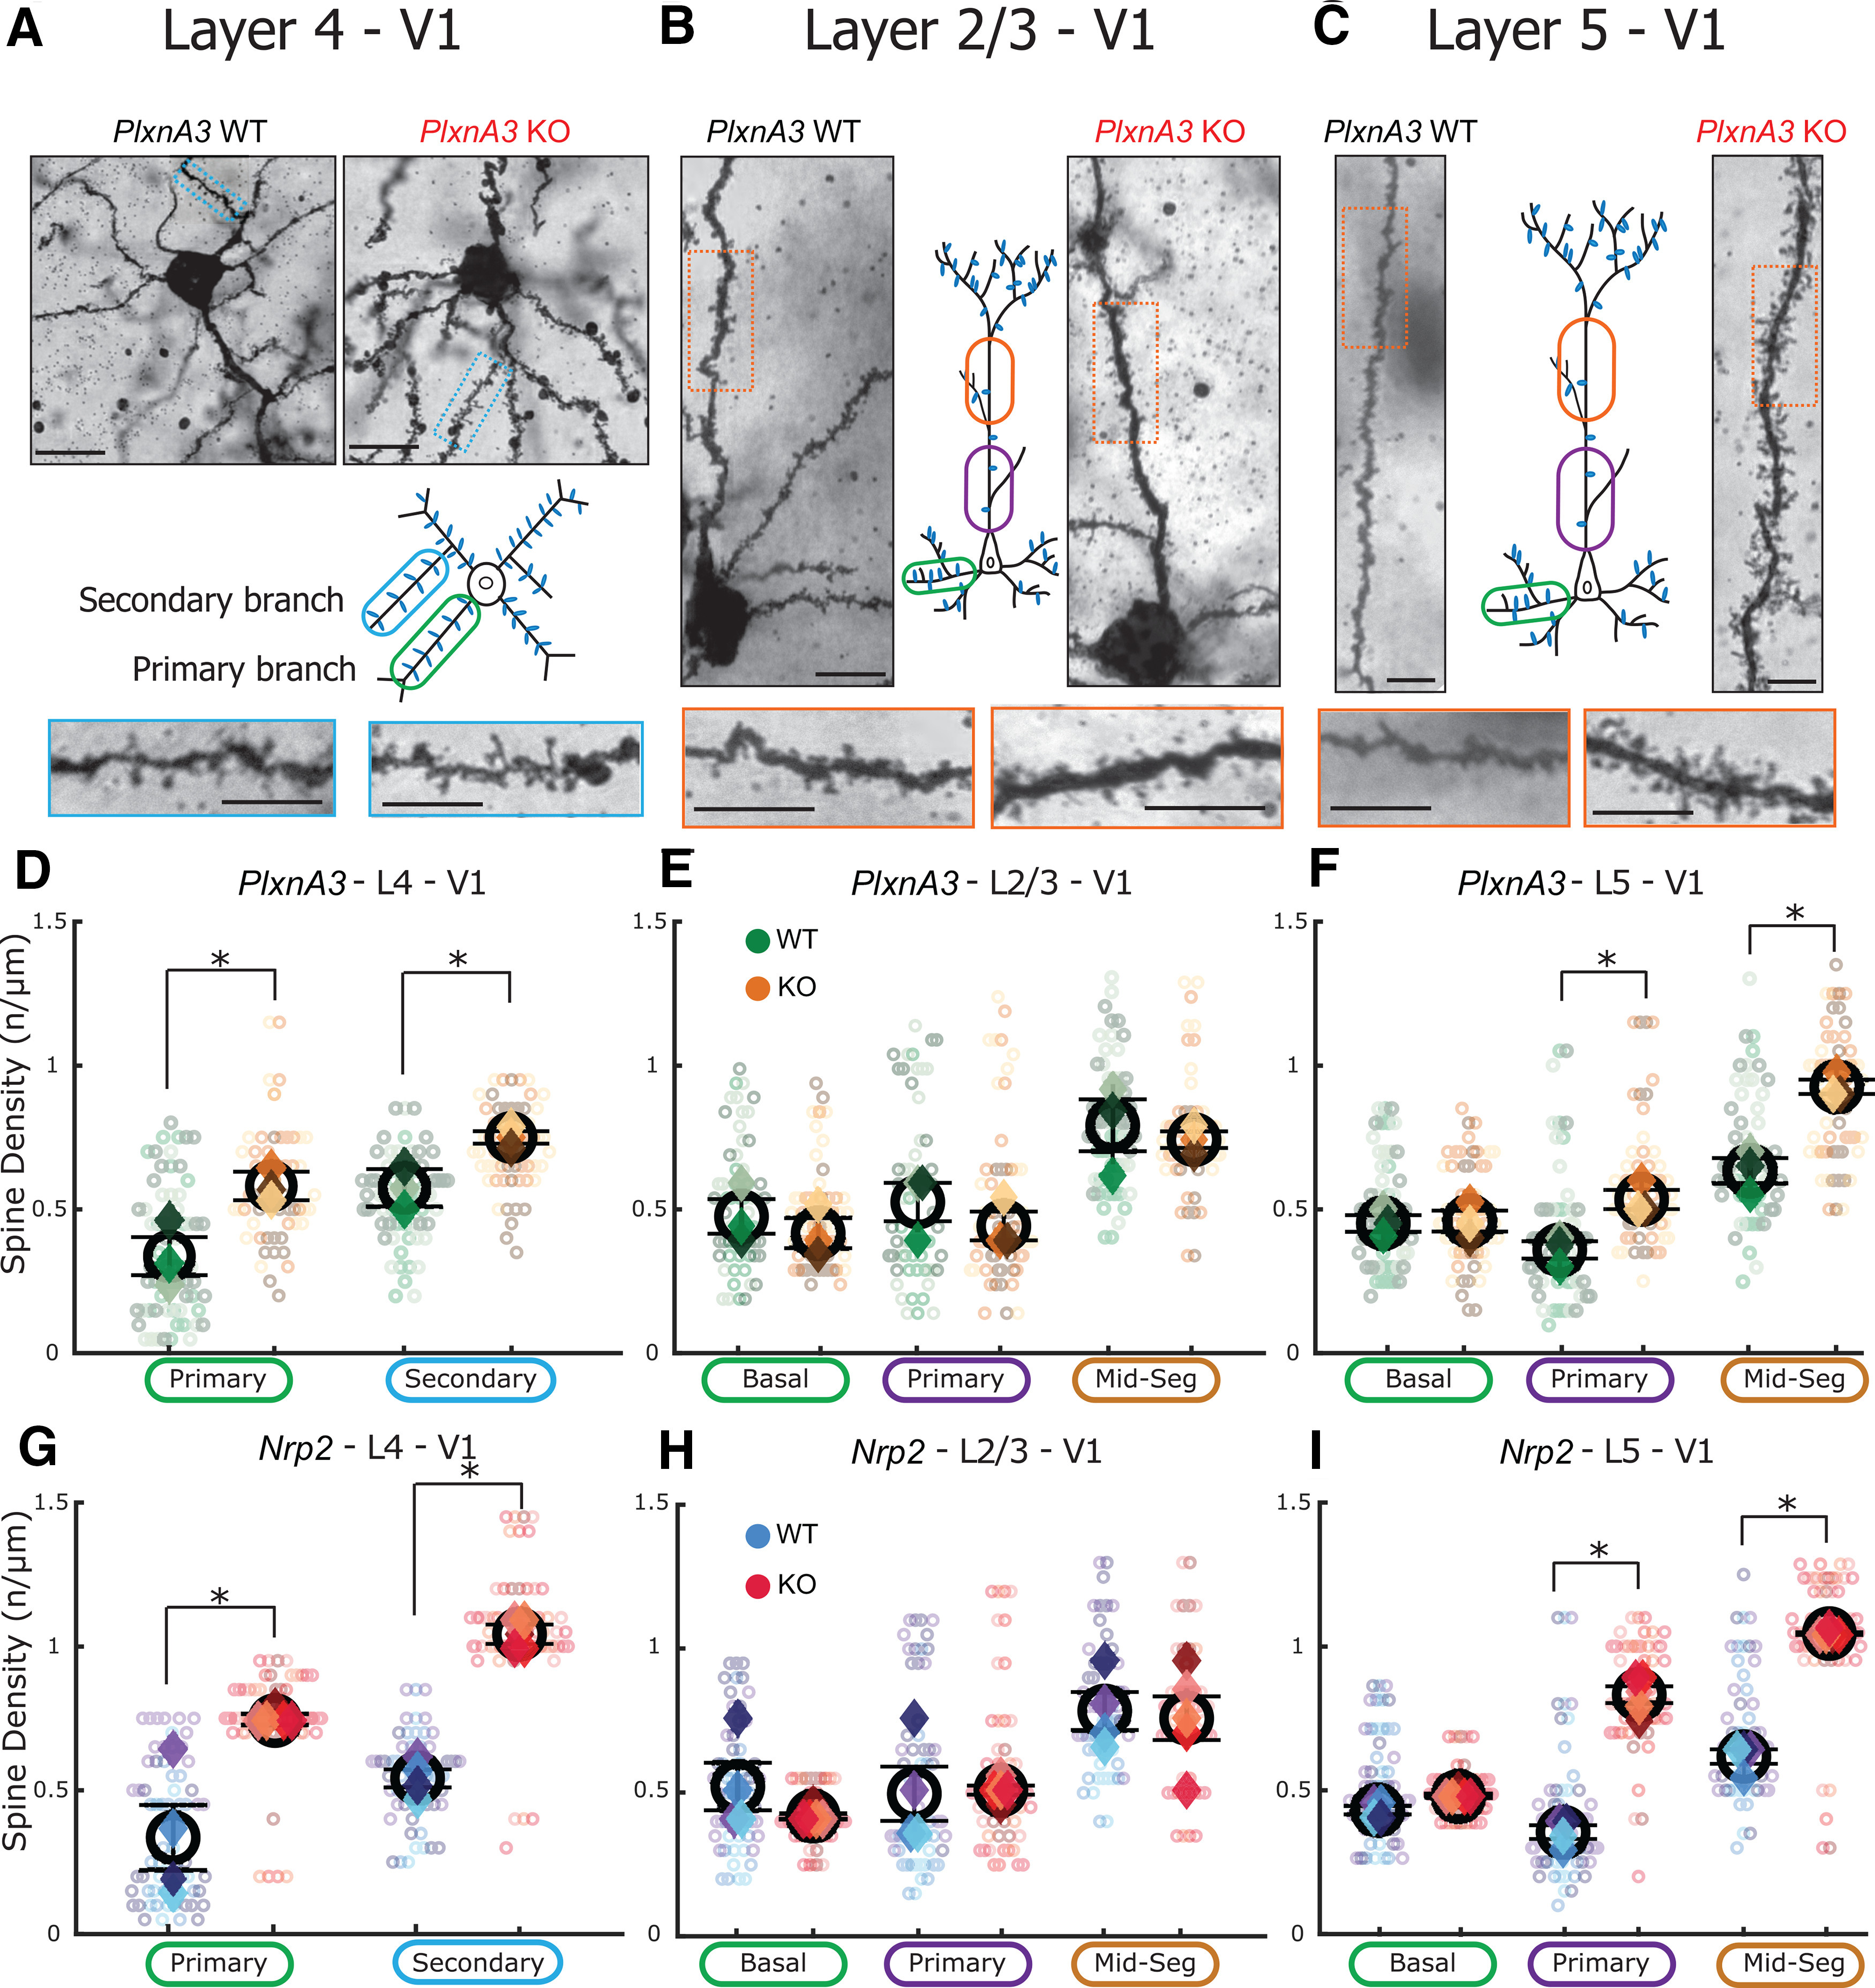
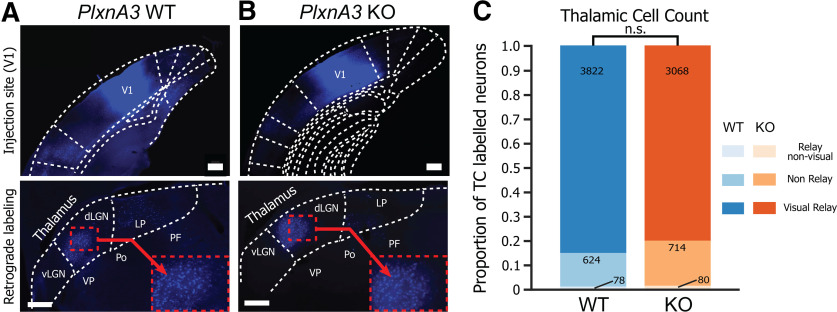
The functions of cortical networks are progressively established during development by series of events shaping the neuronal connectivity. Synaptic elimination, which consists of removing the supernumerary connections generated during the earlier stages of cortical development, is one of the latest stages in neuronal network maturation. The semaphorin 3F coreceptors neuropilin 2 (Nrp2) and plexin-A3 (PlxnA3) may play an important role in the functional maturation of the cerebral cortex by regulating the excess dendritic spines on cortical excitatory neurons. Yet, the identity of the connections eliminated under the control of Nrp2/PlxnA3 signaling is debated, and the importance of this synaptic refinement for cortical functions remains poorly understood. Here, we show that Nrp2/PlxnA3 controls the spine densities in layer 4 (L4) and on the apical dendrite of L5 neurons of the sensory and motor cortices. Using a combination of neuroanatomical, ex vivo electrophysiology, and in vivo functional imaging techniques in Nrp2 and PlxnA3 KO mice of both sexes, we disprove the hypothesis that Nrp2/PlxnA3 signaling is required to maintain the ectopic thalamocortical connections observed during embryonic development. We also show that the absence of Nrp2/PlxnA3 signaling leads to the hyperexcitability and excessive synchronization of the neuronal activity in L5 and L4 neuronal networks, suggesting that this system could participate in the refinement of the recurrent corticocortical connectivity in those layers. Altogether, our results argue for a role of semaphorin-Nrp2/PlxnA3 signaling in the proper maturation and functional connectivity of the cerebral cortex, likely by controlling the refinement of recurrent corticocortical connections.SIGNIFICANCE STATEMENT The function of a neuronal circuit is mainly determined by the connections that neurons establish with one another during development. Understanding the mechanisms underlying the establishment of the functional connectivity is fundamental to comprehend how network functions are implemented, and to design treatments aiming at restoring damaged neuronal circuits. Here, we show that the cell surface receptors for the family of semaphorin guidance cues neuropilin 2 (Nrp2) and plexin-A3 (PlxnA3) play an important role in shaping the functional connectivity of the cerebral cortex likely by trimming the recurrent connections in layers 4 and 5. By removing the supernumerary inputs generated during early development, Nrp2/PlxnA3 signaling reduces the neuronal excitability and participates in the maturation of the cortical network functions.

Keywords: cortex maturation; cortical layers; functional connectivity; sema 3F signaling; synaptic pruning; thalamocortical.


Figures

Figure 1.
Figure 1.
Comparison of the spine density of L4, L2/3, and L5 V1 neurons in the presence and absence of Nrp2/PlxnA3 signaling. A, Photomicrographs of an L4 spiny stellate neuron taken in a mouse that does not express the Sema3F coreceptor PlexinA3 (right; PlxnA3 KO) and a wild-type littermate (left; PlxnA3 WT). Scale bar, 15 µm. Inset, Schematic representation of the location of the primary and secondary branches on an L4 neurons. Bottom, Enlargements of the sections indicated in the above photomicrographs. Scale bar, 10 µm. B, Same representation as in A for V1 L2/3 pyramidal cells. C, Same representation as in A, for V1 L5 pyramidal cells. D, Spine density in the primary and secondary branches of V1 L4 neurons in PlxnA3 WT (neurons, green dots; median across neurons for each mouse, green diamonds) and PlxnA3 KO (neurons, brown dots; median across neurons for each mouse, brown diamonds). PlxnA3 WT, 65 neurons in 3 mice; PlxnA3 KO, 60 neurons in 3 mice (Fig. 2K, color code). Black circles indicate the mean across mice ± SEM. E, Same representation as in D for V1 L2/3 pyramidal neurons. PlxnA3 WT, 60 neurons in 3 mice; PlxnA3 KO, 57 neurons in 3 mice. F, Same representation as in D for V1 L5 pyramidal neurons. PlxnA3 WT, 62 neurons in 3 mice; PlxnA3 KO, 64 neurons in 3 mice. G, Comparison between Nrp2 WT (neurons, blue dots; median across neurons for each mouse, blue diamonds) and Nrp2 2 KO (neurons, red dots; median across neurons for each mouse, red diamonds) of the spine density in the primary and secondary branches of V1 L4 neurons. Nrp2 WT, 64 neurons in 4 mice; Nrp2 KO, 72 neurons in 5 mice (Fig. 2K, color code). H, Same representation as in G for V1 L2/3 pyramidal neurons. Nrp2 WT, 62 neurons in 4 mice; Nrp2 KO, 64 neurons in 5 mice. I, Same representation as in G for V1 L5 pyramidal neurons. Nrp2 WT, 62 neurons in 4 mice; Nrp2 KO, 67 neurons in 5 mice. Proximal, Proximal section of the apical dendrite; Mid-Seg, midsegment of the apical dendrite.
Figure 2.
Figure 2.
Spine density across layers, cortices, genetic backgrounds, dendritic locations, and genotypes. A, Spine density in the primary and secondary branches of S1 L4 neurons in PlxnA3 WT (neurons, green dots; median across neurons for each mouse, green diamonds) and PlxnA3 KO (neurons, brown dots; median across neurons for each mouse, brown diamonds). PlxnA3 WT, 64 neurons in 3 mice; PlxnA3 KO, 64 neurons in 3 mice (see color code in K). B, Same representation as in A for S1 L2/3 pyramidal neurons. PlxnA3 WT, 62 neurons in 3 mice; PlxnA3 KO, 58 neurons in 3 mice. C, Same representation as in D for S1 L5 pyramidal neurons. PlxnA3 WT, 63 neurons in 3 mice; PlxnA3 KO, 64 neurons in 3 mice. D, Comparison between Nrp2 WT (blue) and Nrp2 KO (neurons, red dots; median across neurons for each mouse, red diamonds) of the spine density in the primary and secondary branches of S1 L4 neurons. Nrp2 WT, 64 neurons in 4 mice; Nrp2 KO, 72 neurons in 5 mice. E, Same representation as in D for S1 L2/3 pyramidal neurons. Nrp2 WT, 62 neurons in 4 mice; Nrp2 KO, 70 neurons in 5 mice. F, Same representation as in D for S1 L5 pyramidal neurons. Nrp2 WT, 64 neurons in 4 mice; Nrp2 KO, 72 neurons in 5 mice. G, Spine density in the basal, primary, and midsegment branches of M1 L2/3 neurons in WT (neurons, green dots; median across neurons for each mouse, green diamonds) and PlxnA3 KO (neurons, brown dots; median across neurons for each mouse, brown diamonds). PlxnA3 WT, 56 neurons in 3 mice; PlxnA3 KO, 65 neurons in 3 mice. H, Same representation as in G for M1 L5 pyramidal neurons. PlxnA3 WT, 58 neurons in 3 mice; PlxnA3 KO, 61 neurons in 3 mice. I, Comparison between Nrp2 WT (neurons, blue dots; median across neurons for each mouse, blue diamonds) and Nrp2 2 KO (neurons, red dots; median across neurons for each mouse, red diamonds) of the spine density in the basal, primary, and midsegment branches of M1 L2/3 neurons. Nrp2 WT, 64 neurons in 4 mice; Nrp2 KO, 72 neurons in 5 mice. J, Same representation as in I for M1 L5 pyramidal neurons. Nrp2 WT, 58 neurons in 4 mice; Nrp2 KO, 73 neurons in 5 mice. K, Color code attributed to the PlxnA3 mice (WT, green shades; KO, brown shades) and Nrp2 mice (WT, blue shades; KO, red shades) and their corresponding age.
Figure 3.
Figure 3.
fast blue retrograde labeling from V1 in the thalamic nuclei of adult PlxnA3 WT and PlxnA3 KO mice. A, Confocal images of the injection site localized in V1 and the neurons retrogradely labeled in the posterior thalamic nuclei in an adult WT littermate of PlxnA3 KO mice. vLGN, Ventral part of the LGN; dLGN, dorsal part of the LGN; LP, lateral posterior nucleus; VP, ventral posterior nucleus; Po, posterior thalamic nucleus; PF, parafascicular thalamic nucleus. Scale bar, 100 µm. B, Same representation as in A for fast blue retrograde labeling performed in an adult PlxnA3 KO mouse. C, Proportion of neurons labeled in the visual relay, relay nonvisual, and nonrelay thalamic nuclei for WT mice and mice KO for PlxnA3 the coreceptor of Sema3F. χ2 test: χ2 = 0.11; n.s., nonsignificant difference (p = 0.74).
Figure 4.
Figure 4.
Miniature currents in the V1 of PlxnA3 WT and PlxnA3 KO mice. A, Miniature EPSCs recorded in V1 L4 (top traces) and V1 L5 (bottom traces) of adult WT (green traces) and PlxnA3 KO mice (orange traces). B, Cumulative probability of the mEPSC frequency in PlxnA3 WT and PlxnA3 KO mice L4 (left) and L5 neurons (right). Inset, Box plot representation of the same data for statistical comparison. *p < 0.0001. C, Probability distribution of the amplitude of mEPSCs in the L4 (left) and L5 (right) of WT (black) and PlxnA3 KO mice. D, Box plots summarizing the data shown in C and statistical comparison. *p < 0.0001.
Figure 5.
Figure 5.
Response of V1 L4 and L5 neurons to the optogenetic stimulation of LGN thalamocortical axons in PlxnA3 WT and PlxnA3 KO mice. A, Schematic representation of the experimental setup. B, Confocal microscope images of two slices containing a total of three recorded neurons. Red channel, Recorded neurons filled with biocytin and reacted with streptavidin Alexa Fluor 594; green channel, axons expressing ChR2-YFP. C, Mean response (average of 10 trials) of a L4 neuron (left) and a L5 neuron (right) of WT mice in response to the optogenetic stimulation of the thalamocortical axons (blue line) in the absence (control, black trace) and presence of glutamate antagonists (CNQX + AP-5). D, Amplitude of the current evoked in L4 and L5 WT neurons by the optogenetic stimulation of thalamocortical axons in the absence (left) and the presence (right) of CNQX + AP-5. E, Amplitude of the current response as a function of the stimulus intensity in L5 PlxnA3 WT (Pinto et al., 2010) and L5 PlxnA3 KO neurons (orange). Green solid line, Linear fit of the relationship between light intensity and response amplitude in L5 WT neurons; green dashed line, upper bound of the 95% confidence interval of the linear fit. Neurons with responses consistently above this line present a significant hyperexcitability compared with the L5 WT population. Inset, Enlargement on the evoked activity of L5 WT neurons. F, Same representation as in E for neurons of L4. The green shaded area indicates the 95% confidence interval of the response of neurons recorded in the WT mouse population.
Figure 6.
Figure 6.
Direct thalamocortical connectivity to V1 L4 and V1 L5 neurons in PlxnA3 WT and PlxnA3 KO mice. A, Left, Response of a WT (green trace) and a PlxnA3 KO V1 L4 neuron (orange trace) to the optogenetic stimulation of the thalamocortical axons located in V1 (blue rectangle; intensity, 0.28 mW/mm2). Thicker trace, Average of the 10 presented trials (light traces); dots, location of response peaks. Right, Same representation for WT and PlxnA3 KO L5 neurons using 0.81 and 0.11 mW/mm2 stimuli, respectively. B, Timing of the optogenetic response initiation in the L4 and L5 WT and PlxnA3 KO mice. *p < 0.01. C, Distribution of the timings of the response peak in the L4 and L5 WT (top) and PlxnA3 mice (bottom). D, Timing of the peak of the current response in the L4 and L5 WT and PlxnA3 KO mice. n.s., p > 0.05. E, Response initiation for the WT and hyperexcitable KO neurons (KO*). *p < 0.05. F, Left, Responses evoked in one L4 WT neuron by optogenetic stimulations of the thalamocortical axons in V1 in the absence (black traces, Control) or presence of TTX alone (green trace) or combined with 4-aminopyridine (red trace). Middle, L5 PlxnA3 KO neurons showing direct connection to the LGN. Right, L5 PlxnA3 KO neurons not connected to the LGN. G, Proportion of L5 neurons in WT (left) and PlxnA3 KO mice (right) showing direct thalamocortical connections. χ2 = 0.11, p = 0.74.
Figure 7.
Figure 7.
Neuronal activity correlation in V1 in the absence of Nrp2/PlxnA3 signaling. A, Left, Schematic representation of the correlation analysis. Top, Example of two neurons recorded simultaneously while drifting gratings (arrows; 6 orientations, 2 directions) were presented on the screen. Bottom left, Orientation tuning curves of the two neurons shown above. Bottom right, Cross-correlogram of the neuronal activity of the two neurons recorded during the presentation of visual stimuli. B, Correlation as a function of the distance (Δ) between the preferred orientations of the neuronal pairs for neurons recorded in L4 of Nrp2 WT (blue) and Nrp2 KO (orange) mice. Inset, Difference between the correlation measured in KO compared with WT when the neurons have similar pref. orientations, ortho. preferred orientations, or opp. preferred orientations. Asterisks indicate the effect size: *small effect size, **medium effect size, ***large effect size. C, Same representation as in B for L2/3 Nrp2 WT and Nrp2 KO neurons. D, Same representation as in B for L5 Nrp2 WT and Nrp2 KO neurons. E, Same representation as in B for L4 PlxnA3 WT and PlxnA3 KO neurons. F, Same representation as in C for L2/3 PlxnA3 WT and PlxnA3 KO neurons. G, Same representation as in D for L5 PlxnA3 WT and PlxnA3 KO neurons.

Similar articles

Cited by

References

    1. Alvarez VA, Ridenour DA, Sabatini BL (2007) Distinct structural and ionotropic roles of NMDA receptors in controlling spine and synapse stability. J Neurosci 27:7365–7376. 10.1523/JNEUROSCI.0956-07.2007 - DOI - PMC - PubMed
    1. Amaral DG, Schumann CM, Nordahl CW (2008) Neuroanatomy of autism. Trends Neurosci 31:137–145. 10.1016/j.tins.2007.12.005 - DOI - PubMed
    1. Bagri A, Cheng HJ, Yaron A, Pleasure SJ, Tessier-Lavigne M (2003) Stereotyped pruning of long hippocampal axon branches triggered by retraction inducers of the semaphorin family. Cell 113:285–299. 10.1016/s0092-8674(03)00267-8 - DOI - PubMed
    1. Brainard DH (1997) The Psychophysics Toolbox. Spat Vis 10:433–436. - PubMed
    1. Cohen MR, Kohn A (2011) Measuring and interpreting neuronal correlations. Nat Neurosci 14:811–819. 10.1038/nn.2842 - DOI - PMC - PubMed

Publication types