Meta-Analysis
. 2022 May 9;13(1):2341.
doi: 10.1038/s41467-022-29886-1.

Genetic and phylogenetic uncoupling of structure and function in human transmodal cortex

Affiliations
Meta-Analysis

Genetic and phylogenetic uncoupling of structure and function in human transmodal cortex

Sofie L Valk et al. Nat Commun. .

Abstract

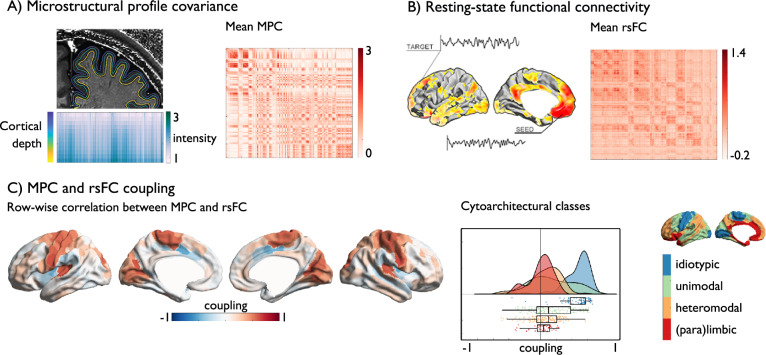
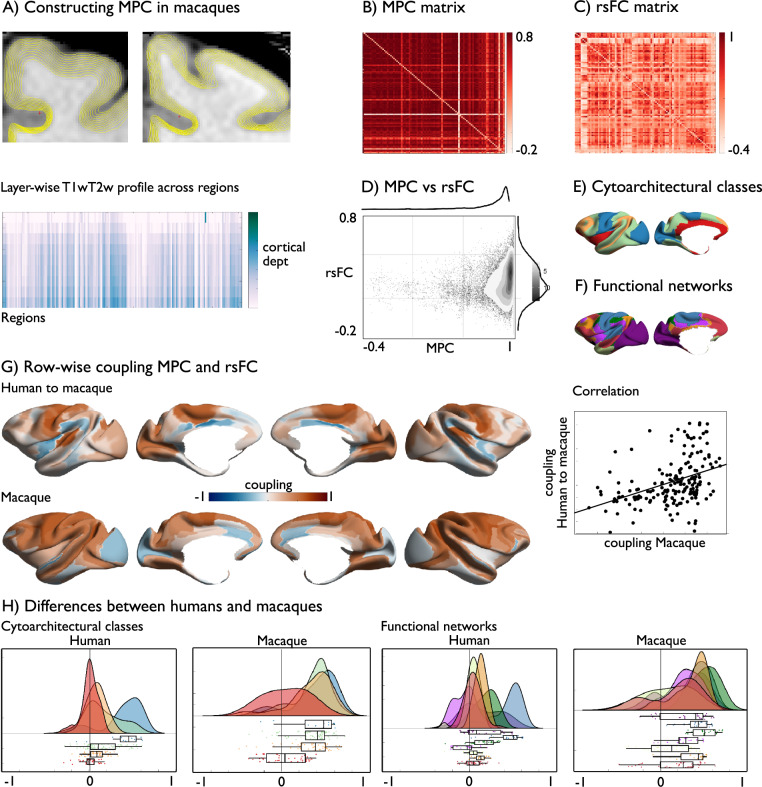
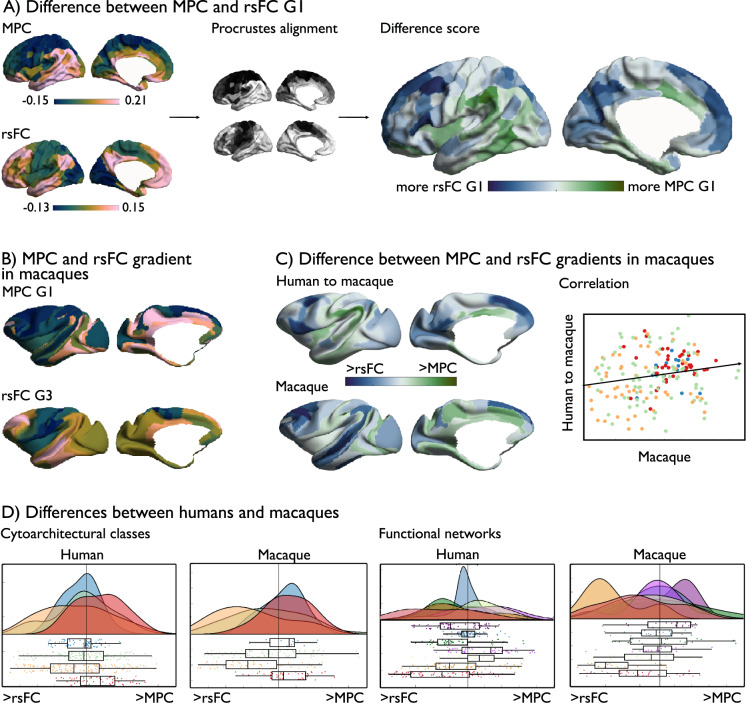
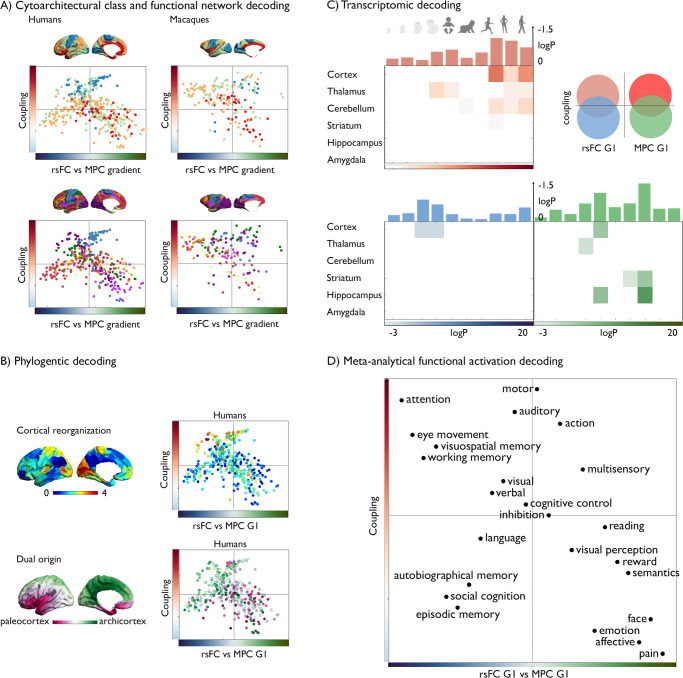
Brain structure scaffolds intrinsic function, supporting cognition and ultimately behavioral flexibility. However, it remains unclear how a static, genetically controlled architecture supports flexible cognition and behavior. Here, we synthesize genetic, phylogenetic and cognitive analyses to understand how the macroscale organization of structure-function coupling across the cortex can inform its role in cognition. In humans, structure-function coupling was highest in regions of unimodal cortex and lowest in transmodal cortex, a pattern that was mirrored by a reduced alignment with heritable connectivity profiles. Structure-function uncoupling in macaques had a similar spatial distribution, but we observed an increased coupling between structure and function in association cortices relative to humans. Meta-analysis suggested regions with the least genetic control (low heritable correspondence and different across primates) are linked to social-cognition and autobiographical memory. Our findings suggest that genetic and evolutionary uncoupling of structure and function in different transmodal systems may support the emergence of complex forms of cognition.


Conflict of interest statement

The authors declare no competing interests.

Figures

Fig. 1
Fig. 1. Structure–function coupling and heritability in human cortical regions.
A Microstructural profile covariance (MPC) was chosen to map networks of microstructural similarity for each cortical node, sorted along cytoarchitectural class,; B Resting-state functional connectivity (rsFC) analysis maps nodal patterns of intrinsic functional connectivity, sorted along cytoarchitectural class; C Row-wise coupling of MPC and rsFC Middle: raincloud plot of distribution within cytoarchitectural classes of coupling in the 400 Schaefer parcels, box shows the median and interquartile (25–75%) range, whiskers depict the 1.5*interquartile range (IQR) from the quartiles; Right: Reference visualization cytoarchitectural class. Source data are provided as a Source Data file.
Fig. 2
Fig. 2. Genetic basis of structure–function coupling.
A Heritability of MPC and rsFC; B Row-wise association between mean and heritable seed-wise connectivity—reflecting genetic control over connectivity profiles, Right: distribution of coupling in 400 parcels per cytoarchitectural class, box shows the median and interquartile (25–75%) range, whiskers depict the 1.5*IQR from the quartile; C Heritability of microstructure-function coupling, Right: distribution of heritability in 400 parcels per cytoarchitectural class, box as in B,. Source data are provided as a Source Data file.
Fig. 3
Fig. 3. Microstructure-function coupling in macaques.
A Creating MPC in macaques; B MPC matrix in macaques, ordered along cytoarchitectural class based on ref. and Markov labels; C rsFC matrix in macaques, ordered along cytoarchitectural class; D Correspondence between MPC and rsFC in macaques; E Cytoarchitectural classes; F Functional communities based on ref. ; G Row-wise association of MPC and rsFC; upper panel: human map in macaque space; lower panel: macaque map; right: scatter between human and macaque MPC-rsFC coupling; H Raincloud plots of coupling in humans and macaques as a function of cytoarchitectural class and functional communities in macaque space (182 parcels of Markov parcellation), boxes show the median and interquartile (25–75%) range, whiskers depict the 1.5*IQR from the quartile. Source data are provided as a Source Data file.
Fig. 4
Fig. 4. Structure–function coupling in different macaque samples.
A Anesthetized macaque (sample: Davis) structure–function coupling and correlation with human structure–function coupling projected to macaque space; B Awake macaque (sample Newcastle) structure–function coupling and correlation with human structure–function coupling projected to macaque space; C Anesthetized macaque (sample Oxford) structure–function coupling and correlation with human structure–function coupling projected to macaque space; D Structure–function coupling averaged in cytoarchitectural classes across 182 parcels of the Markov parcellation for HCP, Davis, Newcastle and Oxford samples, boxes show the median and interquartile (25–75%) range, whiskers depict the 1.5*IQR from the quartile. Source data are provided as a Source Data file.
Fig. 5
Fig. 5. Principal gradient of heritability and individual variability.
A Principal gradient of MPC and rsFC, left: gradients based on mean data on MPC and rsFC and right gradients of heritable data alone, lower left panel: mean versus heritable MPC G1, as well as heritably along the principal mean gradient in MPC; lower right panel: mean versus heritable rsFC G1, as well as heritably along the principal mean gradient in rsFC; B Principal gradient of individual variation (std) in MPC and rsFC, lower panel left: correlation between mean and std MPC G1, and std along the mean gradient of MPC; lower panel right: correlation between mean and std rsFC G1, and std along the mean gradient of FC. Source data are provided as a Source Data file.
Fig. 6
Fig. 6. Difference in organizational gradients of MPC and rsFC in humans and macaques.
A Left panel: principal MPC and rsFC gradient; middle panel: alignment; right panel: ΔrsFC-MPCG1; B principal gradient of MPC and tertiary gradient of rsFC in macaques; C Difference between principal gradients of MPC and rsFC in humans, mapped to macaque space, and difference between corresponding gradients in macaques (lower panel); right: correlation between human and macaque maps; D Raincloud plots of organizational differences as a function of cytoarchitectural class, and functional networks in humans (400 parcels, Schaefer parcellation) and macaques (182 parcels, Markov parcellation), boxes show the median and interquartile (25–75%) range, whiskers depict the 1.5*IQR from the quartile. Source data are provided as a Source Data file.
Fig. 7
Fig. 7. Multiscale quadrants of structure–function coupling.
A Cytoarchitectural class and functional community decoding along 2D model of the difference between microstructural and functional connectivity gradients in humans and macaques (x-axis) and microstructure-functional connectivity coupling (y-axes); B Phylogenetic models using cortical reorganization and a model of dual patterning in the cerebral cortex; C Transcriptomic developmental decoding of coupling and gradient differences between structure and function, Red/Blue/Green tones represent the log transformed false discovery rate (FDR)-corrected p-values [–20 –3]. The bar plot above represents the log transformed (FDR)-corrected p-values, averaged across all brain structures. Red indicates the genes that were attributed to the left upper quadrant, blue indicates the values were higher for the functional end of the difference gradient and untethered, whereas green reflects the microstructural apex and untethered. Only values that are below FDRq < 0.05 are displayed; D 2D projection of NeuroSynth meta-analysis of regions of interest along ΔrsFC-MPCG1 map (x-axis) and structure–function uncoupling (y-axis) using 24 topic terms. We binned both ΔrsFC-MPCG1 and coupling maps in 20 equally sized bins, averaged the z-scores of meta-analytical activations per bin and ranked their weighted means along the x- and y-axes. Source data are provided as a Source Data file.

Similar articles

Cited by

References

    1. Mesulam MM. From sensation to cognition. Brain. 1998;121:1013–1052. doi: 10.1093/brain/121.6.1013. - DOI - PubMed
    1. Duncan J. The multiple-demand (MD) system of the primate brain: mental programs for intelligent behaviour. Trends Cogn. Sci. 2010;14:172–179. doi: 10.1016/j.tics.2010.01.004. - DOI - PubMed
    1. Margulies DS, et al. Situating the default-mode network along a principal gradient of macroscale cortical organization. Proc. Natl Acad. Sci. USA. 2016;113:12574–12579. doi: 10.1073/pnas.1608282113. - DOI - PMC - PubMed
    1. Smallwood J, et al. The neural correlates of ongoing conscious thought. iScience. 2021;24:102132. doi: 10.1016/j.isci.2021.102132. - DOI - PMC - PubMed
    1. Garcia-Cabezas MA, Hacker JL, Zikopoulos B. A protocol for cortical type analysis of the human neocortex applied on histological samples, the atlas of Von Economo and Koskinas, and magnetic resonance imaging. Front. Neuroanat. 2020;14:576015. doi: 10.3389/fnana.2020.576015. - DOI - PMC - PubMed

Publication types