. 2022 May 9;13(1):2347.
doi: 10.1038/s41467-022-30061-9.

Plasma membrane phosphatidylinositol (4,5)-bisphosphate is critical for determination of epithelial characteristics

Affiliations

Plasma membrane phosphatidylinositol (4,5)-bisphosphate is critical for determination of epithelial characteristics

Kaori Kanemaru et al. Nat Commun. .

Abstract

Epithelial cells provide cell-cell adhesion that is essential to maintain the integrity of multicellular organisms. Epithelial cell-characterizing proteins, such as epithelial junctional proteins and transcription factors are well defined. However, the role of lipids in epithelial characterization remains poorly understood. Here we show that the phospholipid phosphatidylinositol (4,5)-bisphosphate [PI(4,5)P2] is enriched in the plasma membrane (PM) of epithelial cells. Epithelial cells lose their characteristics upon depletion of PM PI(4,5)P2, and synthesis of PI(4,5)P2 in the PM results in the development of epithelial-like morphology in osteosarcoma cells. PM localization of PARD3 is impaired by depletion of PM PI(4,5)P2 in epithelial cells, whereas expression of the PM-targeting exocyst-docking region of PARD3 induces osteosarcoma cells to show epithelial-like morphological changes, suggesting that PI(4,5)P2 regulates epithelial characteristics by recruiting PARD3 to the PM. These results indicate that a high level of PM PI(4,5)P2 plays a crucial role in the maintenance of epithelial characteristics.


Conflict of interest statement

H.N. works for Lipidome Lab Co., Ltd. (experiments and data analysis, and writing-review and editing). The remaining authors declare no competing interests.

Figures
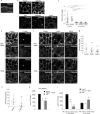
Fig. 1
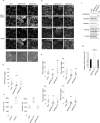
Fig. 1. PI(4,5)P2 is enriched in the plasma membrane of epithelial cells.
a Immunofluorescence detection of PI(4,5)P2 in skin sections of newborn mice. The dotted line denotes the border between the epidermis and the dermis. Results shown are representative of two independent experiments. b, c Immunofluorescence detection of PI(4,5)P2 in epithelial (HaCaT and NMuMG) and non-epithelial (HDF, Swiss3T3, and U2OS) cell lines b. Quantification of apicolateral plasma membrane (PM) PI(4,5)P2 signals c. In total, 138 HaCaT, 122 NMuMG, 104 HDF, 120 Swiss3T3, 102 U2OS cells were examined over two independent experiments. dg Immunofluorescence detection of PI(4,5)P2 in HaCaT cells treated with or without TGFβ1 for 72 h d and HaCaT cells overexpressing SNAI1 or SNAI2 f. F-actin was visualized using phalloidin. Quantification of apicolateral PM PI(4,5)P2 signals e, g. In total, 120 control and 109 TGFβ1-treated cells were examined over two independent experiments e. In total, 100 control, 102 SNAI1-, and 115 SNAI2-expressing cells were examined over two independent experiments g. h, i PIP2 amount in HaCaT cells, treated with or without TGFβ1 for 72 h, and HDF cells was determined using mass spectrometry h. The amount of PIP2 with zero, one, or two double bonds and three or more double bonds in acyl chains is also shown i. N = 4 for untreated HaCaT cells, and N = 3 for TGFβ1-treated HaCaT and HDF cells. Data are represented as mean ± SD h, i. ***p = 0.0006, **p = 0.0012 h, 0.0061 i (versus HaCaT cells) h, i. The box plots are presented with the elements: center line, median; box limits, Q1 and Q3; whiskers, 1.5× interquartile range. Outliers are also shown. Individual data points are displayed [gray points, data from the first experiments; black points, data from the second experiments c, e, g]. Significance was tested using one-way ANOVA with Tukey-Kramer’s post hoc test c, g, h, i and the two-sided Welch’s t-test e. ****p < 0.0001 [versus HaCaT or NMuMG cells c, control cells e, g, and HaCaT cells h, i]. Scale bar = 30 μm a or 20 μm b, d, f. Source data are provided as a Source Data file.
Fig. 2
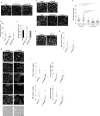
Fig. 2. HaCaT cells lose their epithelial characteristics upon PI(4,5)P2 depletion.
a, b Detection of PI(4,5)P2 and F-actin (phalloidin) in GFP-, Lyn-INPP5Ewt-GFP (INPP5E WT)-, and Lyn-INPP5Emt-GFP (INPP5E MT)-expressing HaCaT cells. To observe actin stress fibers, F-actin images (phalloidin) at the basal plane of the top panels are shown. Phase images are also shown a. Quantification of the apicolateral plasma membrane (PM) PI(4,5)P2 signal b. In total, 120 GFP-, 117 INPP5E WT-, and 100 INPP5E MT-expressing cells were examined over two independent experiments b. c Cell areas of HaCaT cells treated with or without TGFβ1 for 72 h. Cell areas of GFP-, INPP5E WT-, and INPP5E MT-expressing HaCaT cells are shown. The average cell area was calculated by analyzing 10 distinct fields of view over two independent experiments. d, e Immunofluorescence detection of E-cadherin (E-cad), β-catenin (β-cat), claudin-1, and PARD3 in GFP-, INPP5E WT-, and INPP5E MT-expressing HaCaT cells d. Images were taken from different fields of view. Quantification of the PM signals of E-cadherin, β-catenin, claudin-1, and PARD3 e. In total, 111 GFP-, 96 INPP5E WT-, and 103 INPP5E MT-expressing cells were examined over two independent experiments for E-cadherin. In total, 100 GFP-, 114 INPP5E WT-, and 124 INPP5E MT-expressing cells were examined over two independent experiments for β-catenin. In total, 102 GFP-, 96 INPP5E WT-, and 109 INPP5E MT-expressing cells were examined over two independent experiments for claudin-1. In total, 100 GFP-, 96 INPP5E WT-, and 109 INPP5E MT-expressing cells were examined over two independent experiments for PARD3 e. f Immunoblotting for E-cadherin, β-catenin, claudin-1, and PARD3 in GFP-, INPP5E WT-, or INPP5E MT-expressing HaCaT cells. 180 kDa, 150 kDa, and 100 KDa forms of PARD3 were detected. β-actin was used as the loading control. Immunoblot data shown are representative of two independent experiments with similar results. g Real-time RT-PCR analysis of CDH2 expression levels in GFP-, INPP5E WT-, and INPP5E MT-expressing HaCaT cells. N = 3 for each group. Data are represented as mean ± SD g. The box plots are presented with the elements: center line, median; box limits, Q1 and Q3; whiskers, 1.5× interquartile range. Outliers are also shown. Individual data points are displayed [gray points, data from the first experiments; black points, data from the second experiments b, c, e]. Significance was tested using one-way ANOVA with Tukey-Kramer’s post hoc test b, c, e, g and the two-sided Welch’s t-test c. ****p < 0.0001, *p = 0.0118 (versus GFP-expressing cells or control cells). Scale bars = 20 μm (except for the bottom panels of a) or 50 μm (bottom panels of a). Source data are provided as a Source Data file.
Fig. 3
Fig. 3. PIP5K1A contributes to the maintenance of epithelial characteristics in HaCaT cells.
a, b Real-time RT-PCR analysis of hPIP5K1A, hPIP5K1B, and hPIP5K1C expression in HaCaT cells treated with or without TGFβ1 for 72 h a and hPIP5K1A mRNA expression in HaCaT cells treated with scrambled (Scr) or hPIP5K1A-targeting (#1 and #2) siRNAs b. N = 3 for each group. ***p = 0.0002 (PIP5K1A#1), ***p = 0.0003 (PIP5K1A#2) (versus HaCaT cells treated with scrambled siRNA). c, d Detection of PI(4,5)P2 and F-actin (phalloidin) in HaCaT cells treated with scrambled (Scr) or hPIP5K1A-targeting (PIP5K1A#1 and #2) siRNAs c. Quantitation of the apicolateral plasma membrane (PM) PI(4,5)P2 signals d. In total, 116 Scr, 112 PIP5K1A#1, and 115 PIP5K1A#2 cells were examined over two independent experiments d. e Cell areas of HaCaT cells treated with scrambled (Scr) or hPIP5K1A-targeting (#1 and #2) siRNAs. The average cell area was calculated by analyzing 10 distinct fields of view over two independent experiments. f, g Immunofluorescence detection of E-cadherin (E-cad), β-catenin (β-cat), claudin-1, and PARD3 in HaCaT cells treated with scrambled (Scr) or hPIP5K1A-targeting (PIP5K1A#1 and #2) siRNAs f. Images were taken from different fields of view. Quantification of the PM signals of E-cadherin, β-catenin, claudin-1, and PARD3 g. In total, 102 Scr, 104 PIP5K1A#1, and 112 PIP5K1A#2 cells were examined over two independent experiments for E-cadherin. In total, 117 Scr, 108 PIP5K1A#1, and 105 PIP5K1A#2 cells were examined over two independent experiments for β-catenin. In total, 115 Scr, 108 PIP5K1A#1, and 106 PIP5K1A#2 cells were examined over two independent experiments for claudin-1. In total, 102 Scr, 116 PIP5K1A#1, and 112 PIP5K1A#2 cells were examined over two independent experiments for PARD3 g. h mRNA expression level of CDH2. N = 3 for each group. ***p = 0.0008 (PIP5K1A#1). (versus HaCaT cells treated with scrambled siRNA). Data are represented as mean ± SD a, b, h. The box plots are presented with the elements: center line, median; box limits, Q1 and Q3; whiskers, 1.5× interquartile range. Outliers are also shown. Individual data points are displayed [gray points, data from the first experiments; black points, data from the second experiments d, e, g]. Significance was tested using one-way ANOVA with Tukey-Kramer’s post hoc test b, d, e, g, h and the two-sided Welch’s t-test a. ****p < 0.0001, *p = 0.0413 [versus control cells a and HaCaT cells treated with scrambled siRNA b, d, e, g, h]. Scale bar = 20 μm c, f. Source data are provided as a Source Data file.
Fig. 4
Fig. 4. Elevation of PI(4,5)P2 level partly suppresses TGFβ1-induced loss of epithelial characteristics.
ad Detection of F-actin (phalloidin), PI(4,5)P2, E-cadherin (E-cad), β-catenin (β-cat), claudin-1, and PARD3 in GFP-, Lyn-mPIP5Kwt-GFP (PIP5K WT)-, and Lyn-mPIP5Kmt-GFP (PIP5K MT)-expressing HaCaT cells treated with TGFβ1 for 72 h a. Images of E-cadherin, β-catenin, claudin-1, and PARD3 are taken from different fields of view. Quantification of the apicolateral plasma membrane (PM) PI(4,5)P2 signals b; cell area c; PM signals of E-cadherin, β-catenin, claudin-1, and PARD3 d. In total, 109 GFP-, 100 PIP5K WT-, and 100 PIP5K MT-expressing cells were examined over two independent experiments b. The average cell area was calculated by analyzing either 10 distinct fields of view for control PIP5K WT-, TGFβ1-treated GFP-, PIP5K WT-, and PIP5K MT-expressing cells or 11 distinct fields of view for control GFP- and PIP5K MT-expressing cells over two independent experiments c. **p = 0.0017 (versus GFP-expressing cells) c. In total, 116 GFP-, 113 PIP5K WT-, and 108 PIP5K MT-expressing cells were examined over two independent experiments for E-cadherin. In total, 103 GFP-, 111 PIP5K WT-, and 112 PIP5K MT-expressing cells were examined over two independent experiments for β-catenin. In total, 112 GFP-, 112 PIP5K WT-, and 105 PIP5K MT-expressing cells were examined over two independent experiments for claudin-1. In total, 103 GFP-, 112 PIP5K WT-, and 110 PIP5K MT-expressing cells were examined over two independent experiments for PARD3 d. **p = 0.0046 (versus GFP-expressing cells) d. The box plots are presented with the elements: center line, median; box limits, Q1 and Q3; whiskers, 1.5× interquartile range. Outliers are also shown. e mRNA expression level of CDH2. N = 3 for each group. **p = 0.0066 e (versus TGFβ1-treated GFP-expressing cells). Data are represented as mean ± SD e. Individual data points are displayed [gray points, data from the first experiments; black points, data from the second experiments b, c, d]. Significance was tested using one-way ANOVA with Tukey-Kramer’s post hoc test. ****p < 0.0001 (versus GFP-expressing cells). Scale bar = 30 µm a. Source data are provided as a Source Data file.
Fig. 5
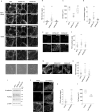
Fig. 5. Depletion of PI(4,5)P2 decreases the plasma membrane cholesterol.
a, b Detection of cholesterol using recombinant mCherry-D4 protein (D4) in GFP-, Lyn-INPP5Ewt-GFP (INPP5E WT)-, and Lyn-INPP5Emt-GFP (INPP5E MT)-expressing HaCaT cells a. Quantification of the plasma membrane (PM) cholesterol abundance b. In total, 103 GFP-, 119 INPP5E WT-, and 104 INPP5E MT-expressing cells were examined over two independent experiments b. c Relative cholesterol levels measured using cholesterol oxidase. Data are represented as mean ± SD c. N = 3 for each group. d, e Detection of cholesterol (D4) in epithelial (HaCaT and NMuMG) and non-epithelial (HDF, Swiss3T3, and U2OS) cell lines d. Quantification of PM cholesterol signals e. In total, 92 HaCaT, 71 NMuMG, 60 HDF, 121 Swiss3T3, 84 U2OS cells were examined over two independent experiments e. f, g Detection of cholesterol (D4) in HaCaT cells treated with or without TGFβ1 for 72 h f. Quantification of PM cholesterol signals g. In total, 100 control and 110 TGFβ1-treated cells were examined over two independent experiments g. h, i Detection of cholesterol (D4), E-cadherin (E-cad), β-catenin (β-cat), claudin-1, and PARD3 in untreated (Vehicle) or U-18666A-treated HaCaT cells h. Phase images are shown (bottom panels). Images were taken from different fields of view. Quantification of E-cadherin, β-catenin, claudin-1, and PARD3 in the PM i. In total, 115 vehicle- and 121 U-18666A-treated cells were examined over two independent experiments for E-cadherin. In total, 110 vehicle- and 120 U-18666A-treated cells were examined over two independent experiments for β-catenin. In total, 115 vehicle- and 120 U-18666A-treated cells were examined over two independent experiments for claudin-1. In total, 115 vehicle- and 120 U-18666A-treated cells were examined over two independent experiments for PARD3 i. The box plots are presented with the elements: center line, median; box limits, Q1 and Q3; whiskers, 1.5× interquartile range. Outliers are also shown. Individual data points are displayed (gray points, data from the first experiments; black points, data from the second experiments b, e, g, i). Significance was tested using one-way ANOVA with Tukey-Kramer’s post hoc test b, e and the two-sided Welch’s t-test g, i. ****p < 0.0001 (versus GFP-expressing cells b, HaCaT cells or NMuMG cells e, untreated cells g, i). Scale bar = 30 μm (a, d, f, h except for the bottom panels of h) or 50 μm (bottom panels of h). Source data are provided as a Source Data file.
Fig. 6
Fig. 6. Plasma membrane PARD3 regulates epithelial characteristics.
a Immunoblotting for PARD3 in HaCaT cells treated with scrambled (Scr) or PARD3-targeting (PARD3#1 and #2) siRNAs. 180 kDa, 150 kDa, and 100 KDa forms of PARD3 were detected. β-actin was used as the loading control. Immunoblot data shown were representative of two independent experiments with similar results. b, c Detection of E-cadherin (E-cad), β-catenin (β-cat), claudin-1, and cholesterol (D4) in HaCaT cells treated with scrambled (Scr) or PARD3-targeting (PARD3#1 and #2) siRNAs b. Images were taken from different fields of view. Quantification of the plasma membrane (PM) signals of E-cadherin, β-catenin, claudin-1, and cholesterol c. In total, 103 Scr, 119 PARD3#1, and 111 PARD3#2 cells were examined over two independent experiments for E-cadherin. In total, 125 Scr, 104 PARD3#1, and 107 PARD3#2 cells were examined over two independent experiments for β-catenin. In total, 113 Scr, 113 PARD3#1, and 102 PARD3#2 cells were examined over two independent experiments for claudin-1. In total, 114 Scr, 152 PARD3#1, and 136 PARD3#2 cells were examined over two independent experiments for cholesterol c. The box plots are presented with the elements: center line, median; box limits, Q1 and Q3; whiskers, 1.5× interquartile range. Outliers are also shown. Individual data points are displayed (gray points, data from the first experiments; black points, data from the second experiments). Significance was tested using one-way ANOVA with Tukey-Kramer’s post hoc test. ****p < 0.0001 (versus HaCaT cells treated with scrambled siRNA). Scale bar = 30 μm b. Source data are provided as a Source Data file.
Fig. 7
Fig. 7. Elevation of PI(4,5)P2 level confers epithelial characteristics to U2OS cells.
af Detection of PI(4,5)P2 a, F-actin (phalloidin) a, cholesterol (D4) a, E-cadherin (E-cad) e, and N-cadherin (N-cad) e. Phase images are shown a. Quantification of PM PI(4,5)P2 signals b, cell areas c, plasma membrane (PM) cholesterol signals d, and PM N-cadherin signals f of GFP-, Lyn-mPIP5Kwt-GFP (PIP5K WT)-, and Lyn-mPIP5Kmt-GFP (PIP5K MT)-expressing U2OS cells. In total, 107 GFP-, 101 PIP5K WT-, and 112 PIP5K MT-expressing cells were examined over two independent experiments b. The average cell area was calculated by analyzing 15 distinct fields of view over two independent experiments c. ***p = 0.0003 (versus GFP-expressing cells) c. In total, 111 GFP-, 102 PIP5K WT-, and 107 PIP5K MT-expressing cells were examined over two independent experiments d. In total, 112 GFP-, 108 PIP5K WT-, and 105 PIP5K MT-expressing cells were examined over two independent experiments f. g, h Detection of PARD3 in GFP-, PIP5K WT-, and PIP5K MT-expressing U2OS cells g. Quantification of PM PARD3 signals h. In total, 110 GFP-, 108 PIP5K WT-, and 105 PIP5K MT-expressing cells were examined over two independent experiments h. i Immunoblotting of N-cadherin and PARD3 in GFP-, PIP5K WT-, and PIP5K MT-expressing U2OS cells. 180 kDa, 150 kDa, and 100 KDa forms of PARD3 were detected. β-actin was used as the loading control. Immunoblot data shown are representative of two independent experiments with similar results. j, k Detection of N-cadherin (N-cad), Lyn-hPARD3 (710–1089)-V5 (V5), and F-actin (phalloidin) in U2OS cells with or without Lyn-hPARD3 (710–1089)-V5 (Vector and Lyn-PARD3, respectively) j. Quantification of N-cadherin PM signals k. In total, 107 vector- and 105 Lyn-PARD3-expressing cells were examined over two independent experiments k. l Cell areas of U2OS cells with or without Lyn-hPARD3 (710–1089)-V5 (Vector and Lyn-PARD3, respectively). The average cell area was calculated by analyzing five distinct fields of view over two independent experiments l. The box plots are presented with the elements: center line, median; box limits, Q1 and Q3; whiskers, 1.5× interquartile range. Outliers are also shown. Individual data points are displayed (gray points, data from the first experiments; black points, data from the second experiments). Significance was tested using one-way ANOVA with Tukey-Kramer’s post hoc test b, c, d, f, h and the two-sided Welch’s t-test k, l. ****p < 0.0001 (versus GFP-expressing cells or cells with empty vector). Scale bar = 30 μm (except for the bottom panels of a) or 50 μm (bottom panels of a). Source data are provided as a Source Data file.

Similar articles

Cited by

References

    1. Müller HA. Of mice, frogs and flies: generation of membrane asymmetries in early development. Dev. Growth Differ. 2001;43:327–342. doi: 10.1046/j.1440-169x.2001.00587.x. - DOI - PubMed
    1. Yamanaka Y, Ralston A, Stephenson RO, Rossant J. Cell and molecular regulation of the mouse blastocyst. Dev. Dyn. 2006;235:2301–2314. doi: 10.1002/dvdy.20844. - DOI - PubMed
    1. Hay ED. The mesenchymal cell, its role in the embryo, and the remarkable signaling mechanisms that create it. Dev. Dyn. 2005;233:706–720. doi: 10.1002/dvdy.20345. - DOI - PubMed
    1. Solnica-Krezel L. Conserved patterns of cell movements during vertebrate gastrulation. Curr. Biol. 2005;15:R213–R228. doi: 10.1016/j.cub.2005.03.016. - DOI - PubMed
    1. Thiery JP, Acloque H, Huang RY, Nieto MA. Epithelial-mesenchymal transitions in development and disease. Cell. 2009;139:871–890. doi: 10.1016/j.cell.2009.11.007. - DOI - PubMed

Publication types

MeSH terms

Substances