. 2022 May 10;8(1):41.
doi: 10.1038/s41421-022-00389-z.

Decoding the pathogenesis of Diamond-Blackfan anemia using single-cell RNA-seq

Affiliations

Decoding the pathogenesis of Diamond-Blackfan anemia using single-cell RNA-seq

Bingrui Wang et al. Cell Discov. .

Abstract

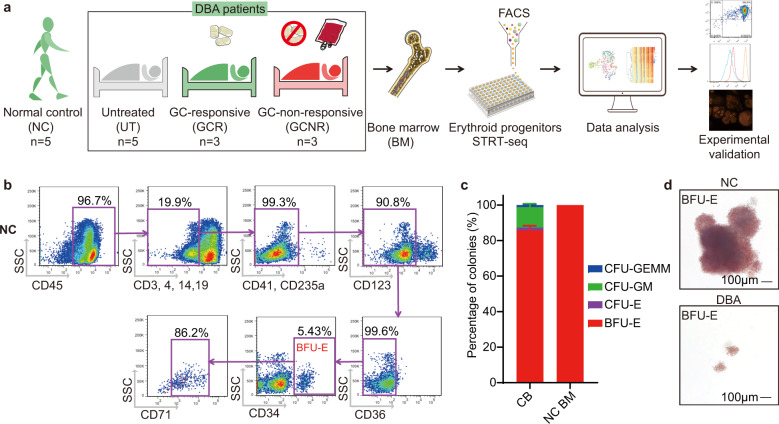
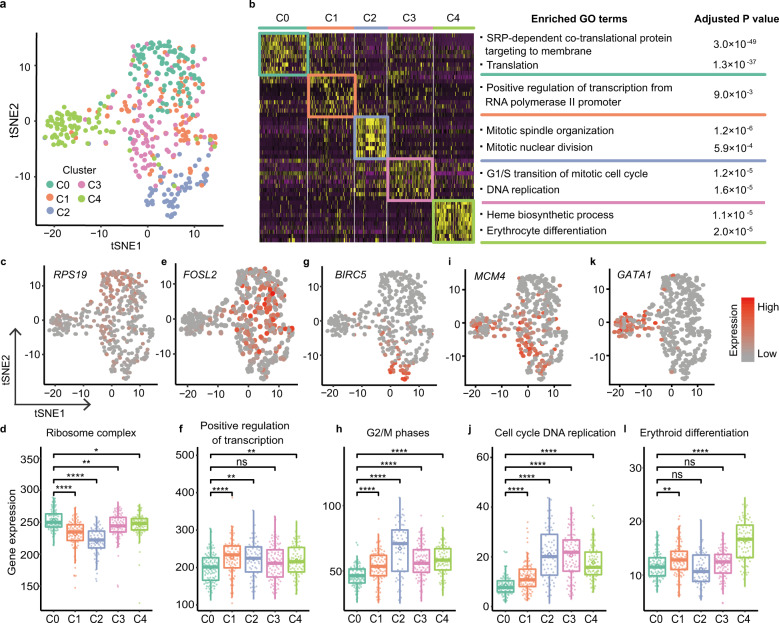
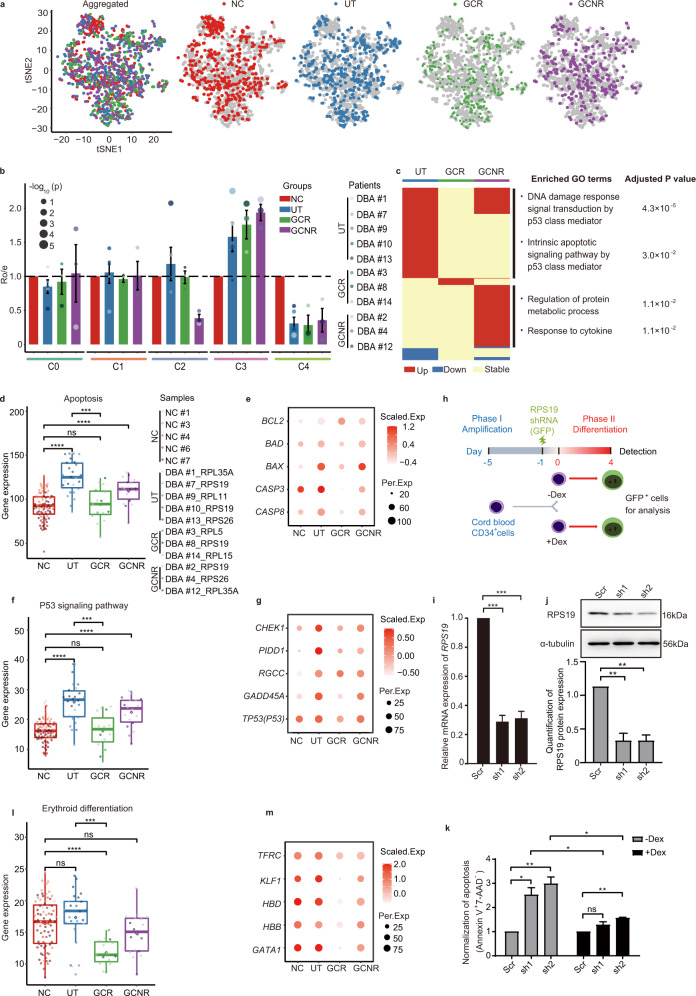
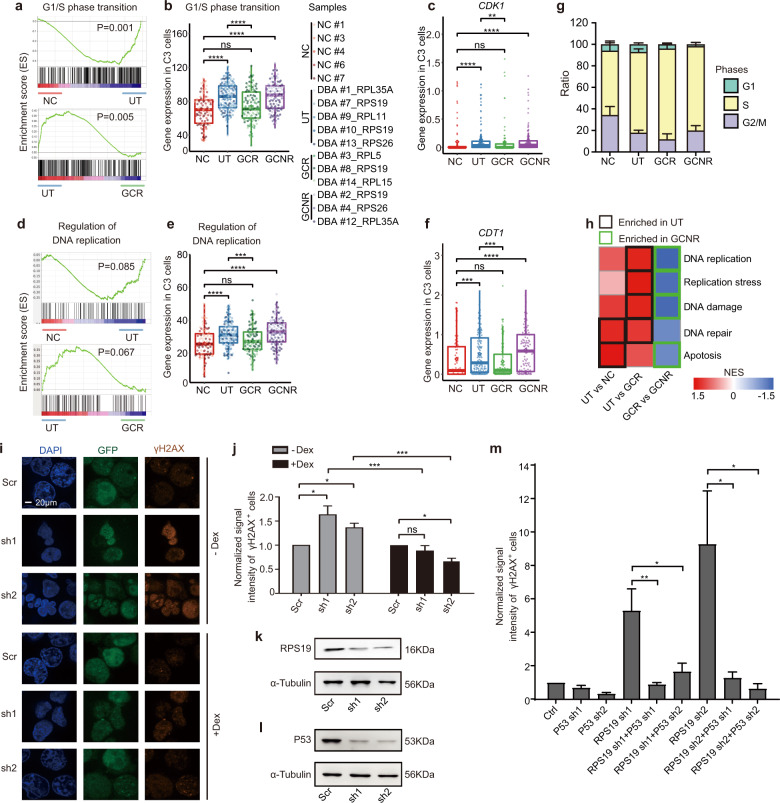
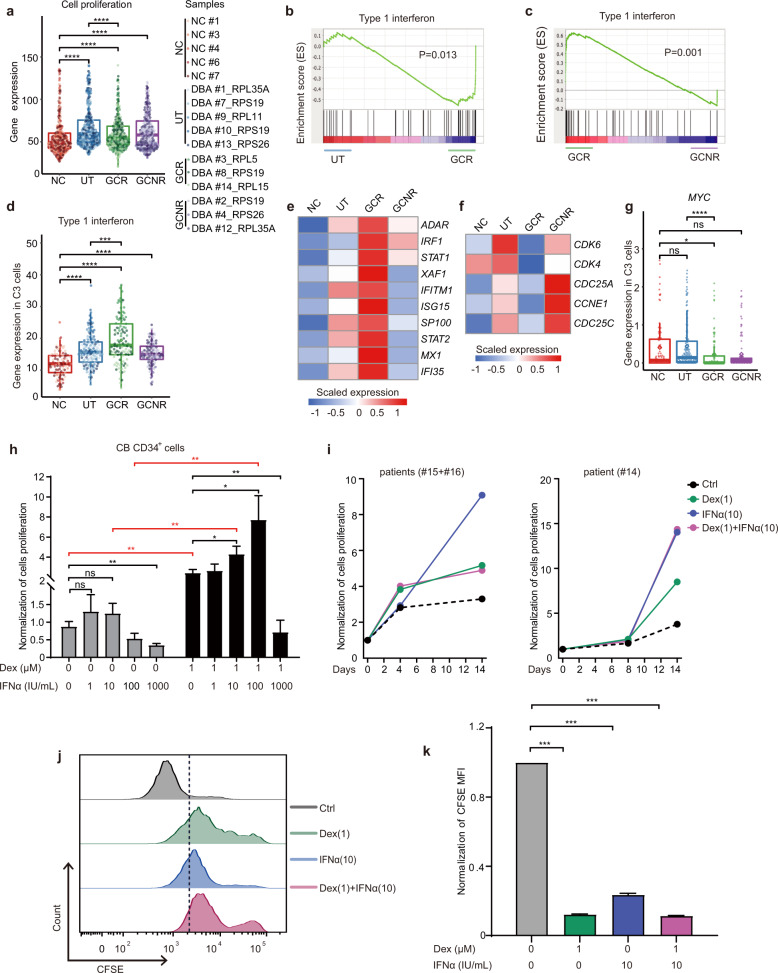
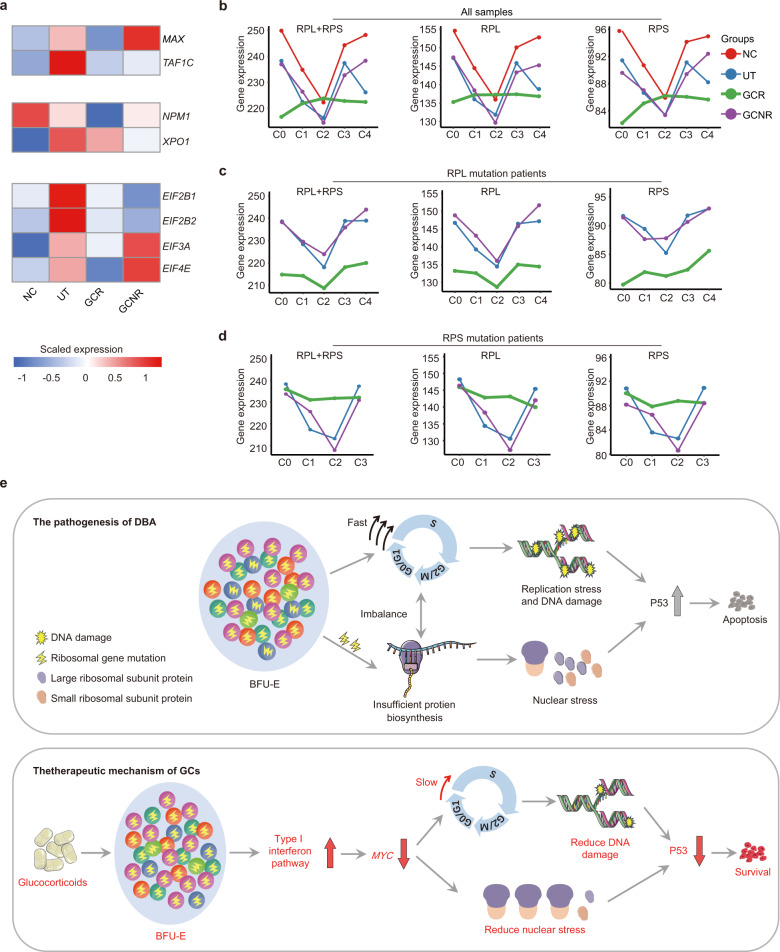
Ribosomal protein dysfunction causes diverse human diseases, including Diamond-Blackfan anemia (DBA). Despite the universal need for ribosomes in all cell types, the mechanisms underlying ribosomopathies, which are characterized by tissue-specific defects, are still poorly understood. In the present study, we analyzed the transcriptomes of single purified erythroid progenitors isolated from the bone marrow of DBA patients. These patients were categorized into untreated, glucocorticoid (GC)-responsive and GC-non-responsive groups. We found that erythroid progenitors from untreated DBA patients entered S-phase of the cell cycle under considerable duress, resulting in replication stress and the activation of P53 signaling. In contrast, cell cycle progression was inhibited through induction of the type 1 interferon pathway in treated, GC-responsive patients, but not in GC-non-responsive patients. Notably, a low dose of interferon alpha treatment stimulated the production of erythrocytes derived from DBA patients. By linking the innately shorter cell cycle of erythroid progenitors to DBA pathogenesis, we demonstrated that interferon-mediated cell cycle control underlies the clinical efficacy of glucocorticoids. Our study suggests that interferon administration may constitute a new alternative therapeutic strategy for the treatment of DBA. The trial was registered at www.chictr.org.cn as ChiCTR2000038510.


Conflict of interest statement

The authors declare no competing interests.

Figures

Fig. 1
Fig. 1. BM erythroid progenitors in DBA patients show compromised growth.
a Schematic illustrating the experimental workflow. Bone marrow (BM) erythroid progenitors from healthy individuals (acting as normal controls, NC) and DBA patients, who were subcategorized into untreated (UT), glucocorticoid (GC)-responsive (GCR) and GC-non-responsive (GCNR) groups, were sorted using flow cytometry and processed for single-cell RNA-seq (scRNA-seq) using modified STRT-seq, followed by data analyses and experimental validation. b Representative FACS plots showing the gating strategies used for isolation of BFU-E cells from NCs, which were immunophenotypically defined as CD45+CD3CD4CD14CD19CD41CD235aCD123CD36CD34+. c The percentage of colonies generated from FACS-sorted cells (BFU-E: CD45+CD3CD4CD14CD19CD41CD235aCD123CD36CD34+) from cord blood (CB) and BM mononuclear cells. We seeded the sorted cells from the CB of three individuals and BM of one individual due to the limited healthy BM sample. Results are represented as mean ± SEM. d Micrographs of representative BFU-E colonies differentiated from sorted BFU-E cells of NC and DBA UT patients on day 14 of the colony forming unit assay. Scale bars, 100 μm. See also Supplementary Fig. S1, Tables S1, 2.
Fig. 2
Fig. 2. Erythroid progenitors in normal individuals are heterogeneous.
a t-SNE visualization of distinct cell clusters of normal control (NC) BFU-E cells. b Heatmap (left) showing top ten marker genes and the enriched top GO terms (right) of each cluster. c, e, g, i, k The indicated marker genes of each cluster are color-coded and shown on t-SNE plots. d, f, h, j and l Beeswarm plots depict the expression of the indicated gene sets across clusters. Each dot represents the expression value of a single cell that was calculated by summing the log2 transformed UMI of every gene within the gene set. The diamond represents the mean expression value for each cluster, and the box represents the median and quartiles. P values were determined using Wilcoxon rank sum tests. ****P ≤ 0.0001, **P ≤ 0.01 and *P ≤ 0.05, ns, no significance. See also Supplementary Fig. S2 and Tables S3–S6.
Fig. 3
Fig. 3. Glucocorticoid treatment qualitatively improves the erythroid-primed C4 subpopulation by reducing apoptosis.
a t-SNE visualization of aggregated cells (Aggregated), cells from the normal controls (NC, red) and cells from the individual DBA groups (UT, dark blue; GCR, green; GCNR, purple). b Bar plot showing the ratio of observed to expected numbers of cells (Ro/e) in each cluster of each group (NC, red; UT, dark blue; GCR, green; GCNR, purple). The colored dots indicate the individual patients and dot size represents log10 transformed P values (Chi-square test). Error bars represent the SEM. c Heatmap (left) showing the differentially expressed genes during C4 in the UT, GCR and GCNR groups compared with the NC counterparts. Upregulated genes, downregulated genes and genes without significant changes are indicated in red, blue and yellow, respectively. The right panel shows the enriched GO terms between NC and UT or GCNR. d Beeswarm plots depict the expression of the gene set of apoptosis. The controls and patients in each group are presented and have been individually color-coded. e Dot plots of representative apoptosis-associated genes across groups. The scaled expression value (Scaled.Exp) and percentage of expressing cells (Per.Exp) from each group are depicted. f Expression of the entire gene set of the P53 signaling pathway. g Dot plots of representative genes in the P53 signaling pathway across groups. The scaled expression value and percentage of expressing cells from each group are depicted. h Schematic illustrating the two-phase erythroid differentiation culture and lentiviral shRNA vector (containing a GFP expression cassette) infection of cord blood CD34+ HSPCs. Four days after initiation of the 2nd differentiation phase, GFP+ cells were sorted for further analyses. i The level of RPS19 mRNA detected using RT-qPCR in GFP+ cells infected with scrambled control (Scr) or RPS19 shRNA lentivirus (sh1 or sh2). ACTB serves as the internal control. j The upper panel shows RPS19 protein expression detected using Western blot in GFP+ cells infected with scrambled control (Scr) or RPS19 shRNA lentivirus (sh1 or sh2). α-tubulin serves as the loading control. The bottom panel indicates the corresponding quantification of RPS19 protein expression. k Bar graph showing the apoptotic level (measured by the percentage Annexin V+7-AAD cells) in RPS19-depleted erythroid cells cultured with or without Dex, which was normalized to the scramble (Scr) control. l The expression of the entire gene set of erythroid differentiation across groups. m Dot plots of representative genes related to erythroid differentiation across groups. The scaled expression value and percentage of expressing cells from each group are depicted. For the bar graphs (i, j, k), results are presented as the mean ± SEM. P values were determined by Student’s t test. ***P < 0.001, **P < 0.01 and *P < 0.05; ns, no significance. n ≥ 3 independent experiments. For all the beeswarm plots (d, f, and l), the controls and patients in each group are presented and color-coded individually. Each dot represents the expression value for each single cell that was calculated by summing the log2 transformed UMI of every gene within the gene set. Diamonds represent mean expression values for each cluster, and boxes represent the median and quartiles. P values were determined by Wilcoxon rank sum test. ****P ≤ 0.0001 and ***P ≤ 0.001, ns, no significance. See also Supplementary Figs. S3, 4 and Supplementary Table S6.
Fig. 4
Fig. 4. Untreated DBA erythroid progenitor cells are forced to progress into the cell cycle.
a GSEA of G1/S phase transition in C4 between the NC and UT, and the UT and GCR groups. b Beeswarm plot showing the expression of the G1/S phase transition gene set in C3 among the samples. c CDK1 expression in C3 is shown among groups. d GSEA of regulation of DNA replication between the NC and UT and the UT and GCR groups. e Beeswarm plot showing the expression of the DNA replication gene set in C3 among the samples. f The expression of CDT1 in C3 is shown among groups. g The fraction of cells in G1, S and G2/M in C3 among groups. h Heatmap representing normalized enrichment score (NES) from GSEA for comparison between the indicated groups in C3 cells at the S-phase of cell cycle; the colored rectangles indicate significant enrichment (namely, higher expression) of corresponding processes in the designated groups (P < 0.05). i Immunofluorescence measuring DNA damage with γH2AX expression in RPS19-diminished primary erythroid cells on day 4 of differentiation with or without Dex treatment. j Quantification of immunofluorescent intensity of γH2AX. The signal intensity of RPS19- depleted cells was normalized to the scramble (Scr) control. k, l Western blot analysis showing the protein expression of RPS19 (k) and P53 (l) after lentiviral- mediated shRNA knockdown in erythroid cells derived from CB-CD34+ cells on day 8 of differentiation. α-tubulin serves as the loading control. n = 3 independent experiments. m Quantification of immunofluorescent intensity of γH2AX in erythroid cells derived from CB-CD34+ cells on day 8 of differentiation. The signal intensity of each group (RPS19 single, P53 single or their double depleted cells) was normalized to the corresponding control. For (j and m), results are presented as the mean ± SEM. P values were determined using Student’s t test, ***P < 0.001; *P < 0.05;ns, no statistical significance. n ≥ 3 independent experiments. For all the beeswarm plots (b, c, e and f), each dot represents the expression value for each single cell that was calculated by summing the log2 transformed UMI of every gene within the gene set. Diamonds represent mean expression values for each cluster, and boxes represent the median and quartiles. P values were determined using Wilcoxon rank sum tests. ****P ≤ 0.0001, ***P ≤ 0.001 and **P ≤ 0.01; ns, no significance. See also Supplementary Figs. S5,6 and Table S6.
Fig. 5
Fig. 5. Glucocorticoid treatment attenuates cell proliferation by elevating IFN signaling.
a Proliferation scores were estimated for all groups. b, c GSEA of type 1 interferon in C3 cells comparing UT to GCR (b) and GCR to GCNR (c) groups. d Beeswarm plot showing the expression of type 1 interferon in C3 among different groups. e Heatmap illustrating scaled expression of key genes in the type 1 interferon signaling pathway in C3 cells from the NC, UT, GCR and GCNR groups. f Heatmap showing scaled expression of cell cycle mediators in C3 of NC, UT, GCR and GCNR groups. g The expression of MYC in C3 is shown among groups. h The proliferation of RPS19-depleted, cord blood-derived erythroid cells treated with either IFNα or Dex alone, or their combination, assessed on day 4 of erythroid differentiation. Proliferation was normalized to the non-treated control cells. i Time course growth curves of patient-derived BM-CD34+ cells during erythroid differentiation, cultured either with Dex or IFNα alone, or their combination. Due to the limited cells available from the patients, we occasionally combined the patient samples together. j Representative FACS plots of CFSE staining in GCR patient-derived BM-CD34+ cells cultured either with Dex or IFNα alone or in their combination on day 8 of erythroid differentiation. k Quantification of (j). The MFI of each group of cells was normalized to that of non-treated control cells. For (h and k), the error bars represent the SEM and P values were determined using Student’s t tests. ***P < 0.001; **P < 0.01 and *P < 0.05. n = 3 biological replicates. For the beeswarm plots (a, d and g), each dot represents the expression value that was calculated by summing the log2 transformed UMI of every gene within the gene set of a single cell. Diamonds represent mean expression values for each cluster, and boxes represent the median and quartiles. P values were determined using Wilcoxon rank sum tests. ****P ≤ 0.0001, ***P ≤ 0.001 and *P ≤ 0.05; ns, no significance. See also Supplementary Fig. S7 and Table S6.
Fig. 6
Fig. 6. Reduced ribosomal stress attributes to the protective effect of glucocorticoids.
a Heatmap showing the scaled expression of key regulators and/or effectors associated with ribosomal transcription (MAX and TAF1C), ribosomal processing and transporter (NPM1 and XPO1) and translation initiator (EIF2B1, EIF2B2, EIF3A, and EIF4E) in C3 of all groups. bd Line graphs showing the expression dynamics of total ribosomal protein genes (RPL + RPS), large ribosomal protein genes (RPL) and small ribosomal protein genes (RPS) in all (b), RPL mutant (c) and RPS mutant (d) samples across clusters. Different donor types are coded with the indicated color. e A hypothetical model illustrating altered biological processes that lead to cellular distress and pathogenesis of DBA (upper). The imbalance between the innate fast cell cycle and insufficient protein biosynthesis, which results from RP mutation, could trigger DNA replication stress in the BFU-E cells of DBA patients; and concomitantly elicit DNA damage-induced P53 activation and apoptosis. The lower panel shows a proposed schematic of the therapeutic mechanism of GCs. GC administration elevates IFN signaling, which attenuates cell proliferation by regulating the activity of cell cycle regulators and modulators (e.g., MYC, CDK4, and CDK6). It also alleviates ribosomal stress via the repression of MYC, thereby rectifying the imbalance and ultimately ameliorating apoptosis and promoting cell survival.

Similar articles

Cited by

References

    1. Lipton JM, Ellis SR. Diamond-Blackfan anemia: diagnosis, treatment, and molecular pathogenesis. Hematol. Oncol. Clin. North Am. 2009;23:261–282. doi: 10.1016/j.hoc.2009.01.004. - DOI - PMC - PubMed
    1. Fargo JH, et al. Erythrocyte adenosine deaminase: diagnostic value for Diamond-Blackfan anaemia. Br. J. Haematol. 2013;160:547–554. doi: 10.1111/bjh.12167. - DOI - PMC - PubMed
    1. Halperin DS, Freedman MH. Diamond-blackfan anemia: etiology, pathophysiology, and treatment. Am. J. Pediatr. Hematol. Oncol. 1989;11:380–394. - PubMed
    1. Iskander D, et al. Elucidation of the erythroid progenitor defect in Diamond-Blackfan Anemia by characterization and prospective isolation of human erythroid progenitors. Blood. 2015;125:2553–2557. doi: 10.1182/blood-2014-10-608042. - DOI - PubMed
    1. Nathan DG, Clarke BJ, Hillman DG, Alter BP, Housman DE. Erythroid precursors in congenital hypoplastic (Diamond-Blackfan) anemia. J. Clin. Investig. 1978;61:489–498. doi: 10.1172/JCI108960. - DOI - PMC - PubMed