

Contribution of rare whole-genome sequencing variants to plasma protein levels and the missing heritability
- PMID: 35534486
- PMCID: PMC9085767
- DOI: 10.1038/s41467-022-30208-8
Contribution of rare whole-genome sequencing variants to plasma protein levels and the missing heritability
Abstract
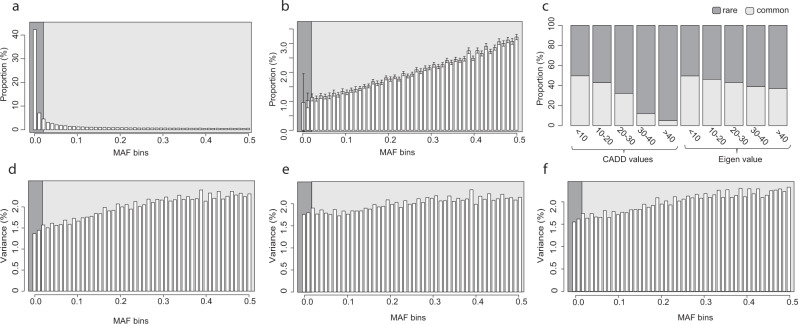
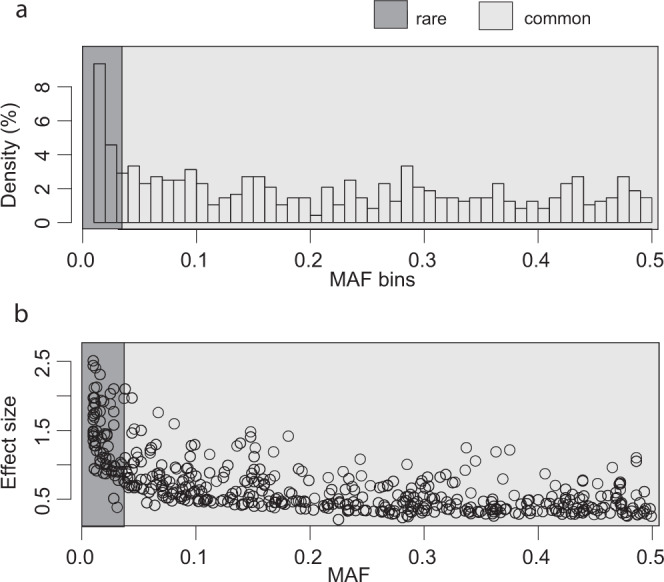
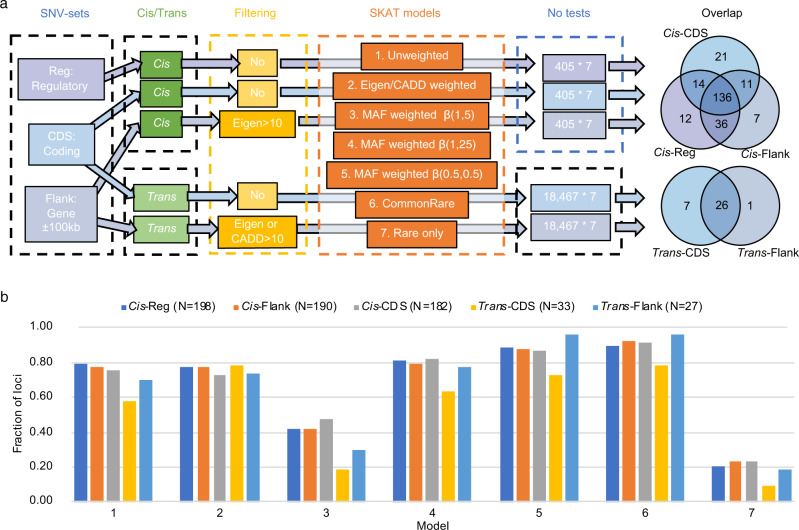
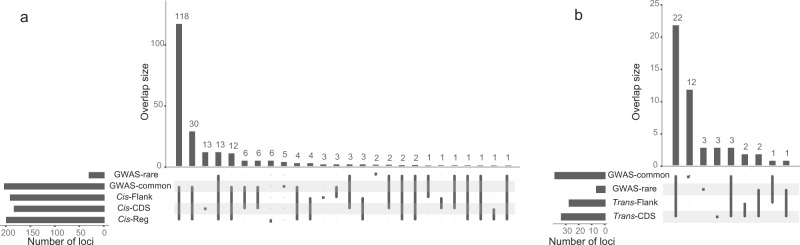
Despite the success of genome-wide association studies, much of the genetic contribution to complex traits remains unexplained. Here, we analyse high coverage whole-genome sequencing data, to evaluate the contribution of rare genetic variants to 414 plasma proteins. The frequency distribution of genetic variants is skewed towards the rare spectrum, and damaging variants are more often rare. We estimate that less than 4.3% of the narrow-sense heritability is expected to be explained by rare variants in our cohort. Using a gene-based approach, we identify Cis-associations for 237 of the proteins, which is slightly more compared to a GWAS (N = 213), and we identify 34 associated loci in Trans. Several associations are driven by rare variants, which have larger effects, on average. We therefore conclude that rare variants could be of importance for precision medicine applications, but have a more limited contribution to the missing heritability of complex diseases.
© 2022. The Author(s).
Conflict of interest statement
The authors declare no competing interests.
Figures
Similar articles
-
Inferring the Nature of Missing Heritability in Human Traits Using Data from the GWAS Catalog.Genetics. 2019 Jul;212(3):891-904. doi: 10.1534/genetics.119.302077. Epub 2019 May 13. Genetics. 2019. PMID: 31123044 Free PMC article.
-
Contrasting the Genetic Architecture of 30 Complex Traits from Summary Association Data.Am J Hum Genet. 2016 Jul 7;99(1):139-53. doi: 10.1016/j.ajhg.2016.05.013. Epub 2016 Jun 23. Am J Hum Genet. 2016. PMID: 27346688 Free PMC article.
-
Polygenic architecture of rare coding variation across 394,783 exomes.Nature. 2023 Feb;614(7948):492-499. doi: 10.1038/s41586-022-05684-z. Epub 2023 Feb 8. Nature. 2023. PMID: 36755099 Free PMC article.
-
Methods for the Analysis and Interpretation for Rare Variants Associated with Complex Traits.Curr Protoc Hum Genet. 2019 Apr;101(1):e83. doi: 10.1002/cphg.83. Epub 2019 Mar 8. Curr Protoc Hum Genet. 2019. PMID: 30849219 Free PMC article. Review.
-
Research review: Polygenic methods and their application to psychiatric traits.J Child Psychol Psychiatry. 2014 Oct;55(10):1068-87. doi: 10.1111/jcpp.12295. Epub 2014 Aug 1. J Child Psychol Psychiatry. 2014. PMID: 25132410 Review.
Cited by
-
Common host variation drives malaria parasite fitness in healthy human red cells.Elife. 2021 Sep 23;10:e69808. doi: 10.7554/eLife.69808. Elife. 2021. PMID: 34553687 Free PMC article.
-
Unravelling the genetic architecture of human complex traits through whole genome sequencing.Nat Commun. 2023 Jun 14;14(1):3520. doi: 10.1038/s41467-023-39259-x. Nat Commun. 2023. PMID: 37316478 Free PMC article.
-
Genetic determinants of plasma protein levels in the Estonian population.Sci Rep. 2024 Apr 2;14(1):7694. doi: 10.1038/s41598-024-57966-3. Sci Rep. 2024. PMID: 38565889 Free PMC article.
-
Rare variant associations with plasma protein levels in the UK Biobank.Nature. 2023 Oct;622(7982):339-347. doi: 10.1038/s41586-023-06547-x. Epub 2023 Oct 4. Nature. 2023. PMID: 37794183 Free PMC article.
-
Copy number variations and their effect on the plasma proteome.Genetics. 2023 Dec 6;225(4):iyad179. doi: 10.1093/genetics/iyad179. Genetics. 2023. PMID: 37793096 Free PMC article.
References
Publication types
MeSH terms
Substances
LinkOut - more resources
Full Text Sources
