. 2022 May 9;13(1):2522.
doi: 10.1038/s41467-022-30240-8.

Gut microbiota regulates acute myeloid leukaemia via alteration of intestinal barrier function mediated by butyrate

Affiliations

Gut microbiota regulates acute myeloid leukaemia via alteration of intestinal barrier function mediated by butyrate

Ruiqing Wang et al. Nat Commun. .

Abstract

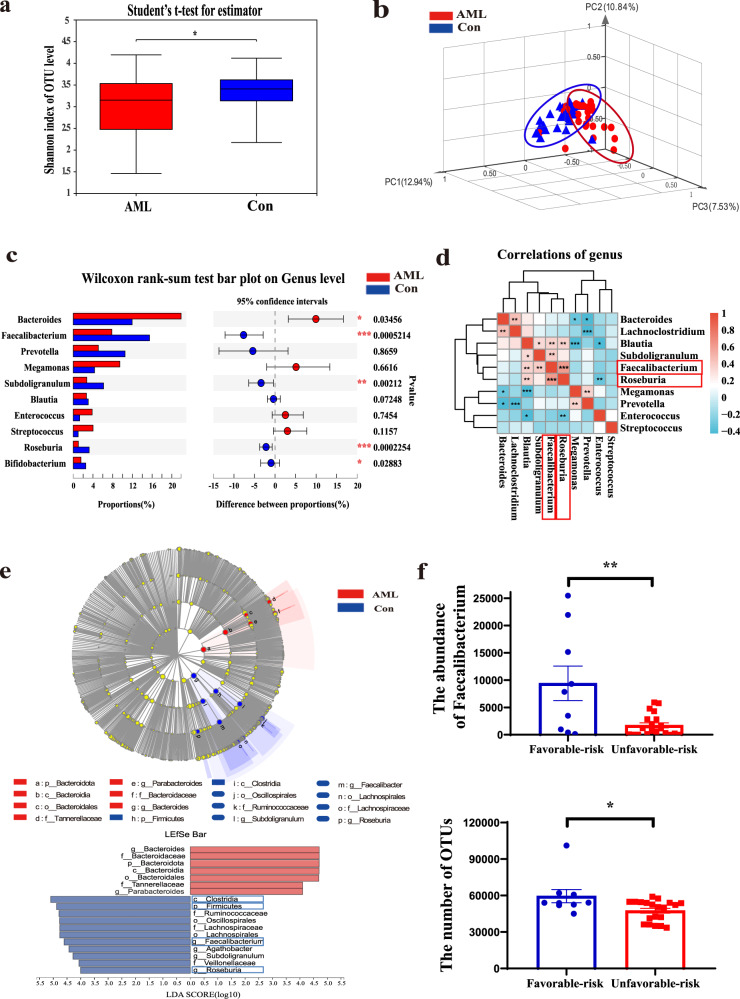
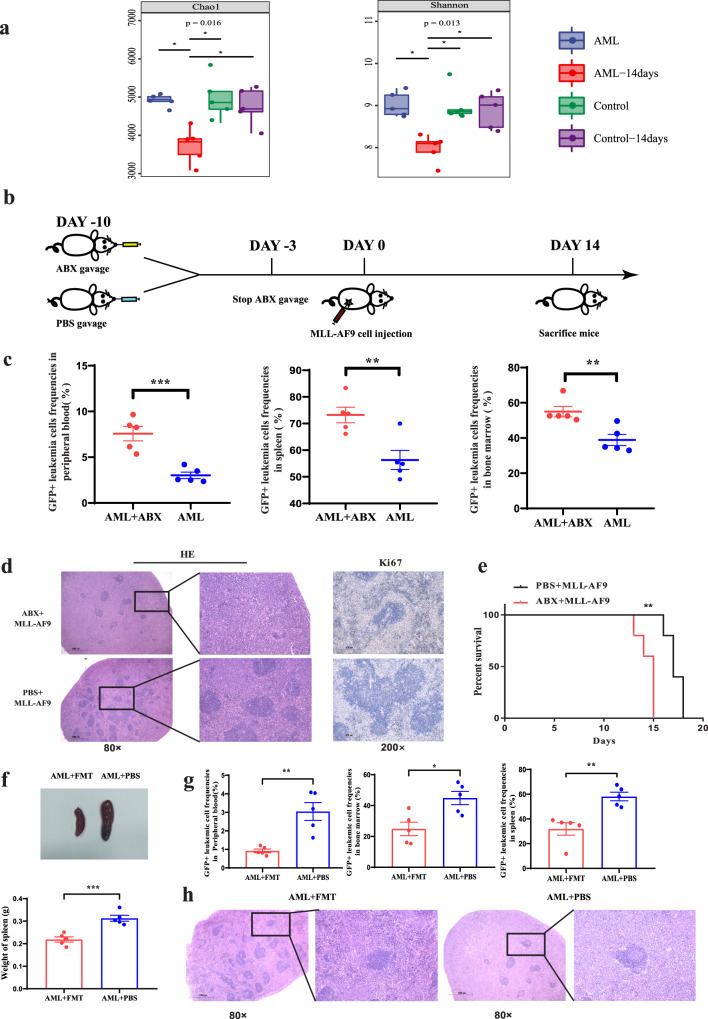
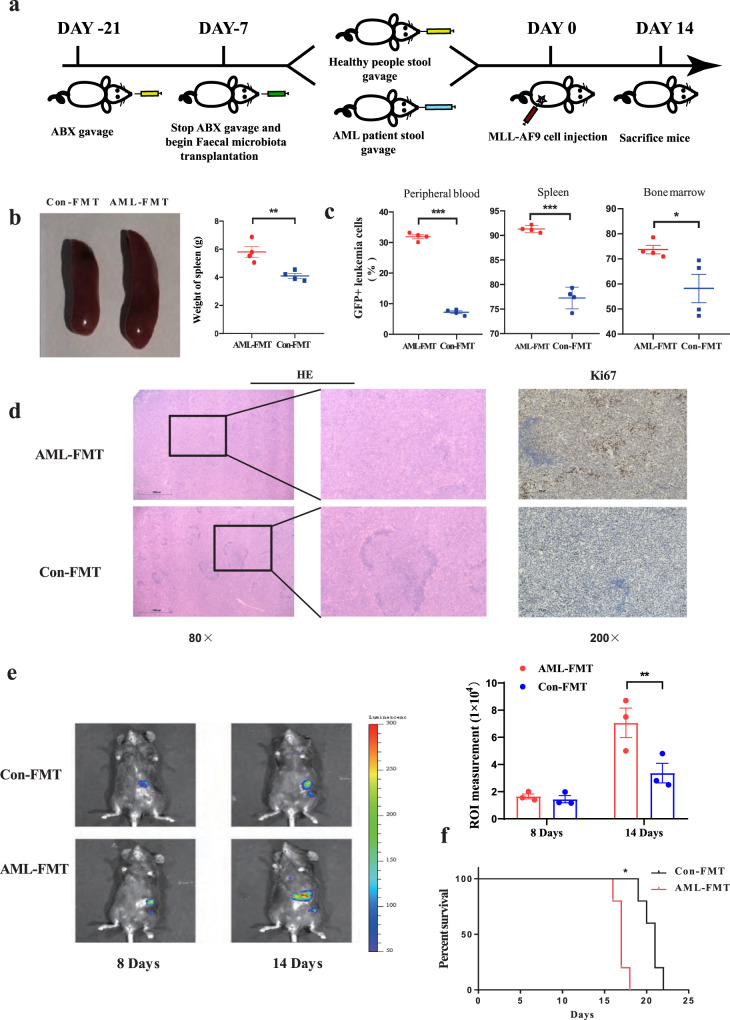
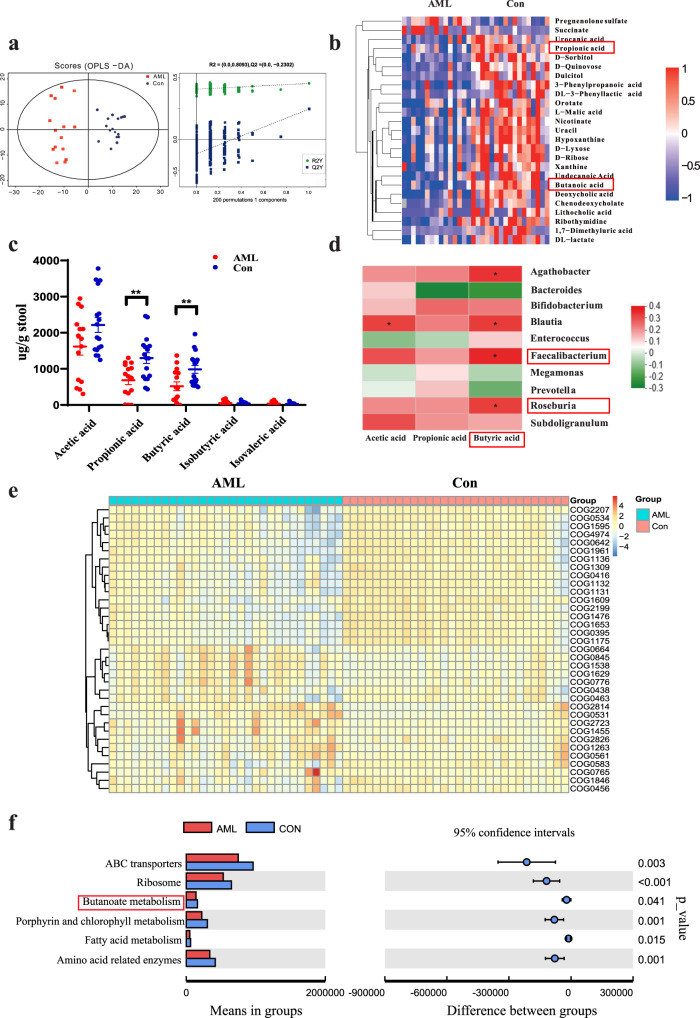
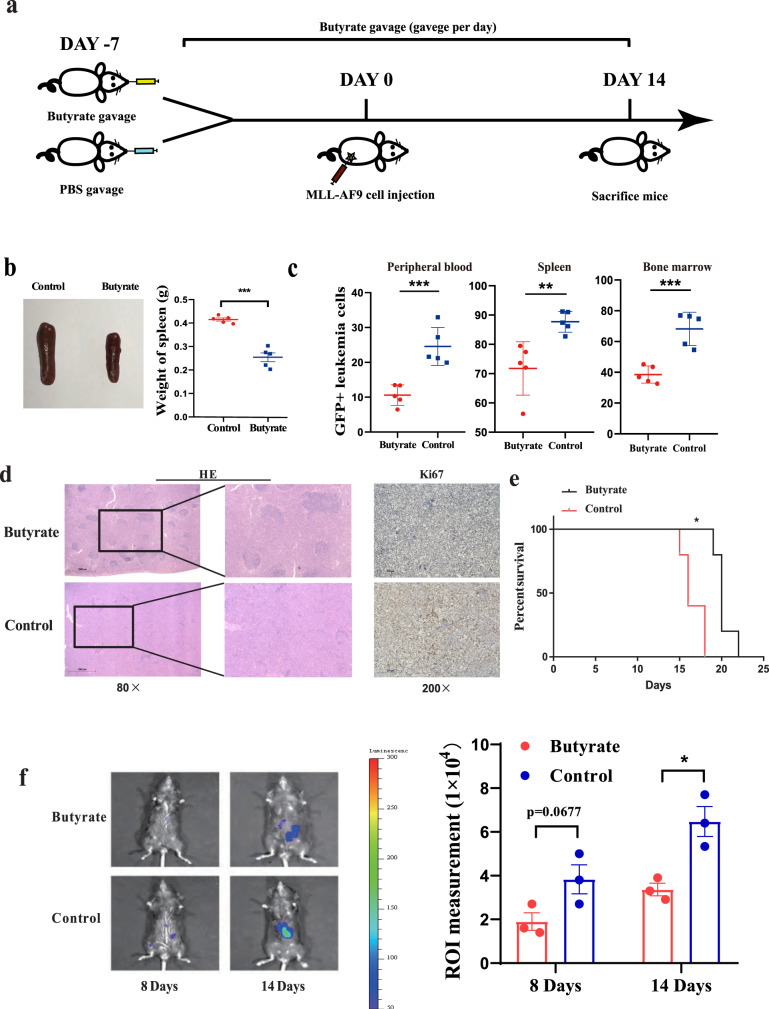
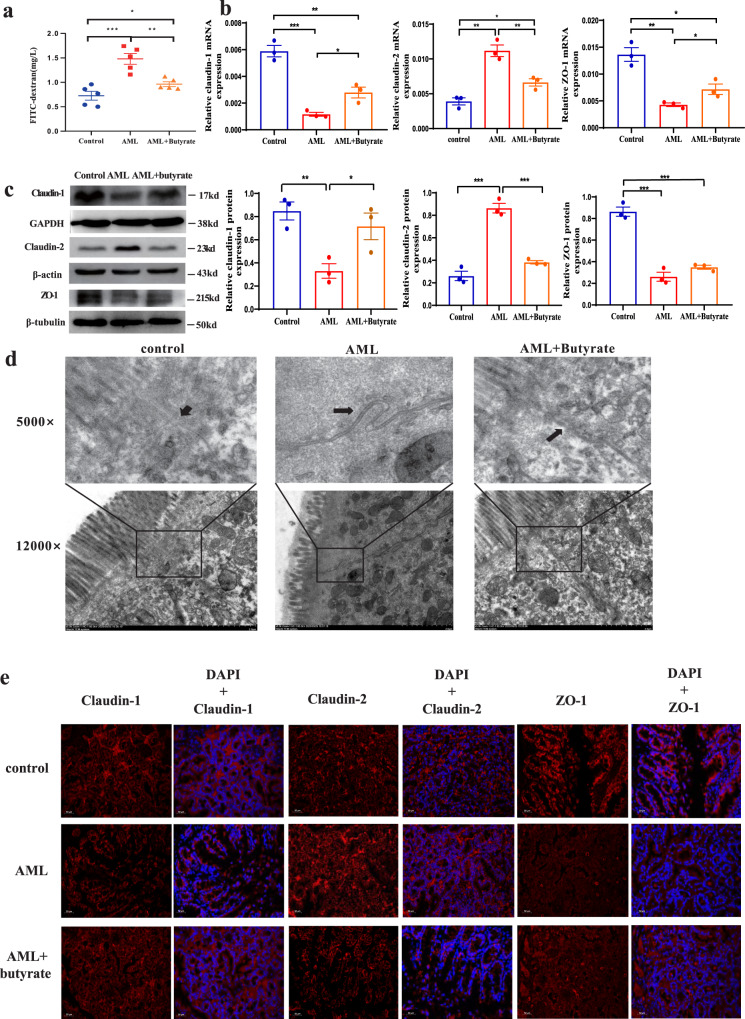
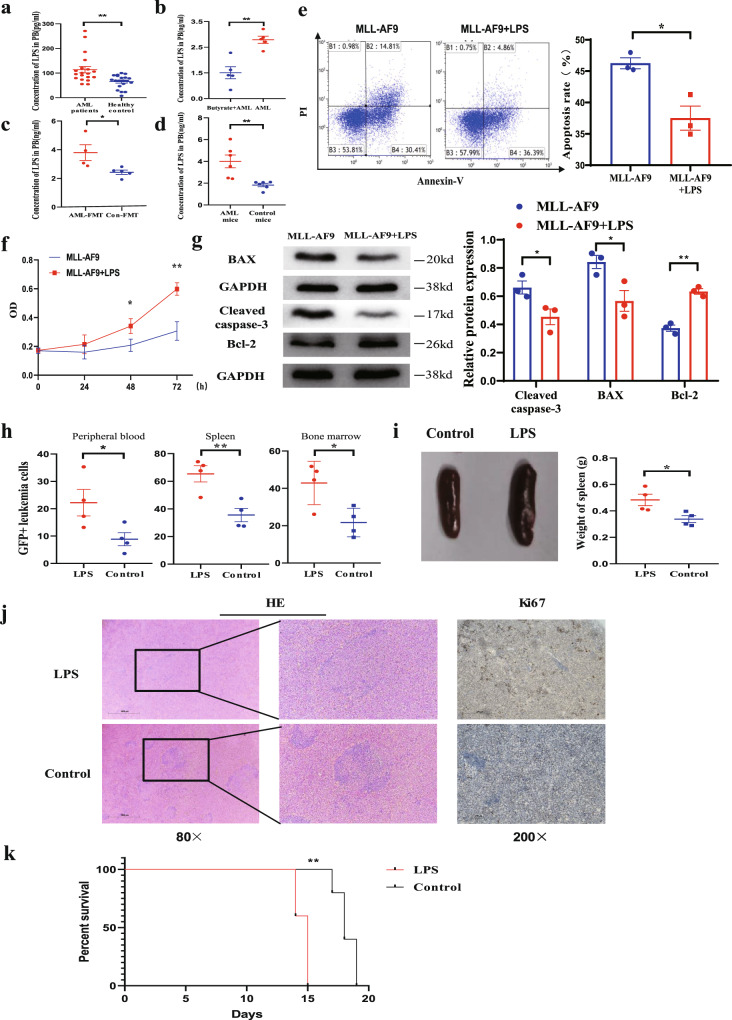
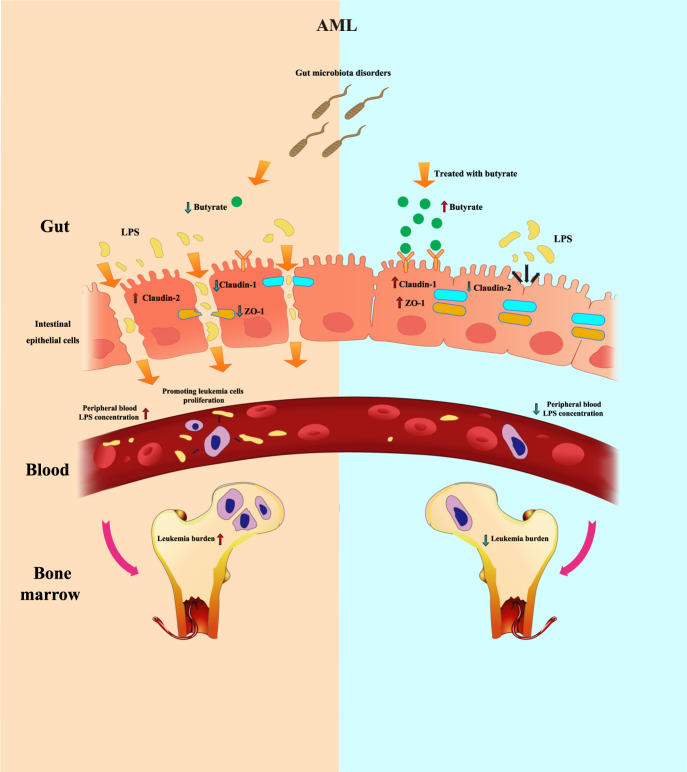
The gut microbiota has been linked to many cancers, yet its role in acute myeloid leukaemia (AML) progression remains unclear. Here, we show decreased diversity in the gut microbiota of AML patients or murine models. Gut microbiota dysbiosis induced by antibiotic treatment accelerates murine AML progression while faecal microbiota transplantation reverses this process. Butyrate produced by the gut microbiota (especially Faecalibacterium) significantly decreases in faeces of AML patients, while gavage with butyrate or Faecalibacterium postpones murine AML progression. Furthermore, we find the intestinal barrier is damaged in mice with AML, which accelerates lipopolysaccharide (LPS) leakage into the blood. The increased LPS exacerbates leukaemia progression in vitro and in vivo. Butyrate can repair intestinal barrier damage and inhibit LPS absorption in AML mice. Collectively, we demonstrate that the gut microbiota promotes AML progression in a metabolite-dependent manner and that targeting the gut microbiota might provide a therapeutic option for AML.


Conflict of interest statement

The authors declare no competing interests.

Figures

Fig. 1
Fig. 1. The diversity and composition of the gut microbiota are significantly altered in AML patients.
Total bacterial DNA was isolated from the intestinal content, and 16S rRNA genes were sequenced. a The diversity and richness of the gut microbiota in AML patients (AML) and healthy controls (Con). Unpaired t-tests were used to compare the Shannon index (n = 61). Data were presented as standard boxplots (with the box encompassing Q1–Q3, the median denoted as a central horizontal line in the box, and the whiskers covering the data within ±1.5 IQR). b PCoA of a weighted UniFrac distance analysis (n = 61). c Relative taxon abundance comparison among the AML and control groups (n = 61). d Spearman correlations between the intestinal content of the 10 genera in AML patients and healthy controls. Faecalibacterium and Roseburia were significantly correlated (red positive correlation, blue negative correlation). e Cladogram generated from linear discriminant analysis effect size (LEfSe) and the LDA score. f The abundance of Faecalibacterium and OTUs was reduced in the unfavourable-risk group (n = 20) compared with the favourable-risk group (n = 9). P values were determined using two-tailed t-test in (a, f) and using Wilcoxon rank test in c. Error bars represent mean ± SEM in (a, c, f). *P = 0.02178 (a), **P = 0.0016, *P = 0.015 (f). Source data are provided as a Source Data file.
Fig. 2
Fig. 2. AML causes bacterial dysbiosis, and gut microbiota dysbiosis aggravates the progression of AML.
a The diversity and richness of the gut microbiota in control mice (without cell injection), control-14days mice (without cell injection after 14 days), AML mice (AML cell injection) and AML-14days (mice after AML cell injection after 14days). Unpaired t-test were used for comparing the Chao1 and Shannon index (n = 5 per group). Data were presented as standard boxplots (with the box encompassing Q1–Q3, the median denoted as a central horizontal line in the box, and the whiskers covering the data within ±1.5 IQR). b Schematic diagram of the mouse experimental process. c Leukaemia cells (GFP+ cells) in the spleen, peripheral blood, and bone marrow from ABX AML mice (n = 5) and control PBS AML mice (n = 5). Details of the gating strategy are described in Supplementary Fig. 11b. d Haematoxylin and eosin–stained histopathology sections and Ki67 immunohistochemical staining of a representative spleen, the ABX AML group, and the PBS AML group. All microscopic analyses were performed at an original magnification of ×80 or ×200, scale bar = 1000 and 275 µm. e Kaplan–Meier survival curve of AML mice (n = 5 per group). f The photographs and weights of spleens from AML-FMT mice (n = 5) and AML-PBS mice (n = 5). g The leukaemia cells (GFP+ cells) in spleen, peripheral blood and bone marrow from AML-FMT mice (n = 5) and AML-PBS mice (n = 5). Details of the gating strategy are described in Supplementary Fig. 11b. h HE histopathology sections of a representative spleen, AML-FMT group and AML-PBS group. All microscopic analyses were performed (original magnification ×80 or ×200), scale bar = 1000 and 275 µm. P values were determined using Dunn’s test in a. P values were determined using unpaired two-tailed t-test in c, f, g. P values were determined using Gehan–Breslow–Wilcoxon test in e. Error bars represent mean ± SEM in a, c, f, g, e. *P = 0.016 Chao1, *P = 0.013 Shannon (a), ***P = 0.0008 PB, **P = 0.0068 SP, **P = 0.0087 BM (c), **P = 0.0043 (e), ***P = 0.0007 (f), **P = 0.0025 PB, **P = 0.0028 SP, *P = 0.0144 BM (g). Source data are provided as a Source Data file.
Fig. 3
Fig. 3. FMT delays the development of AML.
a Schematic diagram of the mouse AML-FMT process. b Photographs and weights of spleens from AML-FMT mice (n = 4) and Con-FMT mice (n = 4). c Leukaemia cells (GFP+ cells) in the spleen, peripheral blood, and bone marrow from AML-FMT mice (n = 4) and Con-FMT mice (n = 4). Details of the gating strategy are described in Supplementary Fig. 11b. d HE histopathology sections and Ki67 immunohistochemical staining of a representative spleen, the AML-FMT group, and the Con-FMT group. All microscopic analyses were performed at an original magnification ×80 or ×200, scale bar = 1000 and 275 µm. e On days 8 and 14 after the injection, the load of Luciferase expressing MLL-AF9 cells in mice was analysed by IVIS (n = 3 per group). f Kaplan–Meier survival curve of AML mice (n = 5 per group). P values were determined using unpaired two-tailed t-test and error bars represent mean ± SEM in b, c, e. P values were determined using Gehan–Breslow–Wilcoxon test and error bars represent mean ± SEM in f. **P = 0.0069 (b), ***P < 0.0001 PB, ***P < 0.0001 SP, *P = 0.0114 BM (c), *P = 0.0473 (e), **P = 0.0039 (f). Source data are provided as a Source Data file.
Fig. 4
Fig. 4. AML patients exhibit profound alterations in gut microbial metabolites.
a Plot of the OPLS-DA score and permutation tests for the OPLS-DA score plots from the untargeted metabolomics analysis of stool samples from AML patients (n = 15) and healthy controls (n = 17). b Heatmap of the relative abundances of the top 25 most abundant metabolites that significantly changed in the AML group. The colour bar indicates the Z score, which represents the relative abundance. A Z score <0 (>0) indicated that the relative abundance was lower (higher) than the mean. c The concentrations of propionic acid, butyric acid, and acetic acid in faecal samples of AML patients (n = 15) and controls (n = 17) were determined by GC-MS. d Heatmap of the Spearman correlation analysis between the gut microbiota and the metabolite. e The functional abundance distribution histogram of samples from AML patients and healthy controls in the COG database using PICRUSt software (the top 35 samples were selected by the maximum sorting method). f Significant differences in metagenomic functions in AML patients compared with healthy controls (the mean is used to measure the centre of the error bar, corrected P < 0.05 and confidence intervals = 95%, n = 31 AML patients and n = 30 healthy control, biologically independent samples). P values were determined using unpaired two-tailed t-test and error bars represent mean ± SEM in c. **P = 0.001423 AML vs Control Propionic acid, **P = 0.00673 AML vs Control Propionic Butyric acid (c). Source data are provided as a Source Data file.
Fig. 5
Fig. 5. Microbiota-derived butyrate gavage delays AML progression.
a Schematic diagram of the mouse experimental process, including butyrate gavage. b Photographs of spleens from butyrate-treated AML mice (n = 5) and control AML mice (n = 5). c Leukaemia cells (GFP+ cells) in the bone marrow, peripheral blood, and spleen from butyrate-treated AML mice (n = 5) and control AML mice (n = 5). Details of the gating strategy are described in Supplementary Fig. 11b. d HE histopathology sections and Ki67 immunohistochemical staining of a representative spleen in butyrate-treated and control AML mice. All microscopic analyses were performed at an original magnification of ×80 or ×200, scale bar = 1000 and 275 µm. e Kaplan–Meier survival curve of AML mice (n = 5 per group). f On 8 and 14 days after injection of MLL-AF9 cells, the load of Luc-expressing MLL-AF9 cells in mice was analysed by IVIS (n = 3 per group). P values were determined using unpaired two-tailed t-test and error bars represent mean ± SEM in b, c, f. P values were determined Gehan–Breslow–Wilcoxon test and error bars represent mean ± SEM in e. ***P < 0.0001 (b), ***P < 0.0001 PB, **P = 0.0066 SP, ***P = 0.0006 BM (c), *P = 0.0137 (f), **P = 0.0026 (e). Source data are provided as a Source Data file.
Fig. 6
Fig. 6. Butyrate reverses intestinal barrier damage in mice with AML.
a The concentration of FITC-dextran in the peripheral blood after FITC-dextran gavage for 6 h. Data represent the mean ± SEM (n = 5 per group). b The mRNA expression levels of the tight junction protein components claudin-1, claudin-2, and ZO-1 in intestinal epithelial cells of AML, control, and butyrate-treated mice (n = 3 per group). c The protein levels of claudin-1, claudin-2, and ZO-1 in intestinal epithelial cells were determined by western blot. GAPDH was used as the control (n = 3 per group). d Transmission electron microscopy (TEM) of intestines isolated from normal, AML, and butyrate-treated AML mice for the duration of the experiment; arrows indicate the cell–cell interface, scale bar = 2 µm. e Immunofluorescence analysis of intestine tissue from normal, AML, and butyrate-treated mice, scale bar = 50 µm. d, e Three times each experiment was repeated independently with similar results. Cells were fixed and stained with a rabbit polyclonal antibody. APC (red) goat anti-rabbit IgG was used as a secondary antibody. Immunofluorescence indicated the expression quantity and localisation of claudin-1, claudin-2, and ZO-1. P values were determined using unpaired two-tailed t-test and error bars represent mean ± SEM in (a, b, c). ***P = 0.0007, **P = 0.0027, *P = 0.0482 (a), ***P = 0.0005 AML vs Control (claudin-1), **P = 0.0063 AML vs AML + Butyrate (claudin-1), *P = 0.0192 AML + Butyrate vs Control (claudin-1), **P = 0.0021 AML vs Control (claudin-2), **P = 0.0099 AML vs AML + Butyrate (claudin-2), *P = 0.0203 AML + Butyrate vs Control (claudin-2), **P = 0.0021 AML vs Control (ZO-1), *P = 0.0475 AML vs AML + Butyrate (ZO-1), *P = 0.0155 AML + Butyrate vs Control (ZO-1) (b), **P = 0.0065 AML vs Control (claudin-1), *P = 0.0418 AML vs AML + Butyrate (claudin-1), ***P = 0.0005 AML vs Control (claudin-2), ***P = 0.0004 AML vs AML + Butyrate (claudin-2), ***P = 0.0005 AML vs Control (ZO-1), ***P = 0.0004 AML + Butyrate vs Control (ZO-1) (c). Source data are provided as a Source Data file.
Fig. 7
Fig. 7. Damage to the intestinal barrier accelerates bacterial-derived LPS leakage into the blood, and LPS exacerbates the progression of AML.
a LPS concentrations in the peripheral plasma of AML patients and healthy controls (n = 20 per group, biologically independent samples). b LPS concentrations in butyrate-treated and control AML mice. c LPS concentrations in AML-FMT and Con-FMT mice. d LPS concentrations in AML mice and normal mice after LPS gavage. bd All data are from animal’s independent experiments. e Representative FACS graphs of apoptotic MLL-AF9 cells after culture with or without LPS for 48 h (n = 3 per group). Details of the gating strategy are described in Supplementary Fig. 11a. f CCK-8 analysis of the proliferation of MLL-AF9 cells with or without LPS for 24, 48, and 72 h (n = 3 per group). g The western blot results for Bcl-2, BAX, cleaved caspase-3, and GAPDH was used as controls (n = 3 per group). h Leukaemia cells (GFP+ cells) in the spleen, peripheral blood, and bone marrow from LPS-treated AML mice (n = 4) and control AML mice (n = 4). Details of the gating strategy are described in Supplementary Fig. 11b. i Representative photographs of spleens and the weight of spleens from LPS-treated AML mice (n = 4) and control AML mice (n = 4). j HE histopathology sections and Ki67 immunohistochemical staining of a representative spleen, LPS-treated AML mice, and control AML mice. All microscopic analyses were performed at an original magnification ×80 or ×200, scale bar = 1000 and 275 µm. k Kaplan–Meier survival curve of the mouse leukaemia model (n = 4 per group). P values were determined using unpaired two-tailed t-test and error bars represent mean ± SEM in ai. P values were determined using Gehan–Breslow–Wilcoxon test and error bars represent mean ± SEM in (k). **P = 0.0017 (a), **P = 0.015 (b), *P = 0.0322 (c), **P = 0.0051 (d), *P = 0.0113 (e), *P = 0.0261, **P = 0.0028 (f), *P = 0.00454 Cleaved caspase-3, *P = 0.0034 BAX, ***P = 0.0009 BCL-2 (g), *P = 0.0476 PB, **P = 0.0077 SP, *P = 0.025 BM (h), *P = 0.0276 (i), **P = 0.0043 (k). Source data are provided as a Source Data file.
Fig. 8
Fig. 8. Gut microbiota regulates AML via alteration of intestinal barrier function and LPS blood concentration.
Gut microbiota disorders in AML lead to a decrease in intestinal butyrate. Decreased butyrate weakens gut barrier function by altering tight junction proteins (claudin-1, claudin-2, ZO-1). Dysregulation of intestinal barrier function allows LPS leakage into blood, which in turn promotes the proliferation of AML cells and accelerates AML progression. These effects could be reversed by treatment with butyrate or FMT.

Similar articles

Cited by

References

    1. Kayser S, Levis MJ. Advances in targeted therapy for acute myeloid leukaemia. Br. J. Haematol. 2018;180:484–500. doi: 10.1111/bjh.15032. - DOI - PMC - PubMed
    1. Song X, et al. Incidence, survival, and risk factors for adults with acute myeloid leukemia not otherwise specified and acute myeloid leukemia with recurrent genetic abnormalities: analysis of the Surveillance, Epidemiology, and End Results (SEER) Database, 2001-2013. Acta Haematol. 2018;139:115–127. doi: 10.1159/000486228. - DOI - PubMed
    1. Cekanaviciute E, et al. Gut bacteria from multiple sclerosis patients modulate human T cells and exacerbate symptoms in mouse models. Proc. Natl Acad. Sci. USA. 2017;114:10713–10718. doi: 10.1073/pnas.1711235114. - DOI - PMC - PubMed
    1. Zhang X, et al. The oral and gut microbiomes are perturbed in rheumatoid arthritis and partly normalized after treatment. Nat. Med. 2015;21:895–905. doi: 10.1038/nm.3914. - DOI - PubMed
    1. Marino E, et al. Gut microbial metabolites limit the frequency of autoimmune T cells and protect against type 1 diabetes. Nat. Immunol. 2017;18:552–562. doi: 10.1038/ni.3713. - DOI - PubMed

Publication types