. 2022 May 9;12(1):7526.
doi: 10.1038/s41598-022-11362-x.

Estimating and explaining cross-country variation in the effectiveness of non-pharmaceutical interventions during COVID-19

Affiliations

Estimating and explaining cross-country variation in the effectiveness of non-pharmaceutical interventions during COVID-19

Nicolas Banholzer et al. Sci Rep. .

Abstract

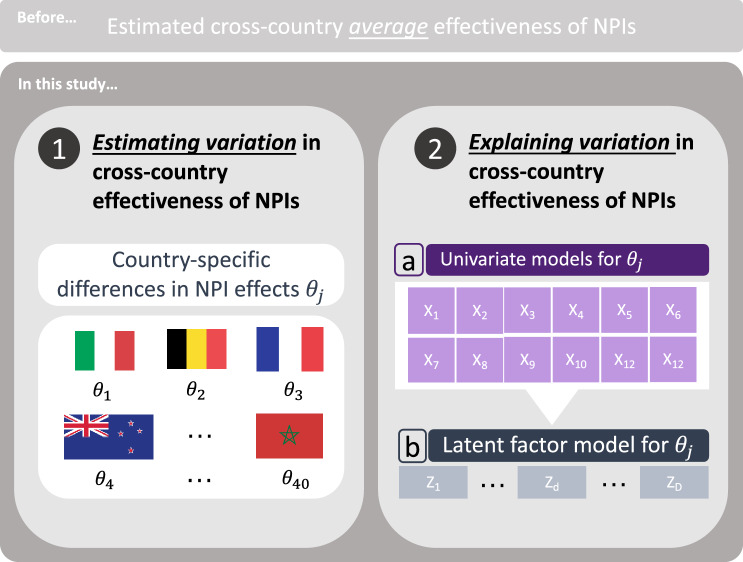
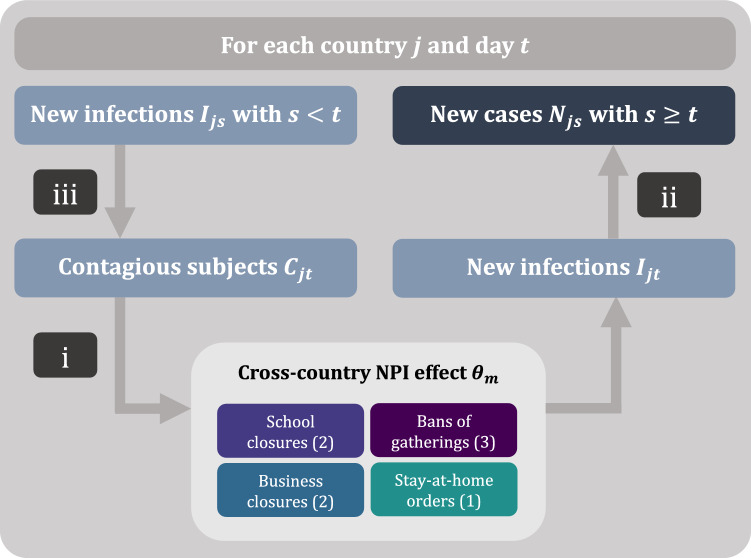
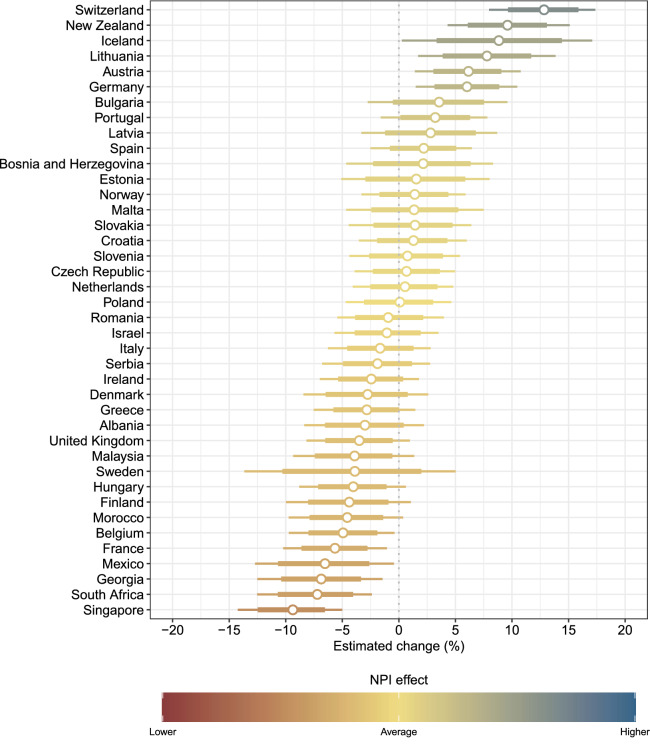
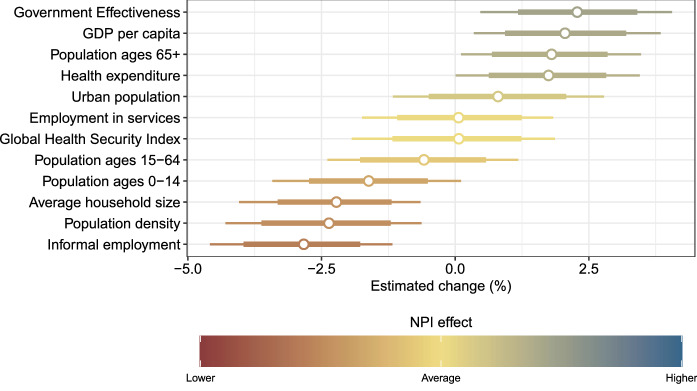
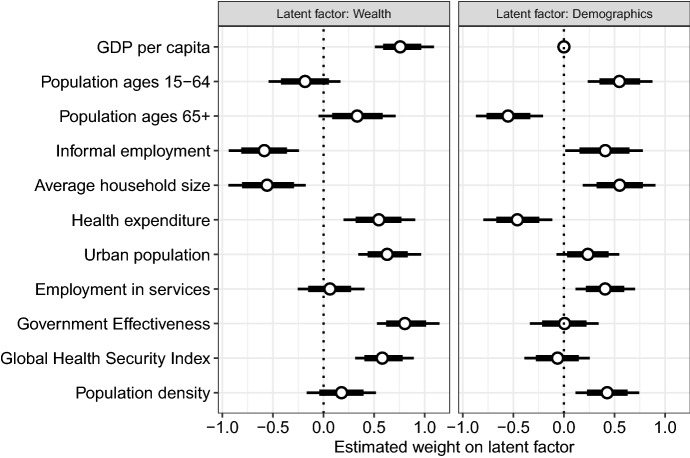
To control the COVID-19 pandemic, countries around the world have implemented non-pharmaceutical interventions (NPIs), such as school closures or stay-at-home orders. Previous work has estimated the effectiveness of NPIs, yet without examining variation in NPI effectiveness across countries. Based on data from the first epidemic wave of [Formula: see text] countries, we estimate country-specific differences in the effectiveness of NPIs via a semi-mechanistic Bayesian hierarchical model. Our estimates reveal substantial variation between countries, indicating that NPIs have been more effective in some countries (e. g. Switzerland, New Zealand, and Iceland) as compared to others (e. g. Singapore, South Africa, and France). We then explain differences in the effectiveness of NPIs through 12 country characteristics (e. g. population age, urbanization, employment, etc.). A positive association with country-specific effectiveness of NPIs was found for government effectiveness, gross domestic product (GDP) per capita, population ages 65+, and health expenditures. Conversely, a negative association with effectiveness of NPIs was found for the share of informal employment, average household size and population density. Overall, the wealth and demographic structure of a country can explain variation in the effectiveness of NPIs.


Conflict of interest statement

SF reports membership in a COVID-19 working group of the World Health Organization but without competing interest. SF reports grants from the Swiss National Science Foundation outside of the submitted work. All other authors declare no competing interests.

Figures

Figure 1
Figure 1
Visual summary of the two-step analysis for estimating and explaining variation in cross-country effectiveness of NPIs. Step 1: Estimating variation in cross-country effects of NPIs θ1,,θ40. Step 2: Explaining variation in θj through 12 country characteristics X1,,X12. Association between characteristics and θj is estimated as follows: a by linking θj separately to each country characteristic, and b by linking θj to latent factors Z1,,ZD, which are determined with a latent factor model.
Figure 2
Figure 2
Visual summary of the model structure. The three main components are: (i) The number of new infections is modelled as a function of the number of contagious subjects, the country-specific daily transmission rate, and the reductions from 8 active NPIs (school and university closures, bans of gatherings larger than 10, 100, and 1000 people, closure of some or most high-risk face-to-face businesses, and stay-at-home orders). (ii) The observed number of new cases is a weighted sum of the number of new infections in the previous days. (iii) The number of contagious subjects is a weighted sum of the number of new infections in the previous days.
Figure 3
Figure 3
Estimated relative change (in %) in avoided new infections compared to the cross-country average effect of the single NPIs (posterior mean as dots with 80% and 95% credible interval as thick and thin lines, respectively).
Figure 4
Figure 4
Estimated relative change (in %) in avoided new infections compared to the cross-country average effect of the single NPIs (posterior distribution with mean as dots and with 80% and 95% credible interval as thick and thin lines, respectively) for a +1 standard deviation (SD) increase in the variable with the country characteristic.
Figure 5
Figure 5
Estimated weight on latent factors (posterior mean as dots with 80% and 95% credible interval as thick and thin lines, respectively).

Similar articles

Cited by

References

    1. Brauner JM, Mindermann S, Sharma M, Johnston D, Salvatier J, Gavenčiak T, et al. Inferring the effectiveness of government interventions against COVID-19. Science. 2021;371(6531):eabd9338. doi: 10.1126/science.abd9338. - DOI - PMC - PubMed
    1. Hale, T., Webster, S., Petherick, A., Phillips, T., Kira, B. Oxford COVID-19 Government Response Tracker. Blavatnik School of Government. 2020;Available from: https://www.bsg.ox.ac.uk/research/research-projects/coronavirus-governme.... - PubMed
    1. Banholzer N, Weenen Ev, Lison A, Cenedese A, Seeliger A, Kratzwald B, et al. Estimating the effects of non-pharmaceutical interventions on the number of new infections with COVID-19 during the first epidemic wave. Plos One. 2021;16(6):e0252827. doi: 10.1371/journal.pone.0252827. - DOI - PMC - PubMed
    1. Banholzer N, Lison A, Ozcelik D, Stadler T, Feuerriegel S, Vach W, et al. The methodologies to assess the effects of non-pharmaceutical interventions during COVID-19: a systematic review. MedRxiv. 2021 doi: 10.1101/2022.04.14.22273858. - DOI - PMC - PubMed
    1. Dehning J, Zierenberg J, Spitzner FP, Wibral M, Neto JP, Wilczek M, et al. Inferring change points in the spread of COVID-19 reveals the effectiveness of interventions. Science. 2020;369(6500):eabb9789. doi: 10.1126/science.abb9789. - DOI - PMC - PubMed

Publication types