. 2022 May 9;5(1):432.
doi: 10.1038/s42003-022-03399-5.

Arabidopsis nitrate-induced aspartate oxidase gene expression is necessary to maintain metabolic balance under nitrogen nutrient fluctuation

Affiliations

Arabidopsis nitrate-induced aspartate oxidase gene expression is necessary to maintain metabolic balance under nitrogen nutrient fluctuation

Moriaki Saito et al. Commun Biol. .

Abstract

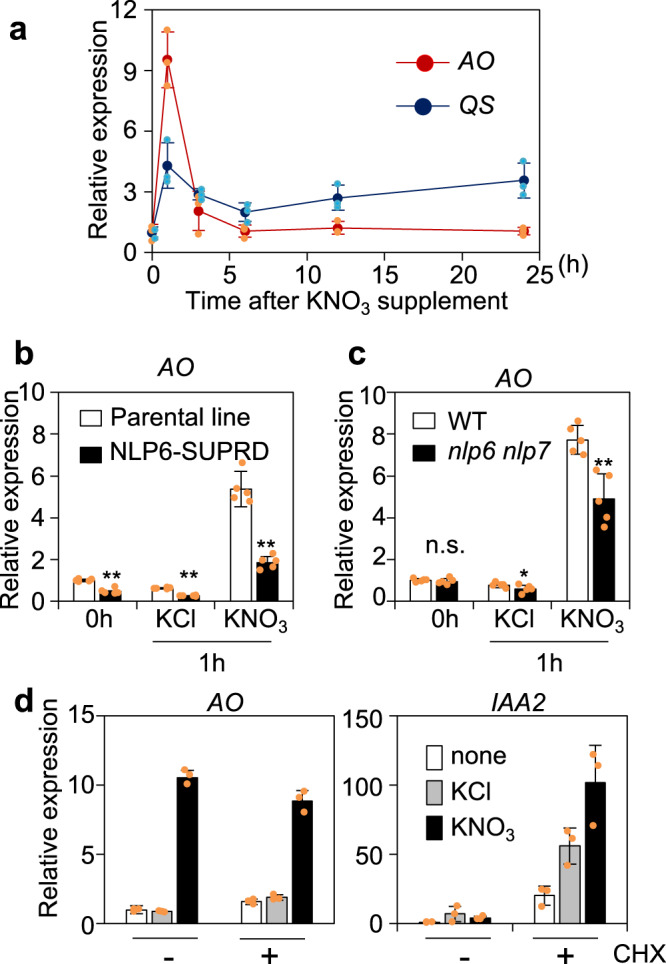
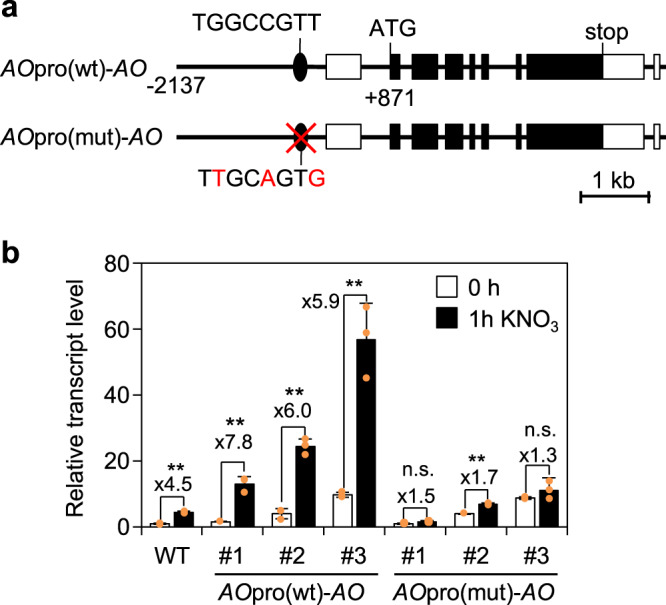
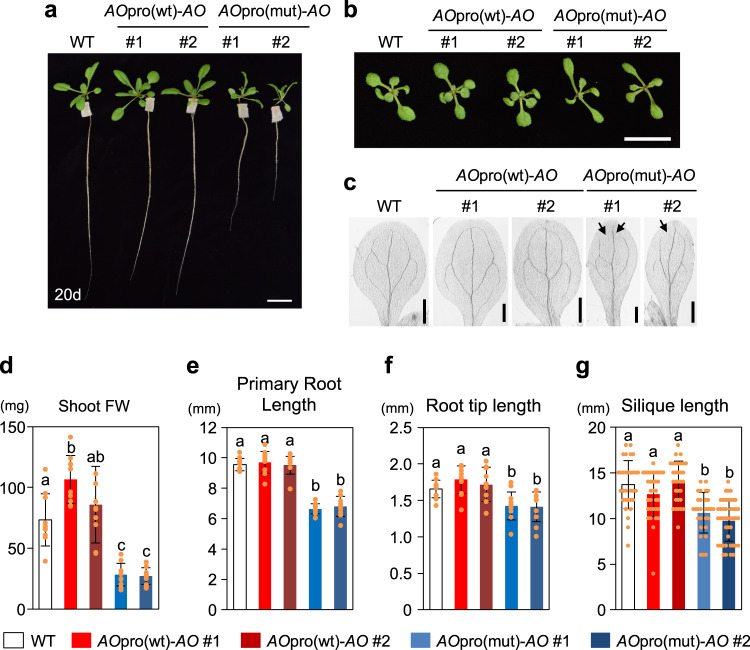
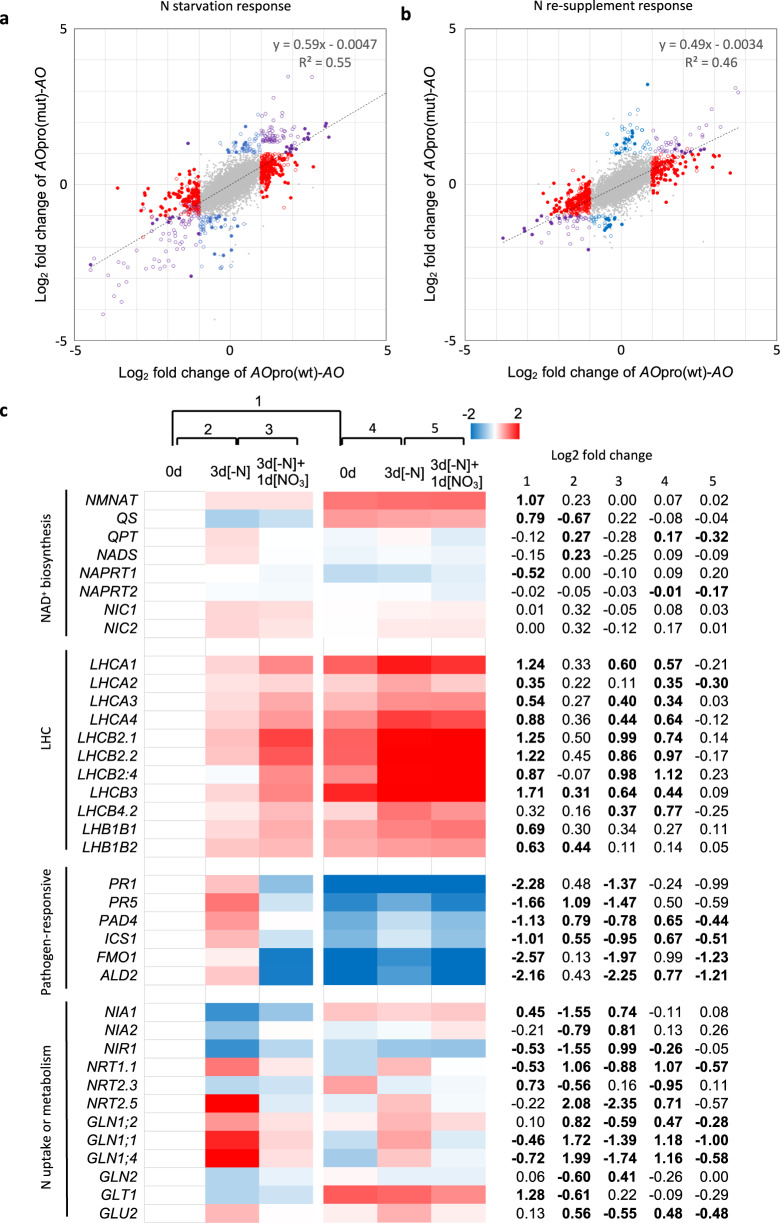
Nitrate is a nutrient signal that regulates growth and development through NLP transcription factors in plants. Here we identify the L-aspartate oxidase gene (AO) necessary for de novo NAD+ biosynthesis as an NLP target in Arabidopsis. We investigated the physiological significance of nitrate-induced AO expression by expressing AO under the control of the mutant AO promoter lacking the NLP-binding site in the ao mutant. Despite morphological changes and severe reductions in fresh weight, the loss of nitrate-induced AO expression resulted in minimum effects on NAD(H) and NADP(H) contents, suggesting compensation of decreased de novo NAD+ biosynthesis by reducing the growth rate. Furthermore, metabolite profiling and transcriptome analysis revealed that the loss of nitrate-induced AO expression causes pronounced impacts on contents of TCA cycle- and urea cycle-related metabolites, gene expression profile, and their modifications in response to changes in the nitrogen nutrient condition. These results suggest that proper maintenance of metabolic balance requires the coordinated regulation of multiple metabolic pathways by NLP-mediated nitrate signaling in plants.


Conflict of interest statement

The authors declare no competing interests.

Figures

Fig. 1
Fig. 1. Nitrate-inducible expression of AO.
a Time-course analysis of AO and QS expression after supplementation of KNO3 at the final concentration of 10 mM. Nitrate induction of expression of AO in NLP6-SURRD transgenic seedlings and the parental genotype (b), and in the wild-type (WT) and nlp6 nlp7-1 double mutant seedlings (c). Asterisks indicate significant differences (Welch’s t-test; *P ≤ 0.05, **P ≤ 0.01). d Nitrate-induced expression of AO in plants treated with cycloheximide (CHX). In (a), 4-day-old WT seedlings were treated with 10 mM KNO3 for the indicated time period. In (bd), seedlings were treated with 10 mM KNO3 or KCl (control) for 1 h. In (d), seedlings were treated with 100 µM CHX for 1 h before nitrate or control treatment. IAA2 was used as a positive control gene for the CHX treatment. All seedlings were grown under continuous light. Data represent mean ± standard deviation [SD; n = 3 in (a, d) and n = 5 in (b, c)].
Fig. 2
Fig. 2. Nitrate-dependent activation of the AO promoter through the specific binding of NLP7.
a Effector and internal control plasmids. The effector plasmid contains NLP7 cDNA cloned between the modified 35S promoter (35Spro) and the NOS terminator (NOS), while the empty vector contained no DNA insert. The plasmid carrying the GUS gene under the control of the UBQ10 promoter (UBQ10pro) served as an internal control. b Co-transfection assay. Protoplasts from N-starved plants were co-transfected with a reporter plasmid (expressing the luciferase gene (LUC) under the control of a truncated fragment of the AO promoter), NLP7 expression vector or the empty vector, and the internal control plasmid, and then incubated in the presence of 10 mM KNO3 or KCl (control). The transcription start sites are indicated by arrows. c, d Electrophoretic mobility shift assay (EMSA). DNA probes corresponding to different regions of the AO promoter (P1–P5) in (c) and the WT and mutant P2 probes in (d) were incubated in the presence (+) or absence (-) of recombinant NLP7. The mutant P2 probes (Mut1, Mut2, and Mut3) contained nucleotide substitutions (as indicated). A DNA fragment from the NIR1 promoter was used as a positive control. Black arrowheads indicate retarded bands. e Activation of the AO promoter, depending on both the NLP7-binding site and NLP7. Reporter plasmids contained the WT or mutated AO promoter. The AO promoter truncated at -1,015 was used as a negative control. Nucleotide substitutions in the mutated AO promoter were the same as those in the Mut1 probe. In (b) and (e), data represent mean ± SD (n = 3), and relative LUC activity obtained from protoplasts co-transfected with the reporter plasmid (containing the full-length WT AO promoter) and the empty vector, and then incubated in the presence of 10 mM KCl, was set to 1. Asterisks indicate significant differences between seedlings treated with and without nitrate (Welch’s t-test; *P ≤ 0.05, **P ≤ 0.01). n.s. not significant.
Fig. 3
Fig. 3. NLP-binding site-dependent induction of AO expression by nitrate in planta.
a Schematic representation of AOpro(wt)-AO and AOpro(mut)-AO constructs introduced into the ao mutant. The construct contained a 6753 bp sequence of the AO locus (from 2,137 bp upstream of the transcription start site to 869 bp downstream of the stop codon). In the AOpro(mut)-AO construct, the NLP-binding sequence was mutated. White and black boxes indicate untranslated and translated regions, respectively. b RT-qPCR analysis of nitrate-induced AO expression in 4-day-old seedlings of the WT and three independent transgenic lines (#1, #2, and #3). The seedlings were treated with 10 mM KNO3 for 1 h. The expression level of AO in WT seedlings not exposed to the nitrate treatment was set to 1. Data represent mean ± SD (n = 3). Induction folds are indicated. Asterisks indicate significant differences between seedlings treated with and without nitrate (Welch’s t-test; *P ≤ 0.05, **P ≤ 0.01).
Fig. 4
Fig. 4. Phenotypes of AOpro(mut)-AO plants.
a Images of shoot and root growth of seedlings grown hydroponically on 1/10MS medium for 20 days. Leaf shapes (b) and vascular patterns of cotyledons (c) of 10-day-old seedlings grown on agar plates. In (c), disconnected points of vascular loops are indicated by arrows. Scale bar = 2 cm (a), 1 cm (b), and 0.5 mm (c). d Fresh shoot weight of 20-day-old seedlings grown hydroponically on 1/10MS medium (n = 10). e Length of primary roots of 10-day-old seedlings grown on agar plates (n = 10–11). f Length of the meristematic region at the tip of the primary roots of 6-day-old seedlings grown on agar plates (n = 11–12). g Length of all siliques borne on the first flowering stem of plants grown on nutrient-supplemented soils under the long-day condition (n > 26). In (dg), data represent mean ± SD, and different letters denote statistically significant differences (Tukey’s honestly significant difference [HSD] test; P < 0.05).
Fig. 5
Fig. 5. Dynamics of shoot NAD(H) and NADP(H) contents in response to changes in the N environment.
a Experimental scheme for sampling time and N conditions. Sample 0d, plants grown hydroponically on 1/10MS medium for 20 d; sample 3d[-N], plants grown for 3 d on N-free 1/10MS medium after cultivation on 1/10MS medium for 20 d; sample 3d[-N3] + 1d[KNO3-], plants treated with 10 mM KNO3 at day 23. Control samples 3d[+N] and 4d[+N] represent plants grown hydroponically on 1/10MS medium for 20 days and then on fresh 1/10MS medium for 3 or 4 days, respectively. b NAD+, NADH, NADP+, and NADPH contents of the whole shoots of WT, AOpro(wt)-AO, and AOpro(mut)-AO plants sampled according to the scheme in (a). Data represent mean ± SD (n = 5). Different letters denote statistically significant differences (Tukey’s HSD test; P < 0.05).
Fig. 6
Fig. 6. Abnormal accumulation of TCA cycle metabolites in AOpro(mut)-AO plants.
a Contents of TCA cycle intermediates were measured in the shoots of WT, AOpro(wt)-AO, and AOpro(mut)-AO plants grown according to the scheme shown in Fig. 5a. Data represent mean ± SD (n = 5). b Schematic representation of the mitochondrial electron transport chain. Antimycin A inhibits the activity of Complex III. Q, ubiquinone; QH2, ubiquinol. c Effect of antimycin A on the shoot fresh weight. Seedlings were initially grown in the absence of antimycin A for 4 days and then in the presence of the indicated concentrations of antimycin A for 6 days (n = 7–12). Two independent lines (#1 and #2) of AOpro(wt)-AO and AOpro(mut)-AO plants were used. In (a, c), different letters denote statistically significant differences (Tukey’s HSD test; P < 0.05).
Fig. 7
Fig. 7. Abnormal accumulation of urea cycle-associated metabolites in AOpro(mut)-AO plants.
Contents of urea cycle-associated metabolites were measured in the shoots of WT, AOpro(wt)-AO, and Aopro(mut)-AO plants grown according to the scheme shown in Fig. 5a. Two independent lines (#1 and #2) of AOpro(wt)-AO and AOpro(mut)-AO plants were used. Data represent mean ± SD (n = 5). Different letters denote statistically significant differences (Tukey’s HSD test; P < 0.05).
Fig. 8
Fig. 8. Limited effects of erasing nitrate-induced AO expression on glutamine and glutamate contents and decreases in nitrate content.
a Glutamine and glutamate contents in the shoots of WT, AOpro(wt)-AO, and AOpro(mut)-AO plants grown according to the scheme shown in Fig. 5a. Two independent lines (#1 and #2) of AOpro(wt)-AO and AOpro(mut)-AO plants were used. Data represent mean ± SD (n = 5). b Decreases in the shoot nitrate content of wild-type, AOpro(wt)-AO, AOpro(mut)-AO, nlp7 and G'4-3 seedlings during the N starvation treatment. Seedlings were first grown in the presence of KNO3 and NH4NO3 for 8 days and then grown in the absence of N sources for 0, 1, or 3 days. To grow G'4-3 (nia1 nia2 double mutant) seedlings and other seedlings under the same nutrient condition, medium containing ammonium as N source was used in the pre-culture of all seedlings. Data represent mean ± SD (n = 4). In (a, b), different lowercase letters indicate significant differences among various genotypes (P < 0.05; Tukey’s HSD test).
Fig. 9
Fig. 9. Effects of the loss of nitrate-induced AO expression on the transcriptome.
Scatter plots of log2 fold changes in gene expression by N starvation treatment (0d vs. 3d[–N]) (a) or by nitrate resupply (3d[-N] vs. 3d[-N] + 1d[KNO3]) (b) in AOpro(wt)-AO and AOpro(mut)-AO plants. Gray dots indicate genes that did not significantly respond to N starvation treatment or KNO3 resupply, while open circles in red, blue, and purple indicate genes that significantly responded to N starvation treatment or KNO3 resupply in only AOpro(wt)-AO, only AOpro(mut)-AO, and both, respectively (log2 fold change ≥ |1|, adjusted P-value ≤ 0.05). Closed red, blue, and purple circles were applied when the adjusted P-value was less than 0.001. c Heatmap of typical genes whose expression levels were differentially modified in AOpro(wt)-AO vs. AOpro(mut)-AO plants during changes in the N conditions. Log2 fold changes (relative to the expression levels in sample 0d of AOpro(wt)-AO plants) are shown with a color scale. A chart on the right side of the heatmap shows log2 fold changes of expression levels in AOpro(mut)-AO to those in AOpro(wt)-AO plants before N starvation treatment (column 1), log2 fold changes caused by N starvation treatment (column 2) or nitrate resupply (column 3) in AOpro(wt)-AO plants, and log2 fold changes caused by N starvation treatment (column 4) or nitrate resupply (column 5) in AOpro(mut)-AO plants. Statistically significant differences are indicated in bold font (P < 0.05).

Similar articles

Cited by

References

    1. Crawford NM. Nitrate: Nutrient and signal for plant growth. Plant Cell. 1995;7:859–868. - PMC - PubMed
    1. Wang Y-Y, Cheng Y-H, Chen K-E, Tsay Y-F. Nitrate transport, signaling, and use efficiency. Annu. Rev. Plant Biol. 2018;69:85–122. doi: 10.1146/annurev-arplant-042817-040056. - DOI - PubMed
    1. Campbell WH. Nitrate reductase and its role in nitrate assimilation in plants. Physiol. Plant. 1988;74:214–219. doi: 10.1111/j.1399-3054.1988.tb04965.x. - DOI
    1. Zhang H, Jennings A, Barlow PW, Forde BG. Dual pathways for regulation of root branching by nitrate. Proc. Natl Acad. Sci. USA. 1999;96:6529–6534. doi: 10.1073/pnas.96.11.6529. - DOI - PMC - PubMed
    1. Scheible W-R, Lauerer M, Schulze E-D, Caboche M, Stitt M. Accumulation of nitrate in the shoot acts as a signal to regulate shoot-root allocation in tobacco. Plant J. 1997;11:671–691. doi: 10.1046/j.1365-313X.1997.11040671.x. - DOI

Publication types