. 2022 Nov;29(11):2190-2202.
doi: 10.1038/s41418-022-01008-w. Epub 2022 May 9.

Wnt/beta-catenin signaling confers ferroptosis resistance by targeting GPX4 in gastric cancer

Affiliations

Wnt/beta-catenin signaling confers ferroptosis resistance by targeting GPX4 in gastric cancer

Yue Wang et al. Cell Death Differ. 2022 Nov.

Abstract

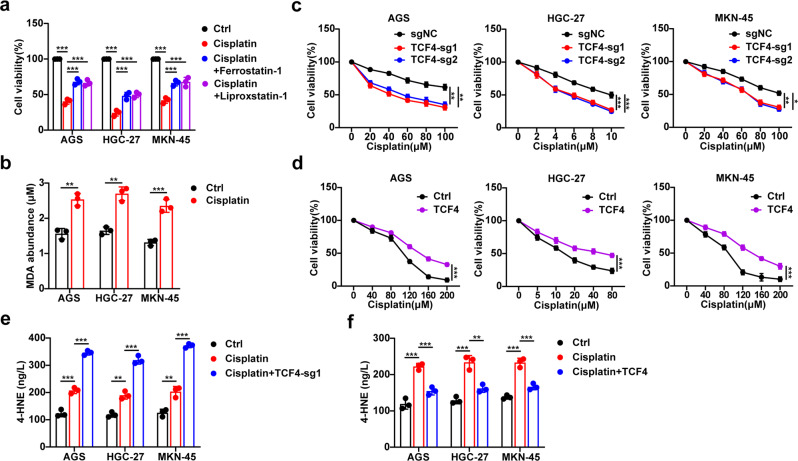
The development of chemotherapy resistance is the most vital obstacle to clinical efficacy in gastric cancer (GC). The dysregulation of the Wnt/beta-catenin signaling pathway is critically associated with GC development and chemotherapy resistance. Ferroptosis is a form of regulated cell death, induced by an iron-dependent accumulation of lipid peroxides during chemotherapy. However, whether the Wnt/beta-catenin signaling directly controls resistance to cell death, remains unclear. Here, we show that the activation of the Wnt/beta-catenin signaling attenuates cellular lipid ROS production and subsequently inhibits ferroptosis in GC cells. The beta-catenin/TCF4 transcription complex directly binds to the promoter region of GPX4 and induces its expression, resulting in the suppression of ferroptotic cell death. Concordantly, TCF4 deficiency promotes cisplatin-induced ferroptosis in vitro and in vivo. Thus, we demonstrate that the aberrant activation of the Wnt/beta-catenin signaling confers ferroptosis resistance and suggests a potential therapeutic strategy to enhance chemo-sensitivity for advanced GC patients.


Conflict of interest statement

The authors declare no competing interests.

Figures

Fig. 1
Fig. 1. Inhibition of the Wnt/beta-catenin signaling enhances GC cells’ sensitivity to ferroptosis.
a Cell viability of indicated GC cells following treatment with erastin in the absence or presence of LF3 (AGS and MKN-45 for 10 μΜ, HGC-27 for 2 μΜ) for 24 h. b Cell death measurement of AGS following treatment with erastin (20 μM) in the absence or presence of ferrostatin-1 (2 μM), liproxstatin-1 (1 μM), Z-VAD-FMK (10 μM), necrosulfonamide (0.5 μM), or 3-methyladenine (250 μM) for 24 h. c Cell viability of AGS treated with erastin (50 μM) in the absence or presence of ferrostatin-1 (2 μM), liproxstatin-1 (1 μM), Z-VAD-FMK (10 μM), necrosulfonamide (0.5 μM), or 3-methyladenine (250 μM) for 24 h. d–f MDA (d), 4-HNE (e), and lipid ROS (f) measurements in GC cells following treatment with erastin (AGS and MKN-45 for 10 μM and HGC-27 for 1 μΜ) and/or LF3 (AGS and MKN-45 for 10 μΜ, HGC-27 for 2 μΜ). Data are presented as the mean ± SD of three independent experiments. The p-values in panels a, d, e, f were calculated using two-way ANOVA. The p-values in panels b, c were calculated by one-way ANOVA. *P < 0.05, **P < 0.01, ***P < 0.001.
Fig. 2
Fig. 2. TCF4 acts as a repressor of ferroptosis in GC cells.
a Cell viability of GC cells expressing sgNC or sg-TCF4 treated with different concentrations of erastin for 24 h. b Cell viability of GC cells transfected with control or TCF4-coding plasmid and treated with erastin for 24 h. c Cell death measurement of AGS expressing sgNC or sg-TCF4 treated with erastin (20 μM) in the absence or presence of ferrostatin-1 (2 μM), liproxstatin-1 (1 μM), Z-VAD-FMK (10 μM), necrosulfonamide (0.5 μM), or 3-methyladenine (250 μM) for 24 h. d Cell viability of AGS expressing sgNC or sg-TCF4 treated with erastin (50 μM) in the absence or presence of ferrostatin-1 (2 μM), liproxstatin-1 (1 μM), Z-VAD-FMK (10 μM), necrosulfonamide (0.5 μM), or 3-methyladenine (250 μM) for 24 h. e MDA production in GC cells expressing sgNC or sg-TCF4. f MDA production in GC cells transfected with control or TCF4-coding plasmid. Data are presented as the mean ± SD of three independent experiments. The p-values in panels ad were calculated by two-way ANOVA. The p-values in panel e were calculated by one-way ANOVA. The p-values in panle f were calculated by Student’s t-test and one-way ANOVA. *P < 0.05, **P < 0.01, ***P < 0.001.
Fig. 3
Fig. 3. TCF4 negatively modulates ferroptosis through GPX4 targeting.
a Venn diagram showing genes at the intersection of TCF4 bound promoters that were identified by ChIP-seq and previously reported ferroptosis-related genes. b Bar chart showing log2FC of the expression of five genes in TCF4 siRNA transfected HGC-27 cell. c Relative gene expression levels of GPX4, GCLM, CRYAB, LPCAT3, and FDFT1. d Q-PCR analysis of GPX4 mRNA expression in paired GC tissues and adjacent normal tissues (n = 34). e Protein expression of GPX4 in GC tissues (T) and adjacent normal tissues (N). f, g IHC staining (f) and H-score (g) for GPX4 in adjacent normal tissues (normal, n = 9) and GC tissues (tumor, n = 9). Scale bars: 200 μm (insets 50 μm). h, i IHC staining (h) and H-score (i) for GPX4 in N (normal tissues, n = 21), SG (superficial gastritis, n = 21), AG with IM (atrophic gastritis with intestinal metaplasia, n = 21), DYS (dysplasia, n = 25), and GC (n = 21) samples. Scale bars: 200 μm (insets 50 μm). j The overall survival for GC patients was analyzed using Kaplan–Meier curves (log-rank test; n = 384). k GPX4 protein expression in sgNC or sg-GPX4 expressing GC cells. l MDA production in GC cells expressing sgNC or sg-GPX4 and transfected with the TCF4-coding plasmid. m, n Colony formation of GC cells expressing sgNC or sg-GPX4 and transfected with the TCF4-coding plasmid. Data are presented as the mean ± SD of three independent experiments. The p-values in panels c, i, l, n were calculated by one-way ANOVA. The p-values in panels d, g were calculated by Student’s t-test. ns not significant, *P < 0.05, **P < 0.01, ***P < 0.001.
Fig. 4
Fig. 4. The beta-catenin/TCF4 transcription complex promotes GPX4 expression.
a, b Q-PCR (a) and western blot (b) analysis of GPX4 mRNA and protein expression in GC cells transfected with TCF4-coding plasmid. c, d mRNA (c) and protein (d) expression of GPX4 in GC cells expressing sgNC or sg-TCF4. e The four possible TCF4 binding sites in human GPX4 promoter. f Transcriptional activity of GPX4 in AGS measured by the luciferase reporter system. g The TCF4 binding site in human GPX4 promoter and the corresponding base mutation (WT4, the binding site was intact; mut, the binding site was mutated). h Transcriptional activity of GPX4 in TCF4 knockdown or overexpressed AGS measured by the luciferase reporter system. i ChIP assay for TCF4 occupancy on the GPX4 promoter. ChIP was performed with chromatin derived from AGS. The final DNA samples were amplified by qPCR with pairs of primers as described in Materials and Methods. A histone H3 antibody was used as a positive control. IgG antibody was used as a negative control. j, k Q-PCR (j) and western blot (k) analysis of GPX4 expression in indicated GC cells following treatment with LF3 (AGS and MKN-45 for 10 μΜ, HGC-27 for 2 μΜ) and TCF4-coding plasmid. l, m mRNA (l) and protein (m) expression of GPX4 in TCF4-KO GC cells with or without transfection of the beta-catenin-coding plasmid. n, o Q-PCR (n) and western blot (o) analysis of GPX4 expression in TCF4-KO GC cells transfected with wild-type or mutant TCF4-coding plasmid (WT: the binding sites of beta-catenin and TCF4 were intact, mut: the binding sites of beta-catenin and TCF4 were mutated). Data are presented as the mean ± SD of three independent experiments. The p-values in panels a, f, h, i were calculated by Student’s t-test. The p-values in panel c were calculated by one-way ANOVA. The p-values in panels j, l, n were calculated by two-way ANOVA. ns not significant, *p < 0.05, **p < 0.01, ***p < 0.001.
Fig. 5
Fig. 5. TCF4 inhibition sensitizes GC cells to cisplatin-induced ferroptosis in vitro.
a Cell viability of indicated GC cells following treatment with cisplatin (AGS and MKN-45 for 100 μM, HGC-27 for 10 μM) and in the absence or presence of ferrostatin-1 (2 μM) or liproxstatin-1 (1 μM) for 24 h. b MDA production in GC cells followed by treatment with cisplatin (AGS and MKN-45 for 10 μM, HGC-27 for 1 μM). c Cell viability of GC cells expressing sgNC or sg-TCF4 and treated with different concentrations of cisplatin for 24 h. d Cell viability of GC cells transfected with control or TCF4-coding plasmid and treated with different concentrations of cisplatin for 24 h. e, f 4-HNE production in TCF4-KO (e) or overexpressing (f) GC cells treated with cisplatin (AGS and MKN-45 for 10 μM, HGC-27 for 1 μM). Data are presented as the mean ± SD of three independent experiments. The p-values in panels a, e, f, were calculated by one-way ANOVA. The p-values in panels c, d, were calculated by two-way ANOVA. The p-values in panel b were calculated by Student’s t-test. *P < 0.05, **P < 0.01, ***P < 0.001.
Fig. 6
Fig. 6. TCF4 deficiency or Wnt signaling inhibition promote cisplatin sensitivity through ferroptosis in vivo.
a Schematic description of the experimental design used to establish the animal model. b, c Tumor weight (b) and tumor growth curves (c) in the nude mouse xenograft model. d, e IHC staining (d) and H-score (e) for 4-HNE in xenografts. Scale bars: 200 μm (insets 50 μm). f MDA production in tumor tissues. g Schematic description of the experimental design used to establish the animal model. h, i. Tumor weight (h) and tumor growth curves (i) in the nude mouse xenograft model. j, k IHC staining (j) and H-score (k) for 4-HNE in xenografts. Scale bars: 200 μm (insets 50 μm). l MDA production in tumor tissues. Data are presented as the mean ± SD of 6 biologically independent animals. All p-values were calculated using two-way ANOVA. *p < 0.05, **p < 0.01, ***p < 0.001.
Fig. 7
Fig. 7. H. pylori promotes cellular lipid peroxidation by upregulating GPX4 expression.
a–c MDA production (a), Lipid ROS (b), and relative ratio of GSH/GSSG (c) in AGS infected with H. pylori 26695 or H. pylori 11637 for 8 h (MOI = 200). dg Q-PCR analysis of TCF4 (d, f) and GPX4 (e, g) mRNA expression in AGS infected with H. pylori 26695 at different MOI and time points. h, i Western blot analysis of TCF4 and GPX4 protein expression in AGS infected with H. pylori 26695 at different time points (h) and MOI (i). j Q-PCR analysis of TCF4 mRNA expression in H. pylori-negative (n = 25) or H. pylori-positive (n = 19) human AG samples. k Q-PCR analysis of GPX4 mRNA expression in H. pylori-negative (n = 28) or H. pylori-positive (n = 23) human AG samples. l, m IHC staining (l) and H-score (m) of TCF4 in normal (n = 8) or in Hp (SSI)-infected mice (n = 8). Scale bars: 200 μm (insets 50 μm). n, o IHC staining (n) and H-score (o) of GPX4 in normal (n = 8) or in Hp (SSI)-infected mice (n = 8). Scale bars: 200 μm (insets 50 μm). p, q Q-PCR (p) and western blot (q) analysis of GPX4 expression in H. pylori-infected TCF4-KO GC cells. Data are presented as the mean ± SD of three independent experiments. The p-values in panels ag were calculated by one-way ANOVA. The p-values in panels j, k, m, o were calculated by two tailed unpaired Student’s t-test. The p-values in panel p were calculated by two-way ANOVA. ns not significant, *p < 0.05, **p < 0.01, ***p < 0.001.

Similar articles

Cited by

References

    1. Sung H, Ferlay J, Siegel RL, Laversanne M, Soerjomataram I, Jemal A, et al. Global Cancer Statistics 2020: GLOBOCAN estimates of incidence and mortality worldwide for 36 cancers in 185 countries. CA Cancer J Clin. 2021;71:209–49. doi: 10.3322/caac.21660. - DOI - PubMed
    1. Wang F, Meng W, Wang B, Qiao L. Helicobacter pylori-induced gastric inflammation and gastric cancer. Cancer Lett. 2014;345:196–202. doi: 10.1016/j.canlet.2013.08.016. - DOI - PubMed
    1. Amieva M, Peek RM., Jr Pathobiology of helicobacter pylori-induced gastric cancer. Gastroenterology. 2016;150:64–78. doi: 10.1053/j.gastro.2015.09.004. - DOI - PMC - PubMed
    1. Pan KF, Zhang L, Gerhard M, Ma JL, Liu WD, Ulm K, et al. A large randomised controlled intervention trial to prevent gastric cancer by eradication of Helicobacter pylori in Linqu County, China: baseline results and factors affecting the eradication. Gut. 2016;65:9–18. doi: 10.1136/gutjnl-2015-309197. - DOI - PubMed
    1. Cristescu R, Lee J, Nebozhyn M, Kim KM, Ting JC, Wong SS, et al. Molecular analysis of gastric cancer identifies subtypes associated with distinct clinical outcomes. Nat Med. 2015;21:449–56. doi: 10.1038/nm.3850. - DOI - PubMed

Publication types

MeSH terms

Substances