. 2022 May;54(5):581-592.
doi: 10.1038/s41588-022-01062-7. Epub 2022 May 9.

Within-sibship genome-wide association analyses decrease bias in estimates of direct genetic effects

Laurence J Howe  1   2 Michel G Nivard  3 Tim T Morris  4   5 Ailin F Hansen  6 Humaira Rasheed  4   6 Yoonsu Cho  4   5 Geetha Chittoor  7 Rafael Ahlskog  8 Penelope A Lind  9   10   11 Teemu Palviainen  12 Matthijs D van der Zee  3 Rosa Cheesman  13   14 Massimo Mangino  15   16 Yunzhang Wang  17 Shuai Li  18   19   20 Lucija Klaric  21 Scott M Ratliff  22 Lawrence F Bielak  22 Marianne Nygaard  23   24 Alexandros Giannelis  25 Emily A Willoughby  25 Chandra A Reynolds  26 Jared V Balbona  27   28 Ole A Andreassen  29   30 Helga Ask  31 Aris Baras  32 Christopher R Bauer  33   34 Dorret I Boomsma  3   35 Archie Campbell  36 Harry Campbell  37 Zhengming Chen  38   39 Paraskevi Christofidou  15 Elizabeth Corfield  31   40 Christina C Dahm  41 Deepika R Dokuru  27   28 Luke M Evans  28   42 Eco J C de Geus  3   43 Sudheer Giddaluru  44   45 Scott D Gordon  46 K Paige Harden  47 W David Hill  48   49 Amanda Hughes  4   5 Shona M Kerr  21 Yongkang Kim  28 Hyeokmoon Kweon  50 Antti Latvala  12   51 Deborah A Lawlor  4   5   52 Liming Li  53 Kuang Lin  38 Per Magnus  54 Patrik K E Magnusson  17 Travis T Mallard  47 Pekka Martikainen  55   56   57 Melinda C Mills  58 Pål Rasmus Njølstad  59   60 John D Overton  32 Nancy L Pedersen  17 David J Porteous  36 Jeffrey Reid  32 Karri Silventoinen  55 Melissa C Southey  20   61   62 Camilla Stoltenberg  45   63 Elliot M Tucker-Drob  47 Margaret J Wright  64 Social Science Genetic Association ConsortiumWithin Family ConsortiumJohn K Hewitt  27   28 Matthew C Keller  27   28 Michael C Stallings  27   28 James J Lee  25 Kaare Christensen  23   24   65 Sharon L R Kardia  22 Patricia A Peyser  22 Jennifer A Smith  22   66 James F Wilson  21   37 John L Hopper  18 Sara Hägg  17 Tim D Spector  15 Jean-Baptiste Pingault  14   67 Robert Plomin  14 Alexandra Havdahl  13   31   40 Meike Bartels  3 Nicholas G Martin  46 Sven Oskarsson  8 Anne E Justice  7 Iona Y Millwood  38   39 Kristian Hveem  6   68 Øyvind Naess  44   45 Cristen J Willer  6   69   70 Bjørn Olav Åsvold  6   68   71 Philipp D Koellinger  50   72 Jaakko Kaprio  12 Sarah E Medland  9   11   73 Robin G Walters  38   39 Daniel J Benjamin  74   75   76 Patrick Turley  77   78 David M Evans  4   79   80 George Davey Smith  4   5 Caroline Hayward  21 Ben Brumpton #  81   82   83 Gibran Hemani #  84   85 Neil M Davies #  86   87   88
Collaborators, Affiliations

Within-sibship genome-wide association analyses decrease bias in estimates of direct genetic effects

Laurence J Howe et al. Nat Genet. 2022 May.

Abstract

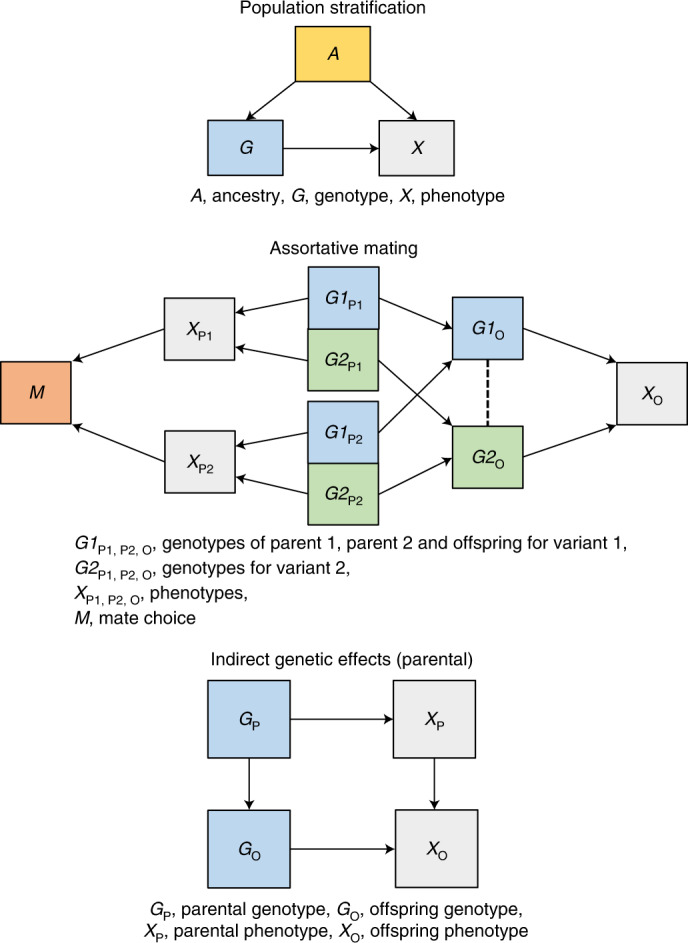
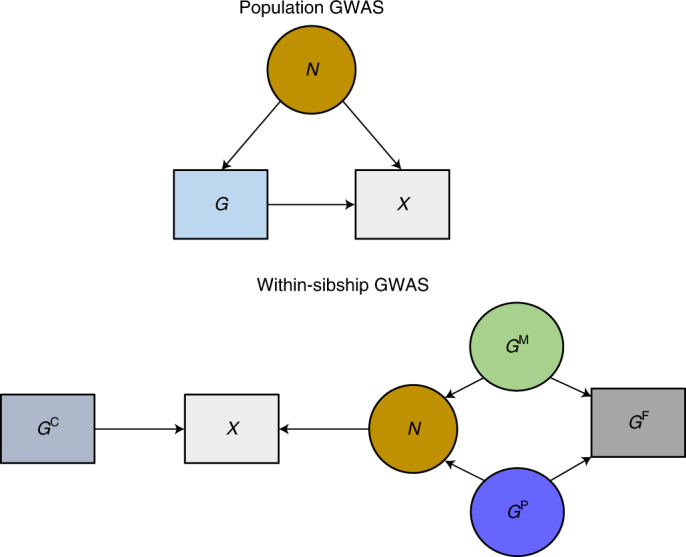
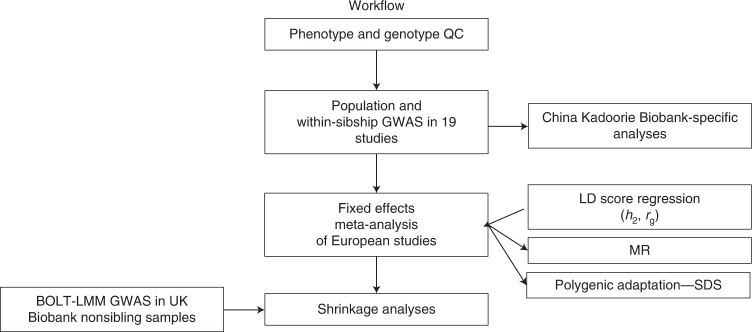
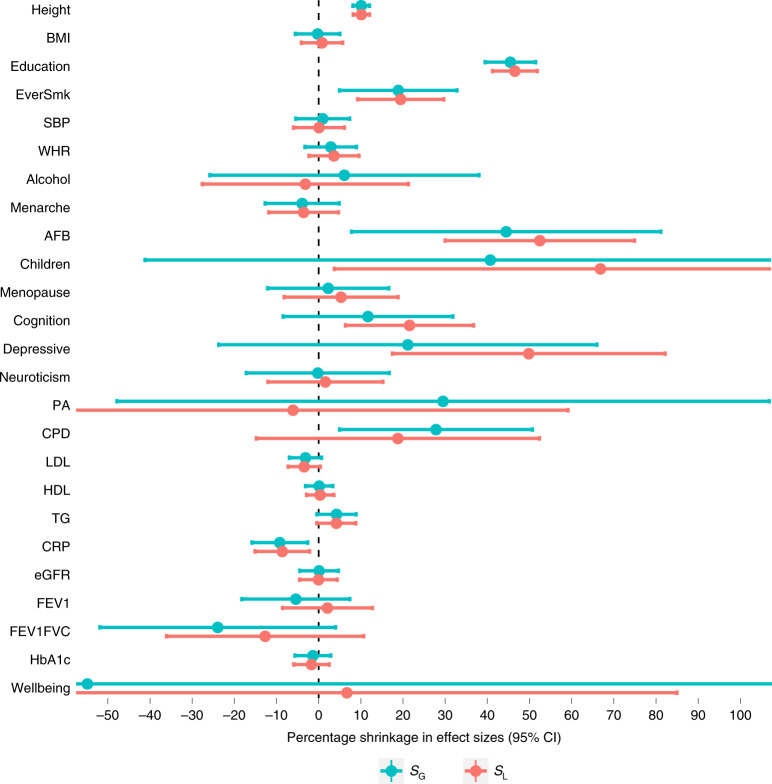
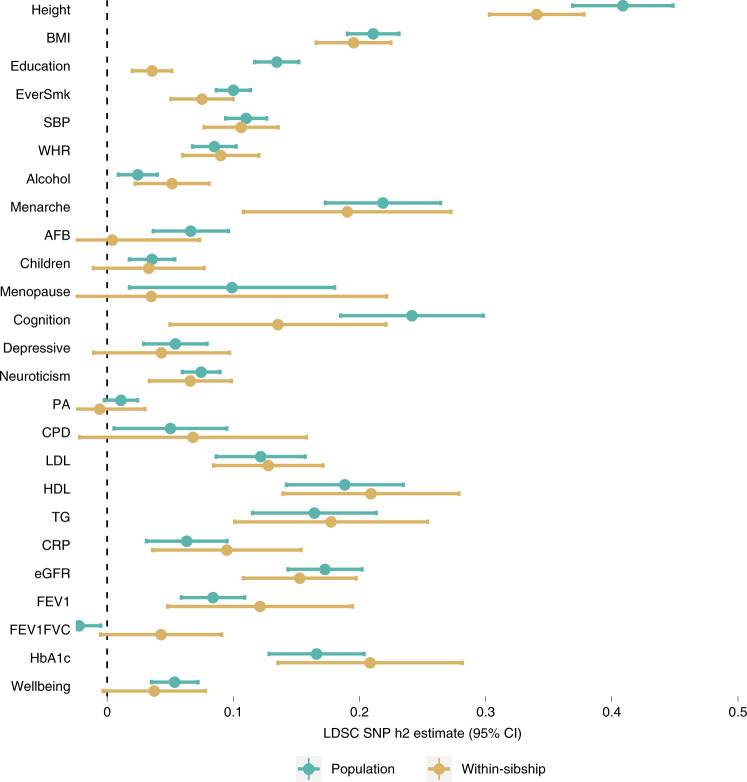
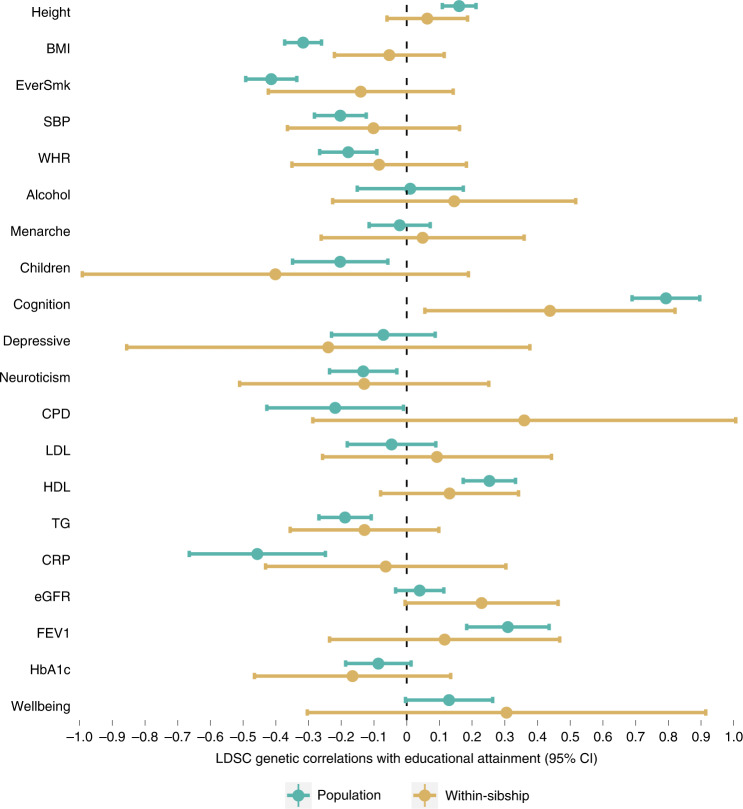
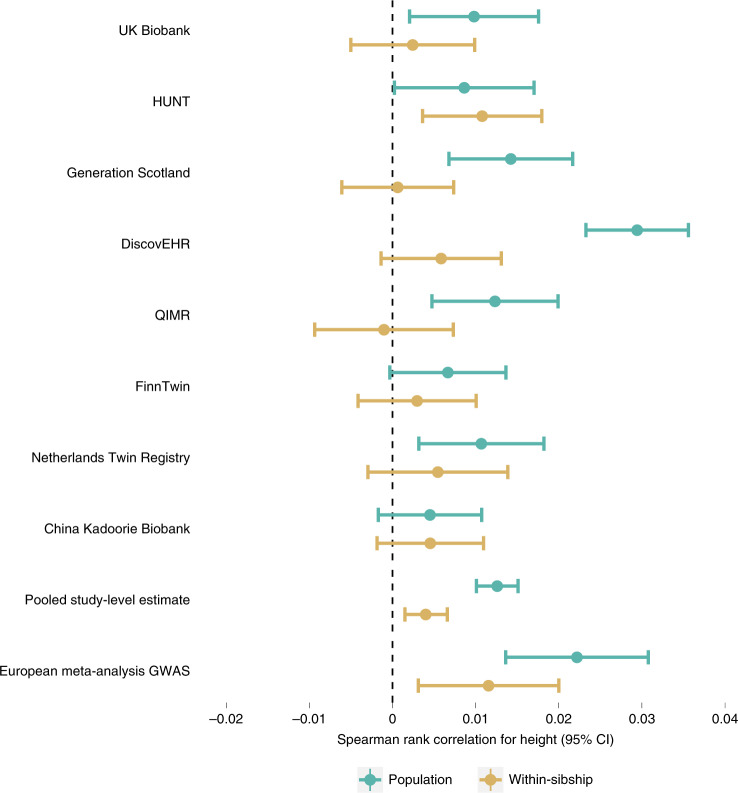
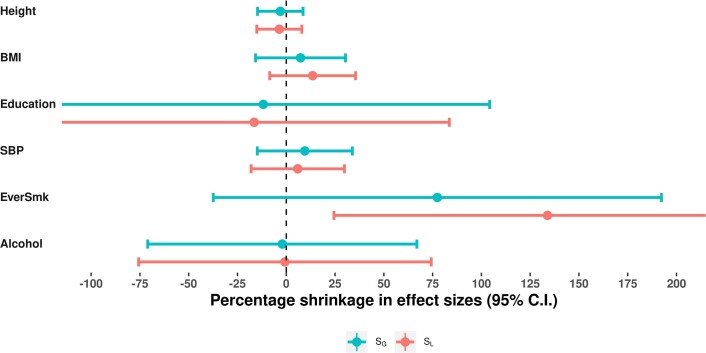
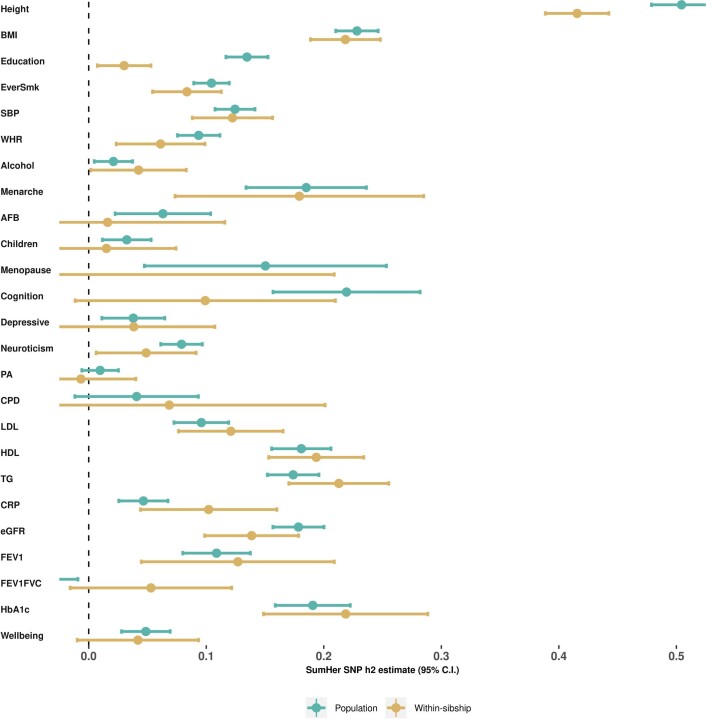
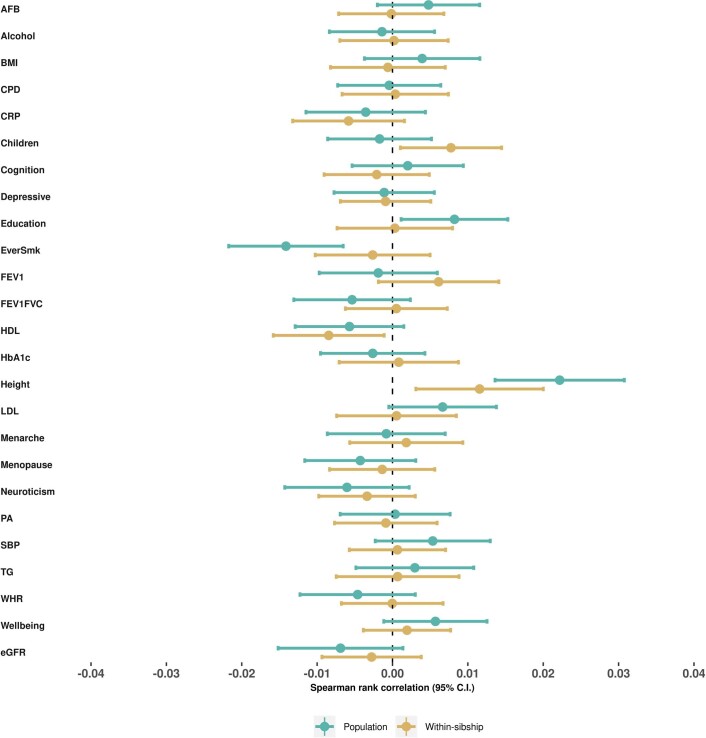
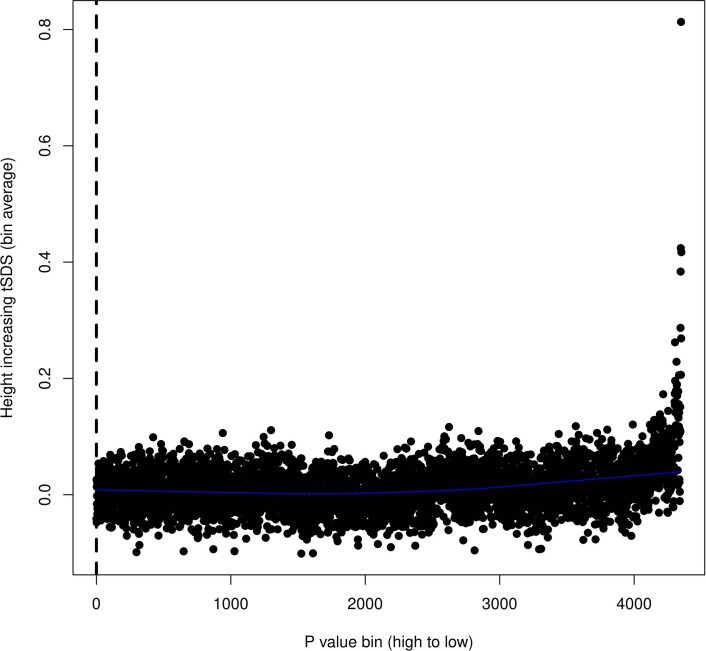
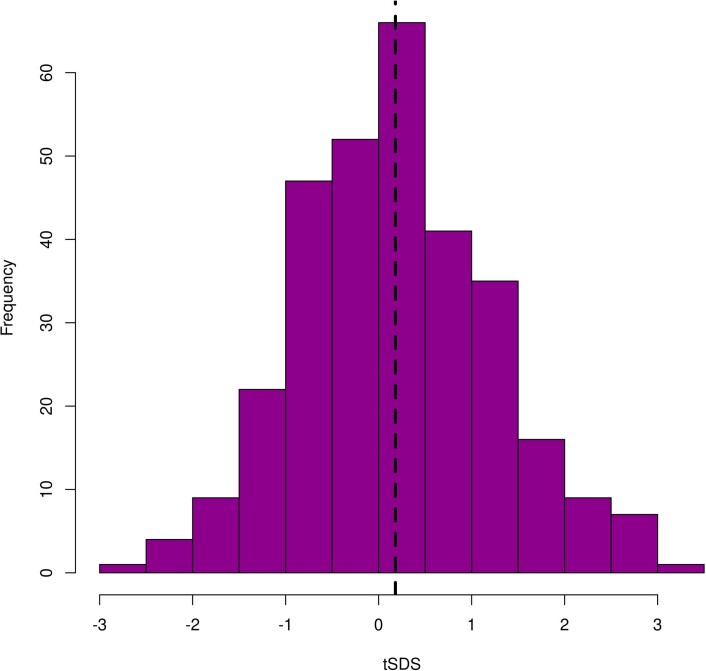
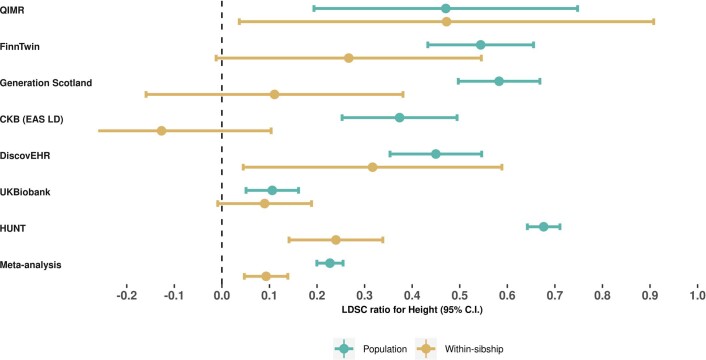
Estimates from genome-wide association studies (GWAS) of unrelated individuals capture effects of inherited variation (direct effects), demography (population stratification, assortative mating) and relatives (indirect genetic effects). Family-based GWAS designs can control for demographic and indirect genetic effects, but large-scale family datasets have been lacking. We combined data from 178,086 siblings from 19 cohorts to generate population (between-family) and within-sibship (within-family) GWAS estimates for 25 phenotypes. Within-sibship GWAS estimates were smaller than population estimates for height, educational attainment, age at first birth, number of children, cognitive ability, depressive symptoms and smoking. Some differences were observed in downstream SNP heritability, genetic correlations and Mendelian randomization analyses. For example, the within-sibship genetic correlation between educational attainment and body mass index attenuated towards zero. In contrast, analyses of most molecular phenotypes (for example, low-density lipoprotein-cholesterol) were generally consistent. We also found within-sibship evidence of polygenic adaptation on taller height. Here, we illustrate the importance of family-based GWAS data for phenotypes influenced by demographic and indirect genetic effects.


Conflict of interest statement

O.A.A. is a consultant to HealthLytix in a capacity unrelated to this work. All other authors declare no competing interests.

Figures

Fig. 1
Fig. 1. Demographic and indirect genetic effects.
Population stratification: population stratification is defined as the distortion of associations between a genotype and a phenotype when ancestry A influences both genotype G (via differences in allele frequencies) and the phenotype X. Principal components and linear mixed model methods control for ancestry but they may not completely control for fine-scale population structure. Assortative mating: assortative mating is a phenomenon where individuals select a partner based on phenotypic (dis)similarities. For example, tall individuals may prefer a tall partner. Assortative mating can induce correlations between causes of an assorted phenotype in subsequent generations. If a phenotype X is influenced by two independent genetic variants G1 and G2 then assortment on X (represented by effects of X on mate choice M) will induce positive correlations between G1 in parent 1 and G2 in parent 2 and vice versa. Parental transmission will then induce correlations between otherwise independent G1 and G2 in offspring. These correlations can distort genetic association estimates. Indirect genetic effects: indirect genetic effects are effects of relative genotypes (via relative phenotypes and the shared environment) on the index individual’s phenotype. These indirect effects influence population GWAS estimates because relative genotypes are also associated with genotypes of the index individual. Indirect genetic effects of parents on offspring are of most interest because they are likely to be the largest. However, indirect genetic effects of siblings or more distal relatives are also possible.
Fig. 2
Fig. 2. Population GWAS estimate the association between raw genotypes G and phenotypes X.
As outlined in Fig. 1, estimates from population GWAS may not fully control for demography (population stratification and assortative mating) and may also capture indirect genetic effects of relatives. For simplicity we use N to represent all sources of associations between G and X that do not relate to direct effects of G. Circles indicate unmeasured variables and squares indicate measured variables. If parental genotypes are known, G can be separated into nonrandom (determined by parental genotypes) and random (relating to segregation at meiosis) components. Within-sibship GWAS include the mean genotype across a sibship (GF) (a proxy for the mean of the paternal and maternal genotypes GP, M) as a covariate to capture associations between G and X relating to parents. The within-sibship estimate is defined as the effect of the random component: that is, the association between family-mean-centered genotype GC (that is, G − GF) and X. Demography and indirect genetic effects of parents (N) will be captured by GF. The association between GC and X will not be influenced by these sources of association but could be affected by indirect effects of the siblings themselves, which are not controlled for.
Fig. 3
Fig. 3. A flowchart of analyses undertaken in this project.
We started by performing quality control and running GWAS models in 19 individual cohorts. We then meta-analyzed GWAS data from 18 of these cohorts with European-ancestry individuals. We then used the European meta-analysis data for downstream analyses including LDSC, MR and polygenic adaptation testing. We performed analyses in the China Kadoorie Biobank separately. QC, quality control.
Fig. 4
Fig. 4. Estimates of shrinkage between population and within-sibship models with corresponding 95% CIs.
Shrinkage is defined as the % decrease in association between the relevant weighted score and phenotype when comparing the population estimate with the within-sibship estimate. Shrinkage was computed as the ratio of two weighted score association estimates with standard errors derived using leave-one-out jackknifing. The number of individuals contributing to each phenotype ranged from n = 149,174 for height to n = 13,375 for age at menopause. Further information on the sample sizes of each phenotype is contained in Supplementary Table 2. SG, weighted score at genome-wide significance (P < 5 × 10−8); SL, weighted score at more liberal threshold (P < 1 × 10−5); Education, educational attainment; EverSmk, ever smoking; WHR, waist-to-hip ratio; Alcohol, weekly alcohol consumption; Menarche, age at menarche; AFB, age at first birth; Children, number of biological children; Menopause, age at menopause; Cognition, cognitive ability; Depressive, depressive symptoms; PA, physical activity; CPD, cigarettes per day; LDL, low-density lipoprotein-cholesterol; HDL, HDL-cholesterol; TG, triglycerides; eGFR, estimated glomerular filtration rate; FEV1, forced expiratory volume; FEV1FVC, ratio of FEV1/forced vital capacity; HbA1c, hemoglobin A1C.
Fig. 5
Fig. 5. LDSC SNP h2 estimates for 25 phenotypes using population and within-sibship meta-analysis data with corresponding 95% CIs.
The number of individuals contributing to each phenotype ranged from n = 149,174 for height to n = 13,375 for age at menopause. BMI, body mass index; Education, educational attainment; EverSmk, ever smoking; SBP, systolic blood pressure; WHR, waist-hip ratio; Alcohol, weekly alcohol consumption; Menarche, age at menarche; AFB, age at first birth; Children, number of biological children; Menopause, age at menopause; Cognition, cognitive ability; Depressive, depressive symptoms; PA, physical activity; CPD, cigarettes per day; LDL, LDL cholesterol; HDL, HDL cholesterol; TG, triglycerides; CRP, C-reactive protein; eGFR, estimated glomerular filtration rate; FEV1, forced expiratory volume; FEV1FVC, ratio of FEV1/forced vital capacity; HbA1c, Haemoglobin A1C. Further information on the sample sizes of each phenotype is contained in Supplementary Table 2.
Fig. 6
Fig. 6. LDSC rg estimates between educational attainment and 20 phenotypes using population and within-sibship meta-analysis data with corresponding 95% CIs.
The number of individuals contributing to the educational attainment GWAS was n = 128,777 with sample sizes for outcomes ranging from n = 149,174 for height to n = 27,638 for cognitive ability. BMI, body mass index; Education, educational attainment; EverSmk, ever smoking; SBP, systolic blood pressure; WHR, waist-hip ratio; Alcohol, weekly alcohol consumption; Menarche, age at menarche; AFB, age at first birth; Children, number of biological children; Menopause, age at menopause; Cognition, cognitive ability; Depressive, depressive symptoms; CPD, cigarettes per day; LDL, LDL cholesterol; HDL, HDL cholesterol; TG, triglycerides; CRP, C-reactive protein; eGFR, estimated glomerular filtration rate; FEV1, forced expiratory volume; HbA1c, Haemoglobin A1C. Further information on the sample sizes of each phenotype is contained in Supplementary Table 2.
Fig. 7
Fig. 7. Spearman rank correlation estimates and corresponding 95% CIs between tSDS (SDS aligned with height-increasing alleles) and absolute height Z scores.
Positive correlations indicate evidence of historical positive selection on height-increasing alleles. The pooled estimate is a meta-analysis of the correlation estimates from the individual studies shown above while the European meta-analysis estimate is the correlation estimate using the meta-analysis GWAS data. The number of individuals in the meta-analysis estimate was n = 149,174 with the sample sizes for the displayed individual studies ranging from n = 40,068 in UK Biobank to 4,708 in the Netherlands Twin Register. Further information on available height data in each phenotype is contained in Supplementary Table 1. QIMR, Queensland Institute of Medical Research.
Extended Data Fig. 1
Extended Data Fig. 1. Within-sibship shrinkage for height across European ancestry cohorts.
AMDTSS = Australian Mammographic Density Twin Study, DTR = Danish Twins Registry, NTR = Netherlands Twin Registry, QIMR = QIMR Berghofer Medical Research Institute (QIMR), TEDS = Twins Early Development Study. Extended Data Figure 1 shows estimates of within-sibship shrinkage and 95% confidence intervals for height variants in all of the cohorts contributing to the European meta-analysis as well as the meta-analysis GWAS. Shrinkage is defined as the % decrease in association between the relevant weighted score and phenotype when comparing the population estimate to the within-sibship estimate. Shrinkage was computed as the ratio of two weighted score association estimates with standard errors derived using leave-one-out jackknifing. These estimates used the weighted score for each phenotype at the more liberal threshold (P < 1×10⁻⁵). The total number of individuals in the meta-analysis was n = 149,174 with individual study sample sizes ranging from n = 601 for the Colorado based CADD study to n = 40,068 for UK Biobank. Further information on samples with height data in each cohort are contained in Supplementary Table 1.
Extended Data Fig. 2
Extended Data Fig. 2. Within-sibship shrinkage for educational attainment across European ancestry cohorts.
AMDTSS = Australian Mammographic Density Twin Study, DTR = Danish Twins Registry, NTR = Netherlands Twin Registry, QIMR = QIMR Berghofer Medical Research Institute (QIMR).Extended Data Figure 2 shows estimates of within-sibship shrinkage and 95% confidence intervals for educational attainment variants in all of the cohorts contributing to the European meta-analysis as well as the meta-analysis GWAS. Shrinkage is defined as the % decrease in association between the relevant weighted score and phenotype when comparing the population estimate to the within-sibship estimate. Shrinkage was computed as the ratio of two weighted score association estimates with standard errors derived using leave-one-out jackknifing. These estimates used the weighted score for each phenotype at the more liberal threshold (P < 1×10⁻⁵). The total number of individuals in the meta-analysis was n = 128,777 with individual study sample sizes ranging from n = 742 for STR Psych Cohort 1 to n = 39,531 for UK Biobank. Further information on samples with educational attainment data in each cohort are contained in Supplementary Table 1.
Extended Data Fig. 3
Extended Data Fig. 3. Within-sibship shrinkage estimates from China Kadoorie Biobank.
SG = score including variants with P < 5×10⁻⁸, SL = score including variants with P < 1×10⁻⁵, BMI = body mass index, SBP = systolic blood pressure, EverSmk = ever smoking. Extended Data Figure 3 contains within-sibship shrinkage estimates and 95% confidence intervals for height, BMI, educational attainment, systolic blood pressure and ever-smoking genetic variants in China Kadoorie Biobank. Shrinkage is defined as the % decrease in association between the relevant weighted score and phenotype when comparing the population estimate to the within-sibship estimate. Shrinkage was computed as the ratio of two weighted score association estimates with standard errors derived using leave-one-out jackknifing. The figure includes genetic variants from the genome-wide significant (blue) and liberal (red) thresholds. Note that the genetic variants tested were identified in UK Biobank, but any ancestral differences will likely equally affect both the population and within-sibship estimates, meaning that the shrinkage estimate are unlikely to be biased by ancestral differences. Data was available from n = 13,856 individuals for each of the 6 phenotypes.
Extended Data Fig. 4
Extended Data Fig. 4. SumHer SNP heritability estimates.
BMI = body mass index, Education = educational attainment, EverSmk = ever smoking, SBP = systolic blood pressure, WHR = waist-hip ratio, Alcohol = weekly alcohol consumption, Menarche = age at menarche, AFB = age at first birth, Children = number of biological children, Menopause = age at menopause, Cognition = cognitive ability, Depressive = depressive symptoms, PA = physical activity, CPD = cigarettes per day, LDL = LDL cholesterol, HDL = HDL cholesterol, TG = triglycerides, CRP = C-reactive protein, eGFR = estimated glomerular filtration rate, FEV1 = forced expiratory volume, FEV1FVC = ratio of FEV1/forced vital capacity, HbA1c = Haemoglobin A1C. Extended Data Figure 4 displays SumHer SNP h2 (LDAK-thin model) estimates and corresponding 95% confidence intervals for 25 phenotypes using population and within-sibship meta-analysis data. The number of individuals contributing to each phenotype ranged from n = 149,174 for height to n = 13,375 for age at menopause. Further information on the sample sizes of each phenotype are contained in Supplementary Table 2.
Extended Data Fig. 5
Extended Data Fig. 5. Evidence of polygenic adaption using SDS for 25 phenotypes.
BMI = body mass index, EverSmk = ever smoking, SBP = systolic blood pressure, WHR = waist-hip ratio, AFB = age at first birth, PA = physical activity, CPD = cigarettes per day, TG = triglycerides, CRP = C-reactive protein, eGFR = estimated glomerular filtration rate, FEV1 = forced expiratory volume, FEV1FVC = ratio of FEV1/forced vital capacity, HbA1c = Haemoglobin A1C. Extended Data Figure 5 displays spearman rank correlation estimates and corresponding 95% confidence intervals between tSDS (SDS aligned with phenotype increasing alleles) and absolute phenotype Z scores for 25 phenotypes. The phenotype Z scores were taken from both the meta-analysis of population (blue) and within-sibship (red) estimates. Positive correlations indicate evidence of historical positive selection on phenotype increasing alleles. The number of individuals contributing to each phenotype ranged from n = 149,174 for height to n = 13,375 for age at menopause. Further information on the sample sizes of each phenotype are contained in Supplementary Table 2.
Extended Data Fig. 6
Extended Data Fig. 6. Scatter plot of SDS p-value bins against mean tSDS (of the bin) using the within-sibship height meta-analysis GWAS data.
In Extended Data Figure 6 each data point is the mean tSDS (SDS alligned with height increasing allele) in a set of 1000 genetic variants. Genetic variants were ordered by height P-value (from within-sibship meta-analysis GWAS data) and divided into bins. The plot illustrates evidence of a correlation between decreasing height P-value and higher mean tSDS suggestive of polygenic adaptation on height increasing alleles. The within-sibship European GWAS meta-analysis data (n = 149,174 individuals) were used for this analysis.
Extended Data Fig. 7
Extended Data Fig. 7. Histogram of tSDS for independent variants associated with height in the within-sibship meta-analysis data (P < 1×10⁻⁵).
Extended Data Figure 7 Extended Data Figure 7 is a histogram of the distribution of tSDS (SDS aligned with height increasing alleles) amongst 310 putative independent height loci identified from the within-sibship meta-analysis data (P < 1×10⁻⁵). The plot indicates that the mean tSDS of these loci is higher than 0, consistent with polygenic adaptation on height increasing alleles. The within-sibship European GWAS meta-analysis data (n = 149,174 individuals) were used for this analysis.
Extended Data Fig. 8
Extended Data Fig. 8. LDSC estimates of confounding across 25 phenotypes using within-sibship data.
BMI = body mass index, EverSmk = ever smoking, SBP = systolic blood pressure, WHR = waist-hip ratio, AFB = age at first birth, PA = physical activity, CPD = cigarettes per day, TG = triglycerides, CRP = C-reactive protein, eGFR = estimated glomerular filtration rate, FEV1 = forced expiratory volume, FEV1FVC = ratio of FEV1/forced vital capacity, HbA1c = Haemoglobin A1C. Extended Data Figure 8 shows LDSC ratio estimates and corresponding 95% confidence intervals 25 phenotypes using the within-sibship meta-analysis data. The LDSC ratio is a measure of the % of the polygenic signal attributable to confounding in a GWAS dataset. The number of individuals contributing to each phenotype ranged from n = 149,174 for height to n = 13,375 for age at menopause. Further information on the sample sizes of each phenotype are contained in Supplementary Table 2.
Extended Data Fig. 9
Extended Data Fig. 9. LDSC ratios from height GWAS.
Extended Data Figure 9 shows LDSC ratio estimates and corresponding 95% confidence intervals for height GWAS from the summary data of 7 individual studies and the meta-analysis of European studies. The LDSC ratio is a measure of the % of the polygenic signal attributable to confounding in a GWAS dataset. The number of individuals in the meta-analysis estimate was n = 149,174 with the sample sizes for the displayed individual studies ranging from n = 40,068 in UK Biobank to 8,810 in the Finnish Twin Cohort. Further information on available height data in each phenotype are contained in Supplementary Table 1.

References

    1. Visscher PM, et al. 10 years of GWAS discovery: biology, function, and translation. Am. J. Hum. Genet. 2017;101:5–22. doi: 10.1016/j.ajhg.2017.06.005. - DOI - PMC - PubMed
    1. Mills MC, Rahal C. A scientometric review of genome-wide association studies. Commun. Biol. 2019;2:9. doi: 10.1038/s42003-018-0261-x. - DOI - PMC - PubMed
    1. Risch N, Merikangas K. The future of genetic studies of complex human diseases. Science. 1996;273:1516–1517. doi: 10.1126/science.273.5281.1516. - DOI - PubMed
    1. Morris TT, Davies NM, Hemani G, Davey Smith G. Population phenomena inflate genetic associations of complex social traits. Sci. Adv. 2020;6:eaay0328. doi: 10.1126/sciadv.aay0328. - DOI - PMC - PubMed
    1. Fisher, R. A. The Genetical Theory of Natural Selection (Oxford Univ. Press, 1930).

Publication types

MeSH terms

LinkOut - more resources