. 2022 May;54(5):625-636.
doi: 10.1038/s41588-022-01063-6. Epub 2022 May 9.

The disordered N-terminal domain of DNMT3A recognizes H2AK119ub and is required for postnatal development

Affiliations

The disordered N-terminal domain of DNMT3A recognizes H2AK119ub and is required for postnatal development

Tianpeng Gu et al. Nat Genet. 2022 May.

Abstract

DNA methyltransferase 3a (DNMT3A) plays a crucial role during mammalian development. Two isoforms of DNMT3A are differentially expressed from stem cells to somatic tissues, but their individual functions remain largely uncharacterized. Here we report that the long isoform DNMT3A1, but not the short DNMT3A2, is essential for mouse postnatal development. DNMT3A1 binds to and regulates bivalent neurodevelopmental genes in the brain. Strikingly, Dnmt3a1 knockout perinatal lethality could be partially rescued by DNMT3A1 restoration in the nervous system. We further show that the intrinsically disordered N terminus of DNMT3A1 is required for normal development and DNA methylation at DNMT3A1-enriched regions. Mechanistically, a ubiquitin-interacting motif embedded in a putative α-helix within the N terminus binds to mono-ubiquitinated histone H2AK119, probably mediating recruitment of DNMT3A1 to Polycomb-regulated regions. These data demonstrate an isoform-specific role for DNMT3A1 in mouse postnatal development and reveal the N terminus as a necessary regulatory domain for DNMT3A1 chromatin occupancy and functions in the nervous system.


Conflict of interest statement

Competing interests

The authors declare no competing interests.

Figures
Extended Data Fig. 1
Extended Data Fig. 1. Expression Expression profiles of DNMT3A isoforms in mouse postnatal tissues and unaltered cell populations in the spleen and thymus of Dnmt3a1−/− mice.
a, RT-qPCR expression analysis of Dnmt3a and its transcript variants in wildtype mouse tissues at P18. n = 2 biological independent mice. Data are presented as mean with individual values. b, A diagram representing the generation of Dnmt3a-FLAG knock-in (KI) mouse model. 3×FLAG tag was added to the C terminus of the endogenous Dnmt3a by CRISPR-Cas9 mediated homologous recombination. Linker amino acid sequences: GGSG. c, Western blots for DNMT3A isoforms within P18 Dnmt3a-FLAG mouse tissues. The left panel shows specific detection of FLAG-tagged DNMT3A isoforms in the KI mouse thymus. The experiment was repeated two times independently with similar results. d, Alignment of the sequence of residual N-terminal fragment potentially left in cells after exon 4 deletion to that of DNMT3A1. The reading frame shifts after Proline 56, and the premature stop codon occurs 11 amino acids afterwards. e, Western blots to verify the loss of DNMT3A1 or DNMT3A2 protein respectively in P18 knockout mouse thymuses and cortices. Samples of each genotype were biological replicates. f, Quantification of DNMT3A1 expression in Western blot analysis of P18 mouse cortices (e, right). n = 2 biological independent samples. Data are shown as mean with individual values. gh, Smaller spleens in P21 Dnmt3a1−/− mice. Representative images of KO and WT spleens are shown (g). Spleen weight was normalized to the body weight (h). Data are shown as mean ± SEM. ** P = 0.0014; ns: not significant, P = 0.9707 (two-sided unpaired t tests). ij, Smaller thymuses in P21 Dnmt3a1−/− mice. Data are shown as mean ± SEM (j). * P = 0.0142; ns: not significant, P = 0.4033 (two-sided unpaired t tests). k, Flow cytometry analysis of cell populations on viable splenic cells from a WT mouse: Gr1/Mac-1 for myeloid cells, CD4/CD8 for T cells and B220 for B cells. The sequential gating strategy is displayed in Supplementary Fig. 1. l, Quantification of frequencies for cell subsets as shown in (k). Data are presented as mean ± SD. m, A representative flow cytometry plot of CD4 and CD8 on viable thymocytes from a WT mouse. SP: single positive; DP: double positive, DN: double negative. The sequential gating strategy is provided in Supplementary Fig. 2. n, Quantification of frequencies for cell subsets as shown in (m). Data are presented as mean ± SD. The number of mice analyzed in (h, l) and (j, n): WT littermates for Dnmt3a1 KO, n = 4; Dnmt3a1 KO, n = 5; WT littermates for Dnmt3a2 KO, n = 4; Dnmt3a2 KO, n = 5.
Extended Data Fig. 2
Extended Data Fig. 2. General morphology and cell populations in Dnmt3a1−/− mouse brain.
ac, Double immunofluorescence (IF) staining for DNMT3A1 and the neuronal marker NEUN (a), astroglial marker SOX9 (b), or oligodendroglial marker OLIG2 (c) on sagittal brain sections of P23 WT mice. White arrows point to cells positive for SOX9 or OLIG2. IF was performed with an N-terminal anti-DNMT3A antibody which is DNMT3A1-specific. Section thickness: 15 μm. Scale bar = 100 μm. d, Quantification of DNMT3A1 signal intensity in DNMT3A1 positive and NEUN, SOX9, or OLIG2 positive cells in the same IF images. Positive cells were detected and measured using QuPath software. e, Dnmt3a1−/− mice had smaller brains, but the ratio of brain to body weight was greater than WT littermates at P21. WT, n = 8; Dnmt3a1 KO, n = 7. All data are presented as mean ± SD with individual values. P values for brain weight, *** P = 0.0005; body weight, **** P < 0.0001 and brain/body ratio, **** P < 0.0001 (two-sided unpaired t tests). f, Normal brain morphology of Dnmt3a1−/− mouse revealed by Nissl staining of sagittal brain sections. Scale bar = 1.0 mm. The experiment was repeated two times with independent biological samples. g, IF staining showing deficiency of DNMT3A1 protein and unaltered cell populations of neurons (NEUN+), astrocytes (SOX9+) and oligodendrocytes (OLIG2+) in the cerebral cortex of Dnmt3a1−/− mice at P23. Scale bar = 100 μm. The experiment was repeated three times and cell counts are provided below. h, Schematic representation of a sagittal section of the mouse brain. The black squares indicate regions selected for cell counting. i, Percentages of neurons, astrocytes, and oligodendrocytes in the indicated brain regions (h) of Dnmt3a1−/− (n = 3) and WT (n = 3) mice. Two sections from each mouse brain were stained for each cell marker. All data are presented as mean ± SD. j, Representative IF staining for NEUN and the motoneuron-specific marker ChAT on coronal sections through the hypoglossal nucleus of P23 mouse brain. Motor neurons are positive for both ChAT and NEUN. Scale bar = 100 μm. The experiment was repeated two times. k, Total numbers of motor neurons in the hypoglossal nucleus of Dnmt3a1−/− (n = 3) and WT (n = 2) mice. Data are presented as mean with individual values.
Extended Data Fig. 3
Extended Data Fig. 3. Correlation between DNMT3A1 and H3K27me3 across gene bodies and gene expression analysis for Dnmt3a1−/− mouse brain.
a, Heatmaps of H3K4me3, H3K27me3 and DNMT3A1 across genes (left) in P18 Dnmt3a-FLAG cortex. Genes were ranked by H3K4me3 occupancy, and the curves represent smoothing cubic splines (right) fitted by the median signals of H3K27me3 and DNMT3A1 across each gene. b, Unchanged expression levels of DNA methylation regulators in Dnmt3a1−/− cortex. TPM: transcripts per million. WT, n = 3; Dnmt3a1 KO, n = 3 biological replicates. Data are shown as mean ± SD. *** P = 0.0002 (two-sided unpaired t test). c, RT-qPCR verification of depletion of Dnmt3a1 full-length transcripts and downregulation of neural development-related genes in P21 Dnmt3a1−/− cerebral cortex. The expression level of each gene was normalized to that of Gapdh. WT, n = 4; Dnmt3a1 KO, n = 5 biological replicates. Data are shown as mean with SD. P values for Dnmt3a1, **** P < 0.0001; Neurod6, * P = 0.0173; Bdnf, * P = 0.0280; Wnt7a, *** P = 0.0002 (two-sided unpaired t tests). de, Heatmaps highlighting the relative expression level of members in gene sets Synapse assembly (d) and Neuromuscular process (e). f, RT-qPCR verification of expression changes for selected members in gene sets synapse assembly and neuromuscular process in P21 Dnmt3a1−/− cerebral cortex. WT, n = 4; Dnmt3a1 KO, n = 5 biological replicates. Data are shown as mean ± SD. P values for Wnt5a, ** P = 0.0081; Homer1, * P = 0.0215; Shank1, *** P = 0.0006; Shank2, ** P = 0.0053 (two-sided unpaired t tests). g, GSEA of Dnmt3a1−/− hippocampal transcriptome. Top dysregulated gene sets were listed and ranked by NES. h, Enrichment plots for down-regulated gene set regulation of synaptic transmission in Dnmt3a1−/− hippocampus. i, Heatmap and average density of wildtype DNMT3A1 binding across DEGs (up- or down-DEGs) and non-DEGs (other) of Dnmt3a1−/− cortex. Input was subtracted from the signal of DNMT3A1 ChIP-seq. Genes are ordered by P values, with up-DEGs and down-DEGs on the top and bottom ends, respectively.
Extended Data Fig. 4
Extended Data Fig. 4. DNMT3A1 N-terminal domain is an intrinsically disordered region.
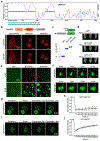
a, Prediction of intrinsic disorder for DNMT3A1 by PONDR (Predictor of Natural Disordered Regions) online. Amino acid positions are shown on the x axis. The cyan bars designate the N-terminal regions investigated. b, Fluorescence images of living Hela cells expressing Cry2-mCherry or N-terminal IDR fusion proteins (optoN219 and optoN278). All cells were subjected to 488 nm blue light stimulation under identical conditions. The experiment was repeated three times independently with similar results. Representative images after 80-second stimulation are presented. Scale bar = 10 μm. c, Purification of 6×His tagged GFP and N-terminal IDR-GFP fusion proteins for in vitro droplet formation assay. d, Visualization of turbidity of indicated protein solutions (20 μM) in droplet formation buffer in the absence (−) or presence (+) of 8% PEG-8000. e, Representative images of GFP-positive spherical protein droplets formed at concentrations of 5 μM and 20 μM. Proteins were diluted to the final concentrations with droplet formation buffer in the presence of 8% PEG-8000. The experiment was repeated four times with similar results. Scale bar = 20 μm. f, Fusion events between proximal droplets of N219-GFP (top) or N278-GFP (bottom). g, Live-cell images of FRAP analysis on GFP-DNMT3A1 expressed in NIH 3T3 cells. Scale bar = 10 μm. h, Average fluorescence recovery trace in GFP-DNMT3A1 FRAP experiments (n = 12 cells). All data are presented as mean ± SD. i, Live-cell images of FRAP analysis on GFP-MeCP2. Scale bar = 10 μm. j, Average fluorescence recovery trace in GFP-MeCP2 FRAP experiments (n = 6 cells).
Extended Data Fig. 5
Extended Data Fig. 5. Dnmt3a1ΔN mice showed a reduced rate of weight gain and impaired behaviors.
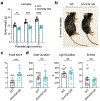
a, Body weights of female Dnmt3a1ΔN (n = 5) mice and WT littermates (n = 5) at the age of 2, 4 and 6 months. Data are shown as mean ± SD. ** P = 0.003166; *** P = 0.000360; **** P < 0.0001 (multiple t tests). b, Representative images of Dnmt3a1ΔN and WT females at 6 months. c, Dnmt3a1ΔN mice exhibited an increase in fecal boli deposits during 30-min open field test. **** P < 0.0001 (two-sided unpaired t tests). d, Dnmt3a1ΔN mice showed a similar level of anxiety with WT littermates in a Light-dark exploration test. ns: not significant (two-sided unpaired t tests), dark duration, P = 0.5814; light duration, P = 0.5810; entries, P = 0.4214. The number of mice analyzed in (cd): Dnmt3a1ΔN, n = 19; WT, n = 16. Data are shown as mean ± SEM with individual values.
Extended Data Fig. 6
Extended Data Fig. 6. DNA methylation and gene expression analyses for Dnmt3a1−/−, Dnmt3a2−/− and Dnmt3a1ΔN P21 cortices.
a, Average levels, and changes of CpG methylation genome-wide (overall), and at various genomic features in the cerebral cortex of WT, Dnmt3a1−/−, Dnmt3a2−/− and Dnmt3a1ΔN P21 mice. Promoters: 2,000 bp upstream to 500 bp downstream of TSSs. Canyons were defined as long unmethylated regions (UMRs) over 3.5 kb with an average methylation level < 0.1 in WT cortices (n = 855). CGI or Canyon shores: ± 2 kb regions flanking CGI or Canyons. Data are shown as mean with individual values. b, Genome-wide average CpH (non-CpG) methylation levels in WT and KO cerebral cortices (n = 2 biological replicates each genotype). Data are shown as mean with individual values. c, DNA methylation levels across bivalent genes and two other clusters of genes defined in Figure 2a. d, Scatterplot of DMR methylation levels in KOs and WT. Each dot represents a DMR. Regions with methylation difference less than 0.1 are not included, giving rise to the gaps. e, Smooth curves of the percentage of each gene covered by DMRs in KO cortices. Genes were ordered by wildtype DNMT3A signal (Figure 5h). f, Venn diagram of overlapping DMRs (FDR < 0.05) between KO cortices. g, Venn diagram representations of overlapping up-regulated DEGs (left, P < 0.01) and down-regulated DEGs (right) between KOs. h, GSEA analysis of KO cortex transcriptomes. GO terms (biological processes) with FDR < 0.05 in any of the differential expression analysis (Dnmt3a1 KO vs WT, Dnmt3a2 KO vs WT, or Dnmt3a1ΔN vs WT) were included (n = 49).
Extended Data Fig. 7
Extended Data Fig. 7. Neuron nuclei sorting from the cerebral cortex.
a, Flow cytometry analysis of purified cortical cell nuclei by sucrose ultracentrifugation. NEUN-positive single nuclei were sorted and used for DNA/RNA extraction and ChIP experiments. b, Representative IF images of presort and sorted nuclei. The purity of sorted neuron nuclei was above 95%, and it was checked for every sample after sorting. Scale bar = 50 μm.
Extended Data Fig. 8
Extended Data Fig. 8. DNA methylation and gene expression analyses in sorted neuron nuclei.
a, Violin plots for the distribution of average CpG methylation ratios of 5 kb bins (top) and CpH methylation ratio of 50 kb bins (bottom) over the genome in WT, Dnmt3a1−/−, Dnmt3a2−/− and Dnmt3a1ΔN neuron nuclei (n = 2 biological replicates each genotype). The lower and upper hinges of boxplots correspond to the first and third quartiles. The lower or upper whisker extends from the hinge to the smallest or largest value within 1.5×IQR of the hinge respectively. b, DNA methylation levels at Canyons (left), CpG islands (right) and flanking regions. c, IGV displays of DNMT3A1 (cortex), H3K4me3, H3K27me3 and H2AK119ub enrichment in Dnmt3a-FLAG neuron nuclei, and CpG methylation in WT and KO neuron nuclei at Bmp7 gene locus. The differentially methylated region is highlighted in light green. d, Heatmaps for relative CpG methylation levels at Dnmt3a1−/− DMRs (FDR < 0.05) in WT, Dnmt3a1−/−, Dnmt3a2−/− and Dnmt3a1ΔN neuron nuclei. Overlapping DMRs in Dnmt3a2−/− or Dnmt3a1ΔN neuron genome are displayed on the right. e, Identification of enhancers (poised and active) by histone modifications H3K4me1, H3K4me3 and H3K27ac. H3K27me3 and DNMT3A1 were plotted accordingly. f, Average DNA methylation levels at poised and active enhancers in in WT, Dnmt3a1−/−, Dnmt3a2−/− and Dnmt3a1ΔN neuron nuclei. g, Volcano plot of the distribution of differentially expressed genes (p < 0.01) in Dnmt3a1−/− neuron nuclei. h, Heatmap for wildtype DNMT3A1 binding across Dnmt3a1−/−-neuron nuclei DEGs (up- or down-DEGs) and non-DEGs (other). Density plot was presented in Figure 6c. i, Average DNA methylation levels across Dnmt3a1−/−-neuron nuclei DEGs and other genes in WT and Dnmt3a1−/− neuron nuclei. j, Heatmaps of DMR distribution across up- and down-regulated DEGs in Dnmt3a1−/− neuron nuclei. The gene body was scaled to a 10 kb region. Each red line represents a DMR. k, Fraction of genes covered by DMRs in the gene body and ± 5 kb flanking regions in Dnmt3a1−/− neuron nuclei. l, Average DNA methylation levels across Dnmt3a1−/−-cortex DEGs and other genes in WT and Dnmt3a1−/− cortices. m, Changes of CpG methylation levels (Dnmt3a1 KO – WT) across Dnmt3a1−/− cortical DEGs and other genes.
Extended Data Fig. 9
Extended Data Fig. 9. The N-terminus is required for DNMT3A1 enrichment around bivalent promoters via binding to H2AK119ub.
a, Schematic diagram of DNMT3A constructs that were re-expressed in Dnmt3a−/− mouse ESCs. A 3×FLAG tag and a nuclear localization signal (NLS) were added at the N-terminus of each protein. b, Western blots showing re-expression of DNMT3A variants in established stable ESC lines. The experiment was repeated two times with similar results. c, Density plots of H3K4me3, H3K27me3 and H3K36me3 ChIP-seq signals at each group of TSSs indicated in Figure 7a. d, Heatmaps for DNMT3A1 (WT) and DNMT3A1ΔN binding profiles at regions flanking TSSs in the cerebral cortex. A C-terminus antibody was used in DNMT3A ChIP-seq. The same heatmaps for H3K4me3 and H3K27me3 marks are also shown in Figure 2a. e, Coomassie blue staining of purified GFP-fused DNMT3A1 N-terminal fragments: N121 and N122–219 (left), N219 and N219 mutants (right). f, DNMT3A1 protein structure predicted by AlphaFold (https://alphafold.ebi.ac.uk). The UIM is a part of an α-helix in the flexible N-terminus of DNMT3A1. Met 220 is the first amino acid of DNMT3A2. g, Coomassie blue staining of purified GFP-fused DNMT3A1 N278 and DNMT3B1 N-terminus (aa 1-222). h, Western blot for DNMT3A1 N278 and DNMT3B1 N-terminus after pulldown assays with the indicated nucleosomes. The experiment was repeated three times independently with similar results. i, Heatmap showing genome-wide Spearman correlation between H3K4me3, H3K27me3, H2AK119ub marks and DNMT3A1 (cortex) binding in neuron nuclei. j, IGV displays of H3K4me3, H3K27me3, H2AK119ub and DNMT3A1 enrichment at a region on chromosome 2 in the cerebral cortex and neuron nuclei.
Fig. 1.
Fig. 1.. DNMT3A1, but not DNMT3A2, is essential for mouse postnatal development.
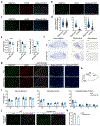
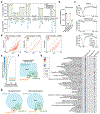
a, Diagram illustrating Dnmt3a isoform-specific knockout strategies by CRISPR-Cas9 genome editing. Scissors indicate Cas9 cutting sites, and arrows show the translation initiation sites of DNMT3A1 and DNMT3A2 proteins. Domain architecture of DNMT3A isoforms is shown above. b, Quantification of DNMT3A isoform expression in Western blot analysis of P18 mouse thymuses. The ratio of DNMT3A1 or DNMT3A2 to GAPDH band intensity in WT was set to 1. n = 3 biological independent samples. Data are shown as mean ± SD. Representative blot images are shown in Extended Data Fig. 1e. c, Body weights of Dnmt3a1−/− (n = 13) and control (n = 13, left), or Dnmt3a2−/− (n = 6) and control (n = 10, right) mice at P10–P20. Data are shown as mean ± SEM with individual values. **** P < 0.0001; ns: not significant, P = 0.6419 (two-sided unpaired t tests). d, Representative image of WT, Dnmt3a1−/− and Dnmt3a2−/− male mice at P21. e, Survival curve of WT control (n = 10), Dnmt3a1−/− (n = 16) or Dnmt3a2−/− (n = 10) mice. **** P < 0.0001 (Log-rank test).
Fig. 2.
Fig. 2.. DNMT3A1 binds to and regulates neurodevelopmental genes in the cerebral cortex.
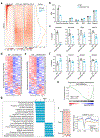
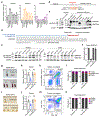
a, Heatmaps for H3K4me3, H3K27me3 and DNMT3A (DNMT3A1) enrichment at transcription start sites (TSSs) in cortical cells isolated from P18 Dnmt3a-FLAG knock-in mice. TSSs were clustered into three groups based on the abundance of H3K4me3 and H3K27me3 marks. b, Average density of DNMT3A1 signal at TSS groups (a) in P18 cortical cells. Input was subtracted from the signal of DNMT3A1 ChIP-seq. c–e, Integrated Genomics Viewer (IGV) displays of DNMT3A1, H3K4me3 and H3K27me3 enrichment at Dpysl5 (c), Pitx3 (d) and Notch1 (e) genomic loci in Dnmt3a-FLAG mouse cortex. f. Differential gene expression analysis by M-A plot. The log2FC for each gene was plotted against the average abundance in log2CPM. Significantly up- or down-regulated DEGs (FDR < 0.01) were highlighted in red. g, Transcriptome analysis of Dnmt3a1−/− cortical cells by GSEA (Gene ontology: biological processes). Top dysregulated gene sets in Dnmt3a1−/− cortical cells were listed and ranked by normalized enrichment score (NES). h–i, Enrichment plots for gene sets Synapse assembly (h) and Neuromuscular process (i). j, A schematic for LTP experiment. PP: Perforant pathway; DG: Dentate gyrus; Stim: stimulation; Rec: recording. k, LTP traces from Dnmt3a1−/− (n = 8 from 3 mice) and WT hippocampal slices (n = 6 from 3 mice). Values at each time point are presented as mean ± SEM. TBS: theta-burst stimulation. l, Quantification of the average LTP responses (k) in the last 5 min of recording. Data are shown as mean ± SEM with individual values. * P = 0.0106 (two-sided unpaired t test). m, Higher frequency of DEGs (FDR < 0.01) in bivalent gene group in Dnmt3a1−/− cortices.
Fig. 3.
Fig. 3.. DNMT3A1 restoration in the nervous system by Nestin-Cre partially rescued Dnmt3a1 KO lethality.
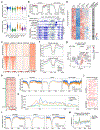
a, Strategy for Dnmt3a1 KO by reversing exon 4 (r4) and conditional restoration in the nervous system by Nestin-Cre-mediated recombination between Lox71 and Lox66 sites. b, Western blot showing the loss and restoration of DNMT3A1 protein in the cerebral cortex and hippocampus of P21 Dnmt3a1r4/r4 and Dnmt3a1r4/r4, Nestin-Cre mice respectively. DNMT3A1 was not detected in the thymus of Dnmt3a1r4/r4, Nestin-Cre mouse. The experiment was repeated three times with independent biological samples. c, Body weights of Dnmt3a1r4/r4 (n = 9), Dnmt3a1r4/r4, Nestin-Cre (n = 8) and WT control (n = 11) mice at P21. Data are shown as mean ± SEM with individual values. ** P = 0.0013; **** P < 0.0001 (two-sided unpaired t tests). d, Survival curve of Dnmt3a1r4/r4, Dnmt3a1r4/r4, Nestin-Cre and other control mice. Numbers of mice of each genotype are indicated. The Log-rank test was used to compare the survival distributions of Dnmt3a1r4/r4 and Dnmt3a1r4/r4, Nestin-Cre mice: **** P < 0.0001.
Fig. 4.
Fig. 4.. Deletion of DNMT3A1 N-terminus leads to impaired postnatal development.
a, A schematic diagram showing Dnmt3a1 N-terminus knockout strategy. In-frame deletion of exons 3-6 (encode aa 22–209) generates a truncated protein DNMT3A1ΔN. b, DNMT3A1ΔN was expressed in mutant cortices at the same level as DNMT3A1 in WT at P18. Two replicates for WT or DNMT3A1ΔN are biological replicates. c, Survival curve of Dnmt3a1ΔN mice (n = 30) and WT littermates (n = 28). **** P < 0.0001 (Log-rank test). d, Body weights of Dnmt3a1ΔN males (n = 6) and WT male littermates (n = 4) at the age of 2, 4 and 6 months. Data are shown as mean with SD. *** P = 0.000106; **** P < 0.0001 (multiple t tests). e, Representative image of Dnmt3a1ΔN and WT males at 6 months. fg, Distance traveled, average movement speed and central activity of Dnmt3a1ΔN (n = 19) and WT (n = 16) mice in an Open field activity test. Data are shown as mean ± SEM with individual values. ** P = 0.0078; **** P < 0.0001 (two-sided unpaired t tests).
Fig. 5.
Fig. 5.. The N-terminus is required for DNMT3A1-regulated DNA methylation in the cerebral cortex.
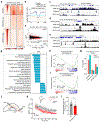
a, Violin plots with included boxplots for the distribution of average CpG methylation levels of 5-kb bins over the genome in WT, Dnmt3a1−/−, Dnmt3a2−/− and Dnmt3a1ΔN cerebral cortices (n = 2 biological replicates each genotype). The lower and upper hinges of boxplots correspond to the first and third quartiles. The lower or upper whisker extends from the hinge to the smallest or largest value within 1.5 × inter-quartile range (IQR) of the hinge respectively. bc, CpG methylation levels at CpG islands (b), Canyons (c) and ± 5-kb flanking regions. d, IGV displays of DNMT3A1, H3K4me3 and H3K27me3 enrichment in Dnmt3a-FLAG mouse cortex, and CpG/CpH methylation in WT and KO cortices at Nr4a2 locus. The differentially methylated region is highlighted in light green. The canyon region in WT is shown below. e, Violin plots for the distribution of average CpH methylation levels of 50-kb bins over the genome in the cerebral cortex (n = 2 biological replicates each genotype). The boxplots parameters are the same to those in (a). f, Positive correlation between wildtype DNMT3A1 binding and hypomethylation in Dnmt3a1−/− and Dnmt3a1ΔN cortical cells. Genes were ranked by average DNMT3A signal intensity at TSS regions (left), and the top 20%, middle 20% and bottom 20% were analyzed for DNA methylation (right). g, Numbers of hyper- (red) and hypomethylated (blue) DMRs (FDR < 0.05) identified in KOs. DMRs were identified as regions with at least 10 CpGs and mean difference of methylation level > 0.1. h, Heatmap representations of DMR distribution across genes. Genes were ranked by the average DNMT3A signal intensity within the gene. Each red line represents a DMR, and raster images are shown. i, Heatmaps showing relative DNA methylation levels at Dnmt3a1−/− DMRs in WT, Dnmt3a1−/−, Dnmt3a2−/− and Dnmt3a1ΔN cortical cells. Overlapping DMRs in Dnmt3a2−/− or Dnmt3a1ΔN genome are displayed on the right.
Fig. 6.
Fig. 6.. Integrative analyses of DNA methylation and gene expression changes in Dnmt3a1−/− neuron nuclei.
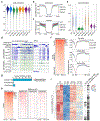
a, Heatmaps for H3K4me3, H3K27me3 and H2AK119ub ChIP-seq on sorted neuron nuclei, and DNMT3A1 (DNMT3A-FLAG) binding in the cerebral cortex, at TSS ± 5 kb. TSSs were clustered into three groups based on the abundance of H3K4me3 and H3K27me3 marks. H2AK119ub and DNMT3A1 were plotted accordingly. b, Average DNA methylation levels across bivalent genes and two other groups of genes (defined in a) in WT, Dnmt3a1−/−, Dnmt3a2−/− and Dnmt3a1ΔN neuron nuclei. c, Density of wildtype DNMT3A1 occupancy across DEGs (up- or down-DEGs) and non-DEGs (other) of Dnmt3a1−/− neuron nuclei. Input was subtracted from the signal of DNMT3A1 ChIP-seq. d, Changes in CpG methylation levels (Dnmt3a1 KO – WT) across Dnmt3a1−/−-neuron nuclei DEGs and other genes. Genes were normalized and divided into 500 bins. Each dot represents the change of average CpG methylation level in one bin and each line represents the loess regression smooth curve. ef, Running average plots of the log2 fold-changes of expressed genes versus the percentage changes of CpG (e) or CpH methylation (f) in gene bodies and TSS ± 2-kb regions within Dnmt3a1−/− neuron nuclei. Pearson correlation tests were conducted.
Fig. 7.
Fig. 7.. The N-terminus facilitates DNMT3A1 enrichment around bivalent promoters by binding to H2AK119ub.
a, ChIP-seq heatmaps displaying H3K4me3, H3K27me3 and H3K36me3 enrichment at TSSs in WT mouse ESCs. All TSSs were clustered into three groups based on H3K4me3 and H3K27me3 occupancies, and H3K36me3 was plotted accordingly. b, Heatmaps for normalized chromatin binding profiles of DNMT3A2, DNMT3A1 and truncated proteins at TSSs, which were listed in the same order as in (a). Input was subtracted from the signal of ChIP-seq. c, Density plots for average ChIP-seq signal intensity of DNMT3A isoforms and truncated proteins at each group of TSSs. d, A potential UIM located in the disordered N-terminus of DNMT3A1. The cyan bars designate the fragments investigated. ef, Western blots for GFP-fused N-terminal fragments N219 and N278 (e), N121and N122–219 (f) after in vitro pulldown assays with H3K27me3-, H2AK119ub- or unmodified nucleosomes. The experiments were repeated three times independently with similar results. g, Mutated amino acids in the UIM (top) and Western blot for N219 and its mutants after pulldown assays with the indicated nucleosomes. The experiment was repeated two times independently with similar results. h, Enrichment heatmaps depicting the enrichment of H2AK119ub, DNMT3A1 and DNMT3A1 mutant (Mut2) at TSSs, which were clustered and listed as in (a), in established ESC lines. i, Heatmaps showing the N-terminus is involved in DNMT3A1 enrichment at H2AK119ub peaks. The H2AK119ub-labeled genomic regions were ranked by the average intensity of this modification in the region, and others were plotted accordingly.

Comment in

Similar articles

Cited by

References

    1. Smith ZD & Meissner A DNA methylation: Roles in mammalian development. Nat. Rev. Genet 14, 204–220 (2013). - PubMed
    1. Li E & Zhang Y DNA methylation in mammals. Cold Spring Harb. Perspect. Biol 6, (2014). - PMC - PubMed
    1. Greenberg MVC & Bourc’his D The diverse roles of DNA methylation in mammalian development and disease. Nat. Rev. Mol. Cell Biol 20, 590–607 (2019). - PubMed
    1. Okano M, Bell DW, Haber DA & Li E DNA methyltransferases Dnmt3a and Dnmt3b are essential for de novo methylation and mammalian development. Cell 99, 247–257 (1999). - PubMed
    1. Nguyen S, Meletis K, Fu D, Jhaveri S & Jaenisch R Ablation of de novo DNA methyltransferase Dnmt3a in the nervous system leads to neuromuscular defects and shortened lifespan. Dev. Dyn 236, 1663–1676 (2007). - PubMed

Publication types