. 2022 May;54(5):649-659.
doi: 10.1038/s41588-022-01061-8. Epub 2022 May 9.

Meningioma DNA methylation groups identify biological drivers and therapeutic vulnerabilities

Affiliations

Meningioma DNA methylation groups identify biological drivers and therapeutic vulnerabilities

Abrar Choudhury et al. Nat Genet. 2022 May.

Abstract

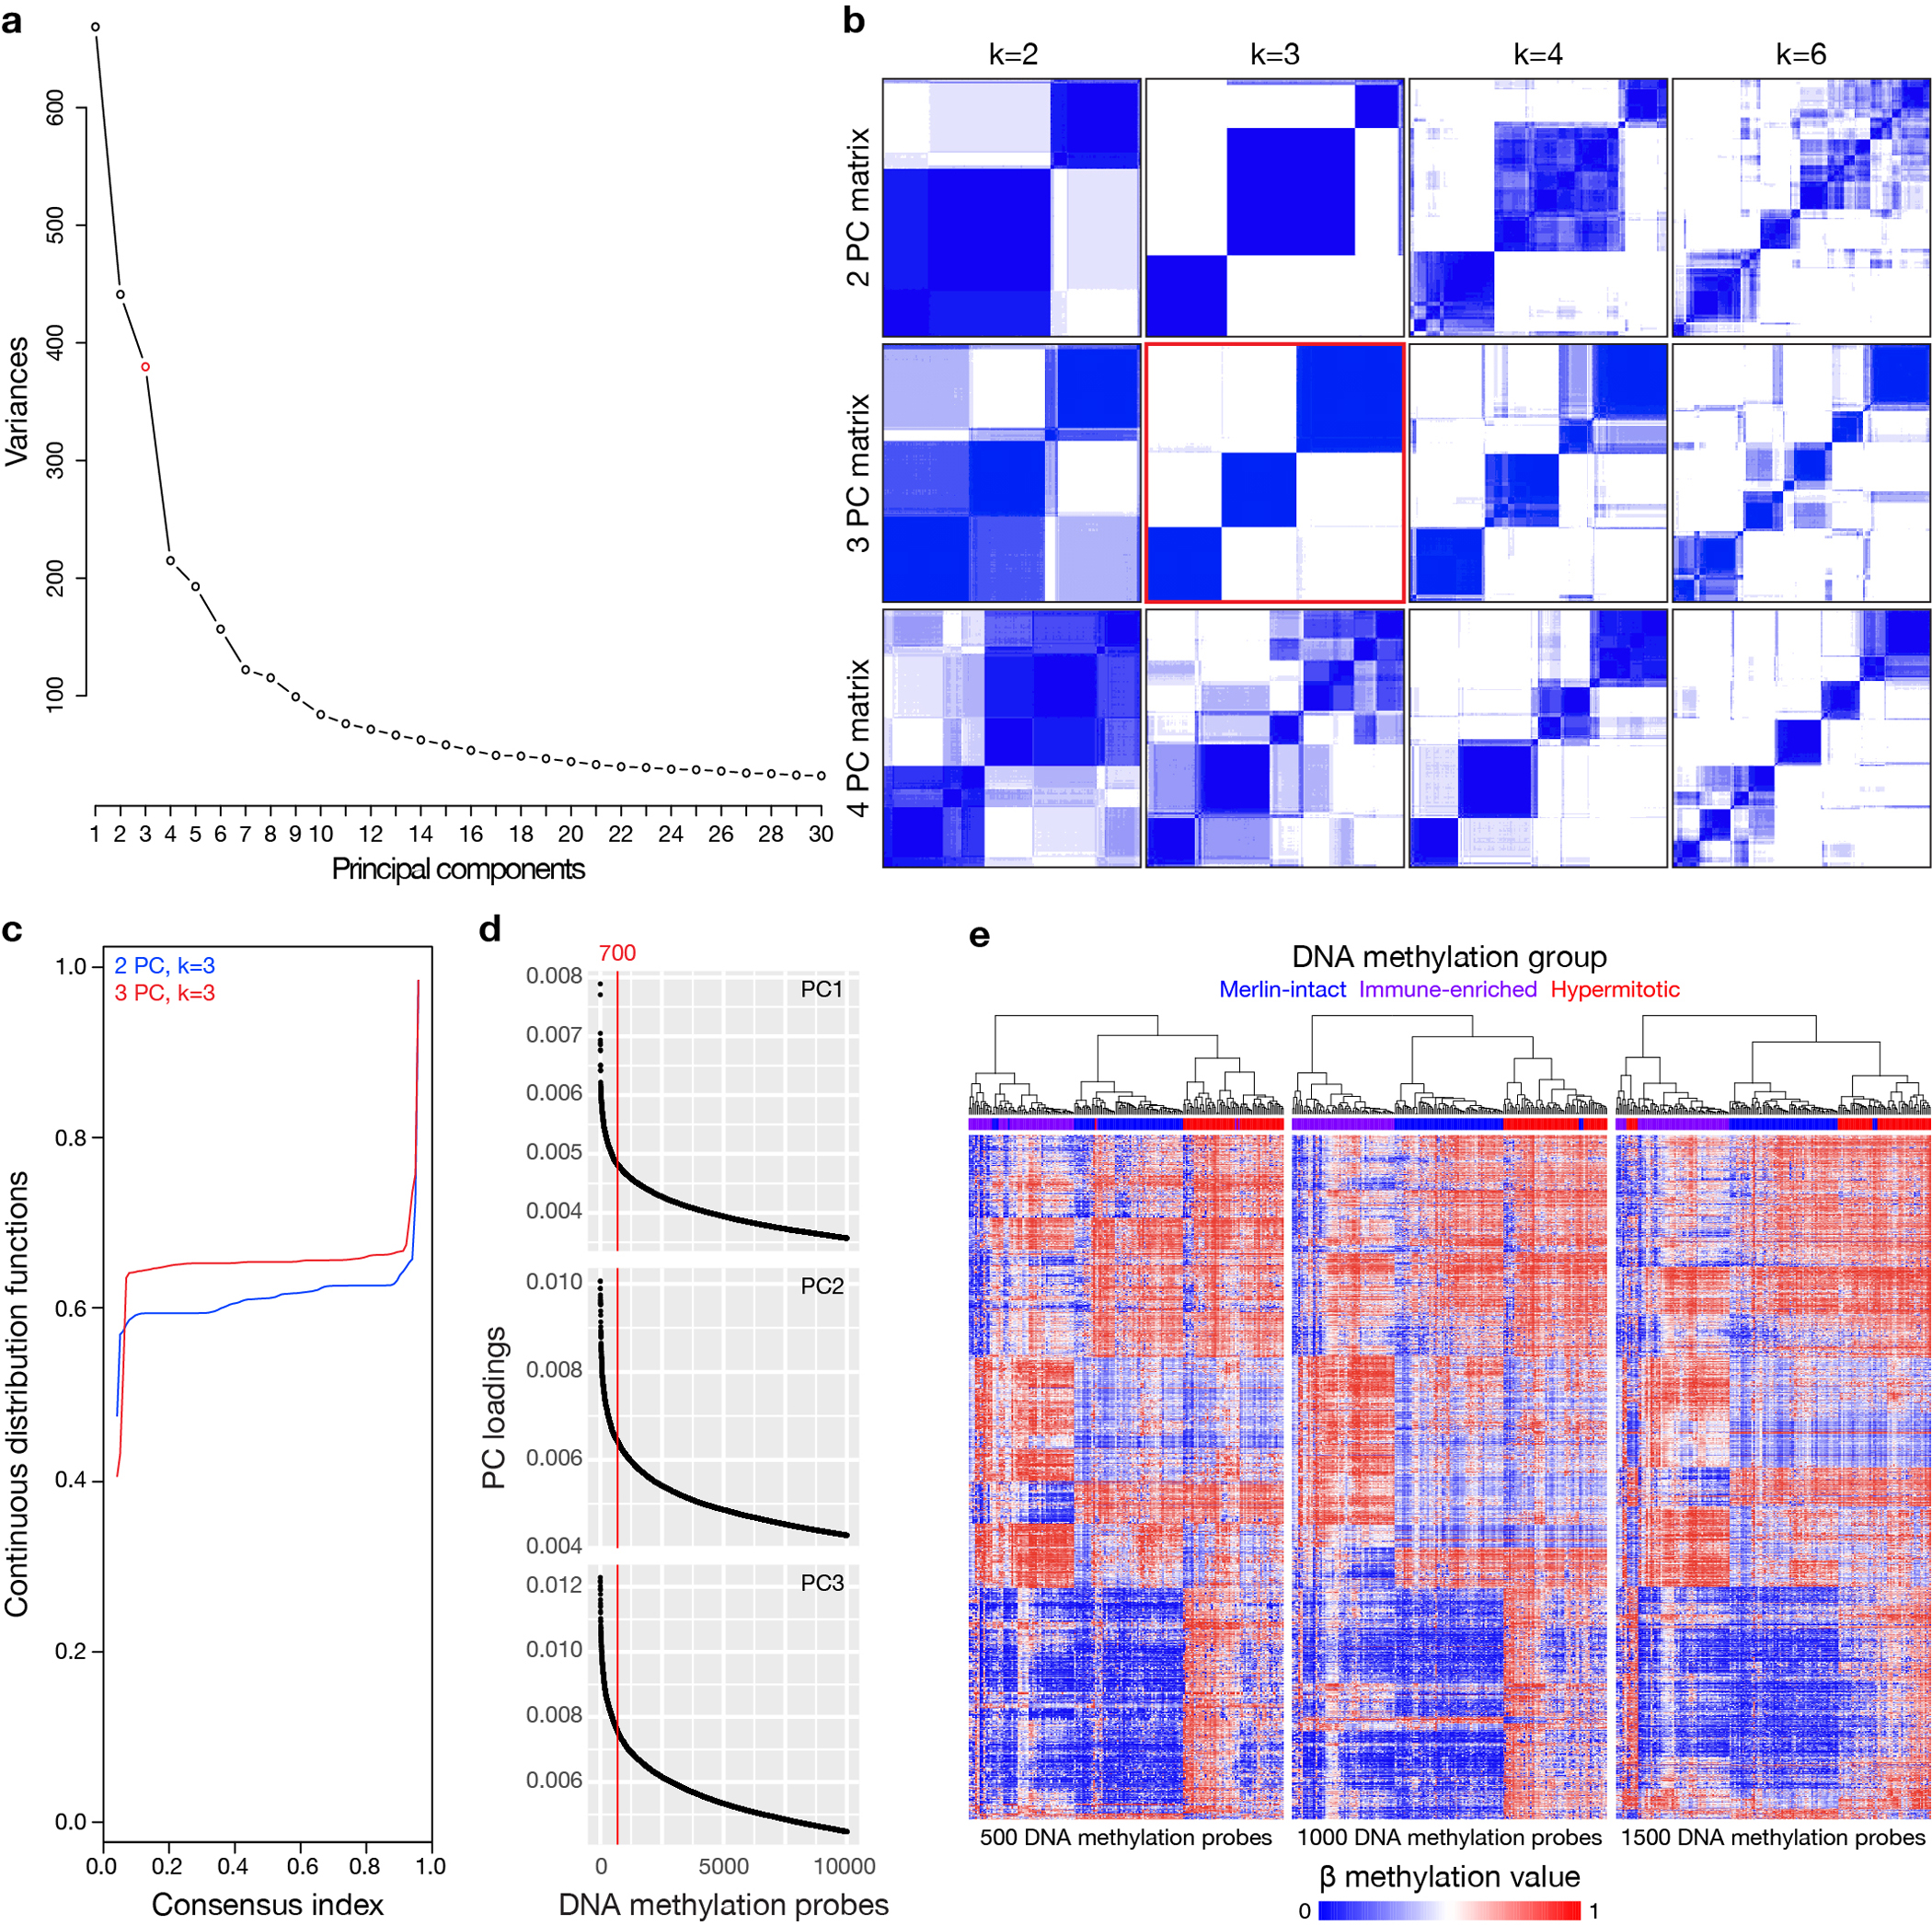
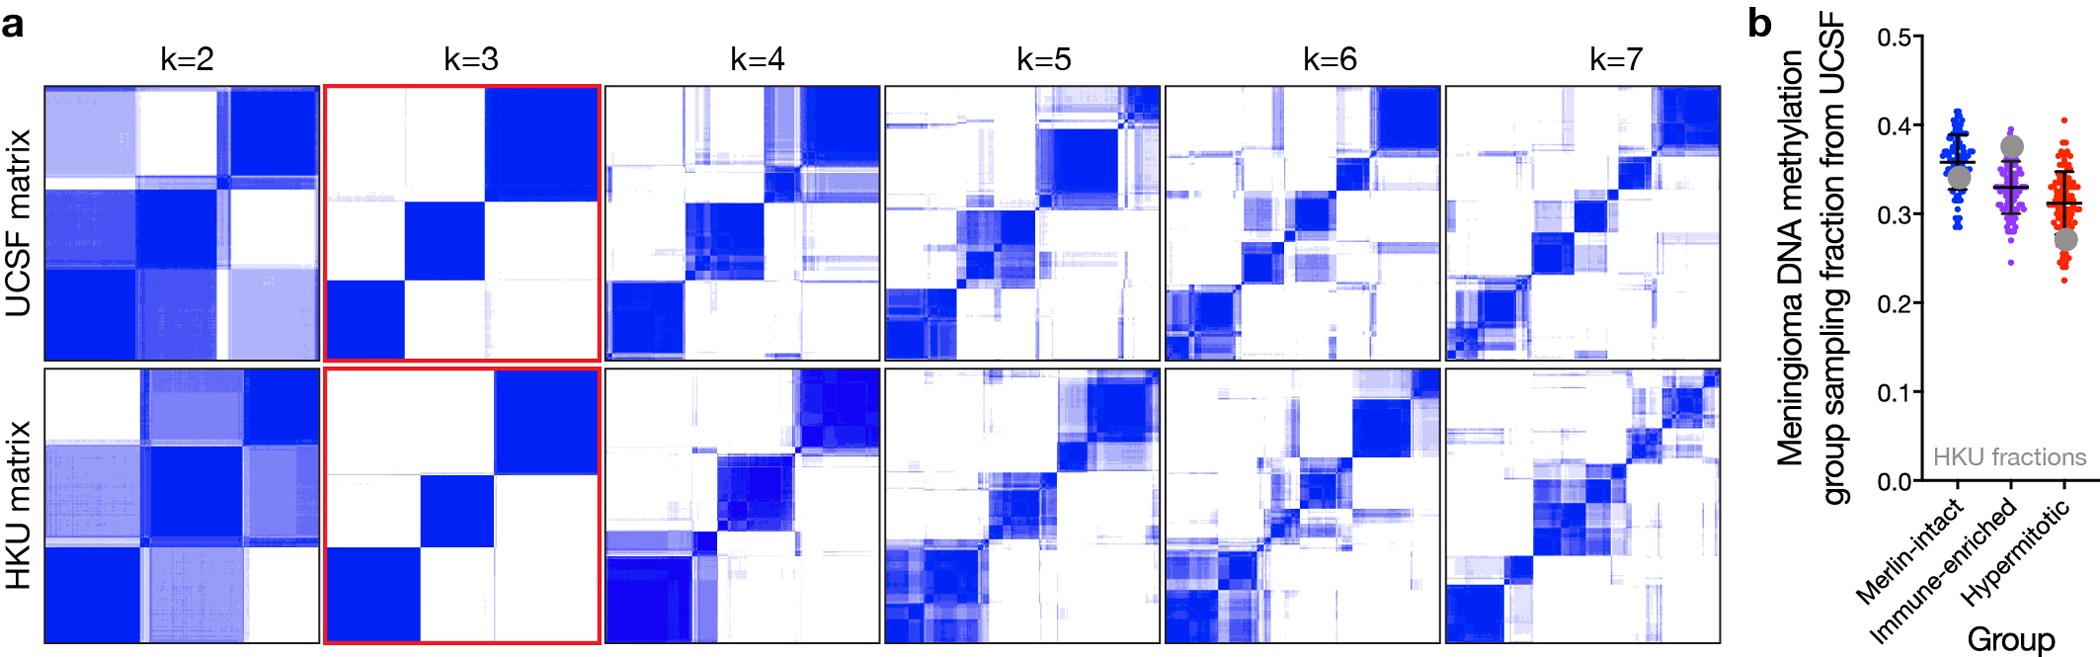
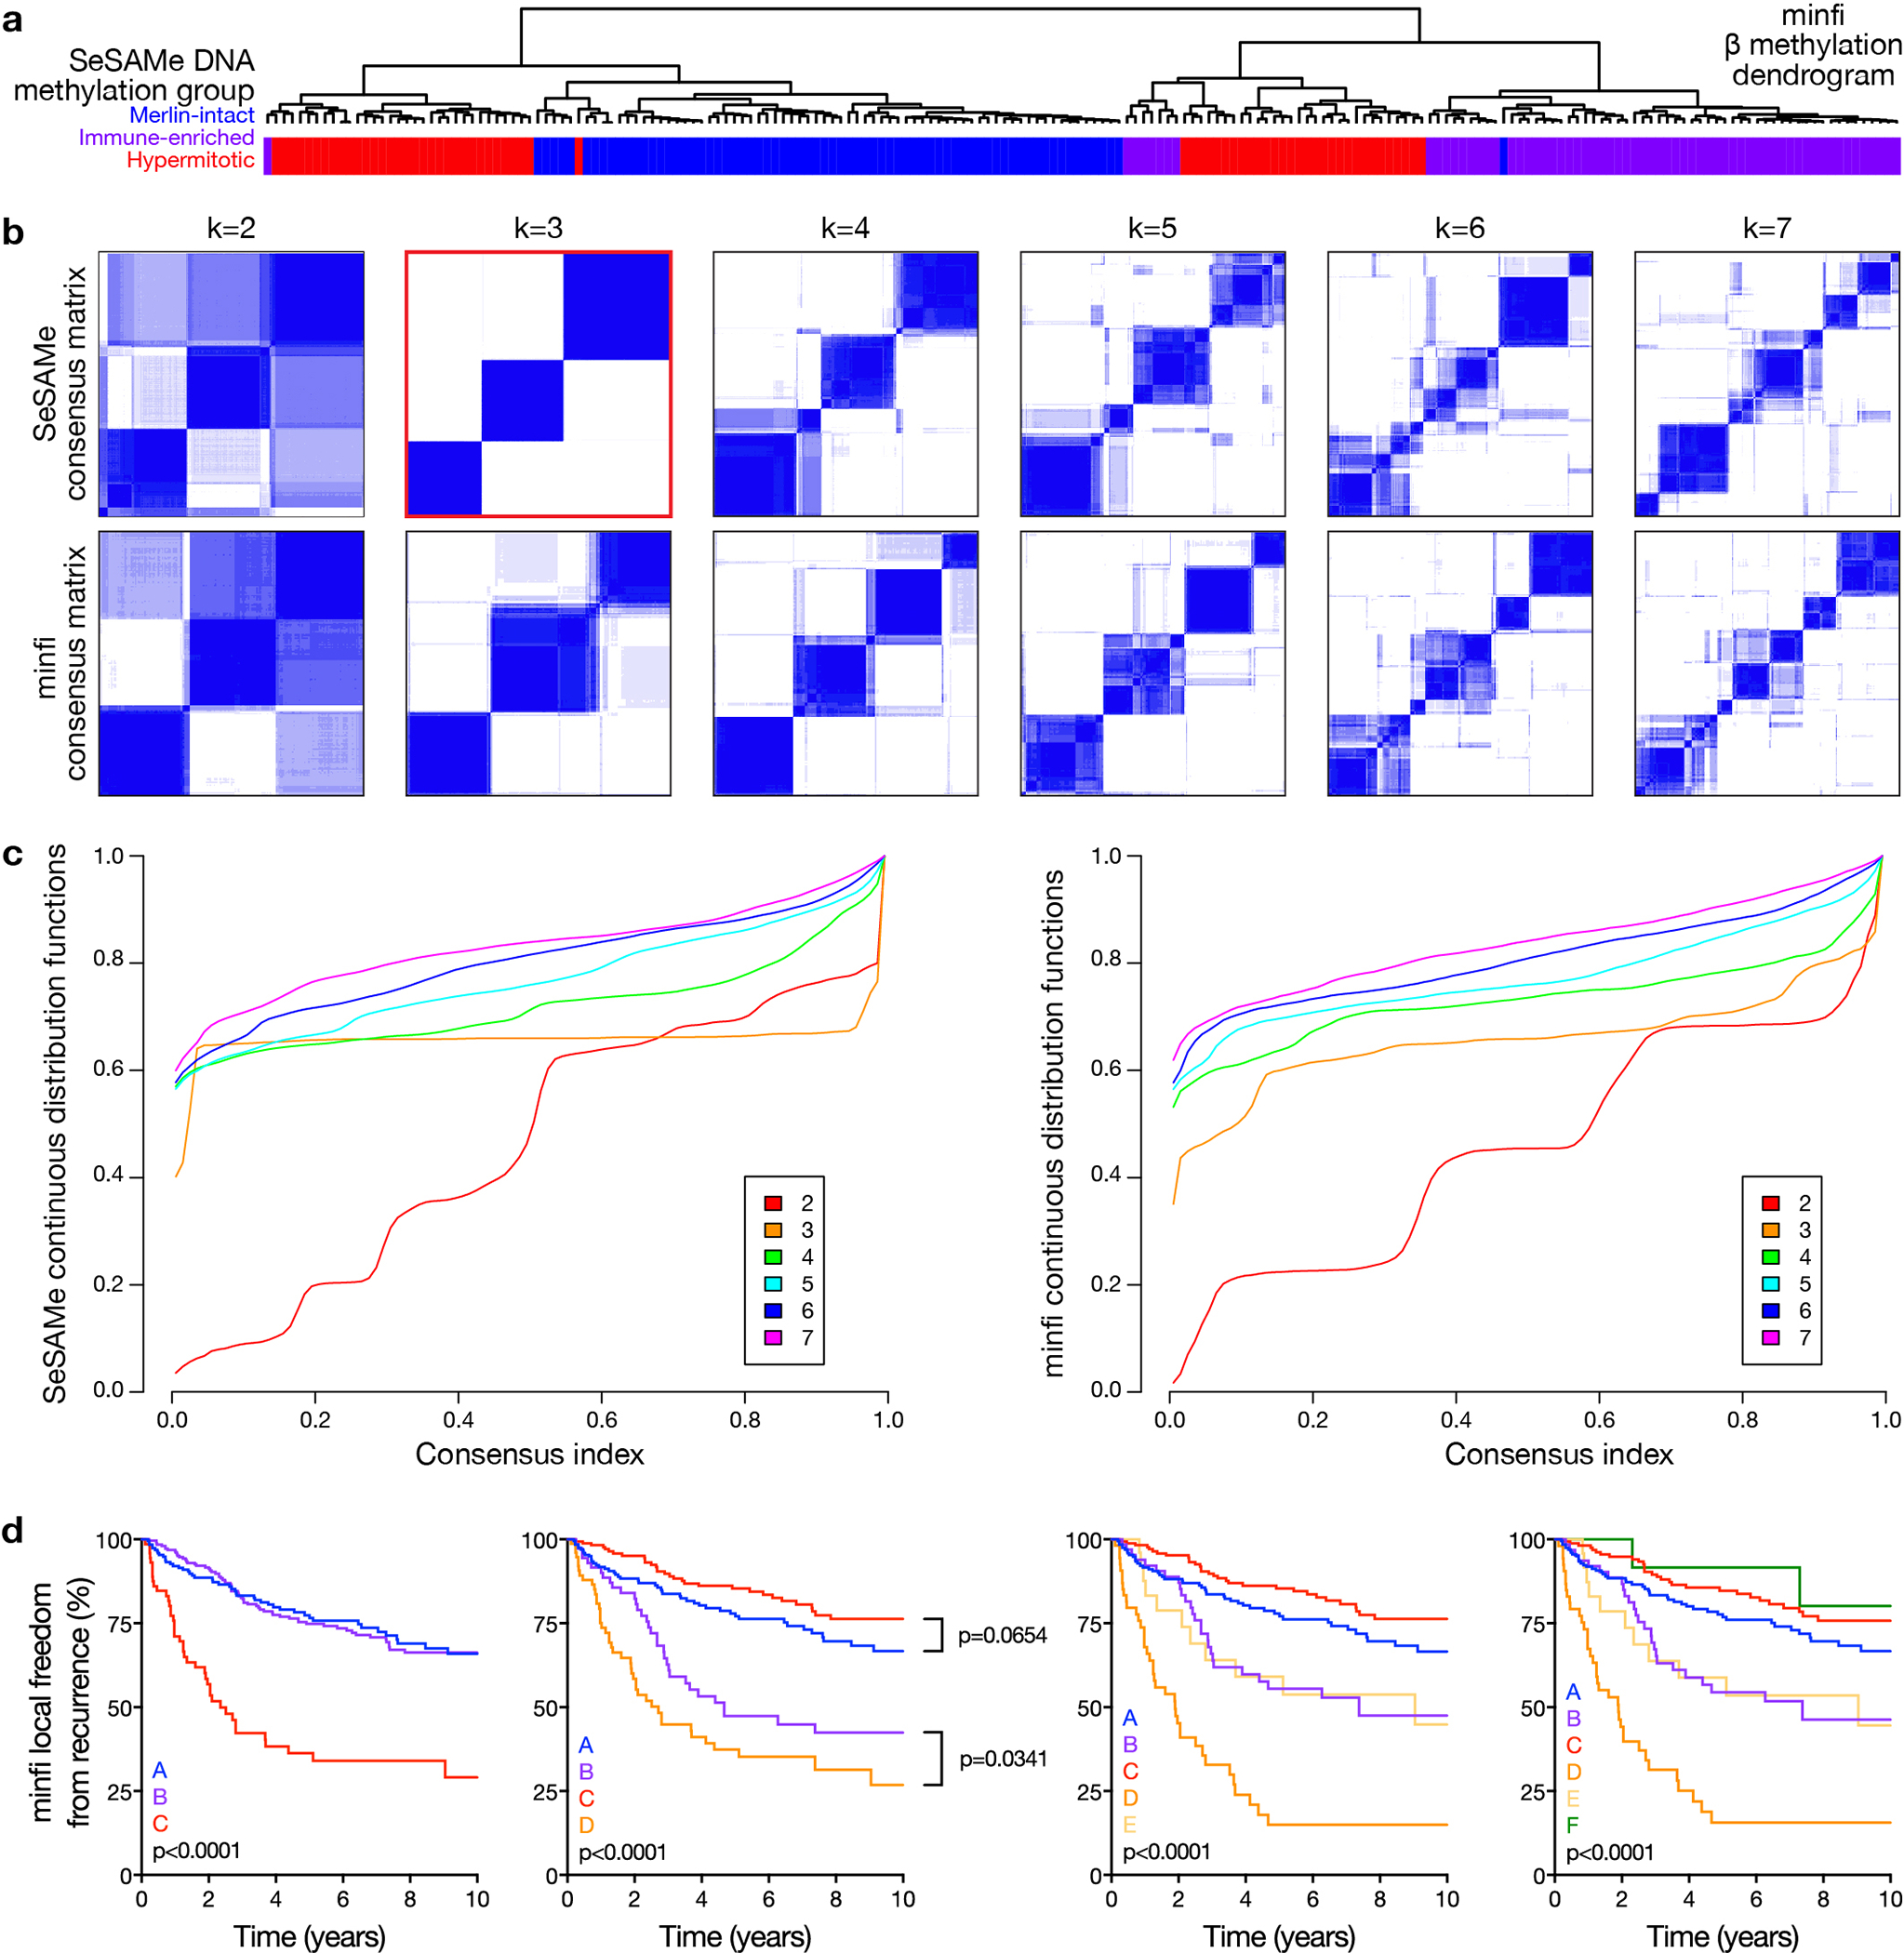
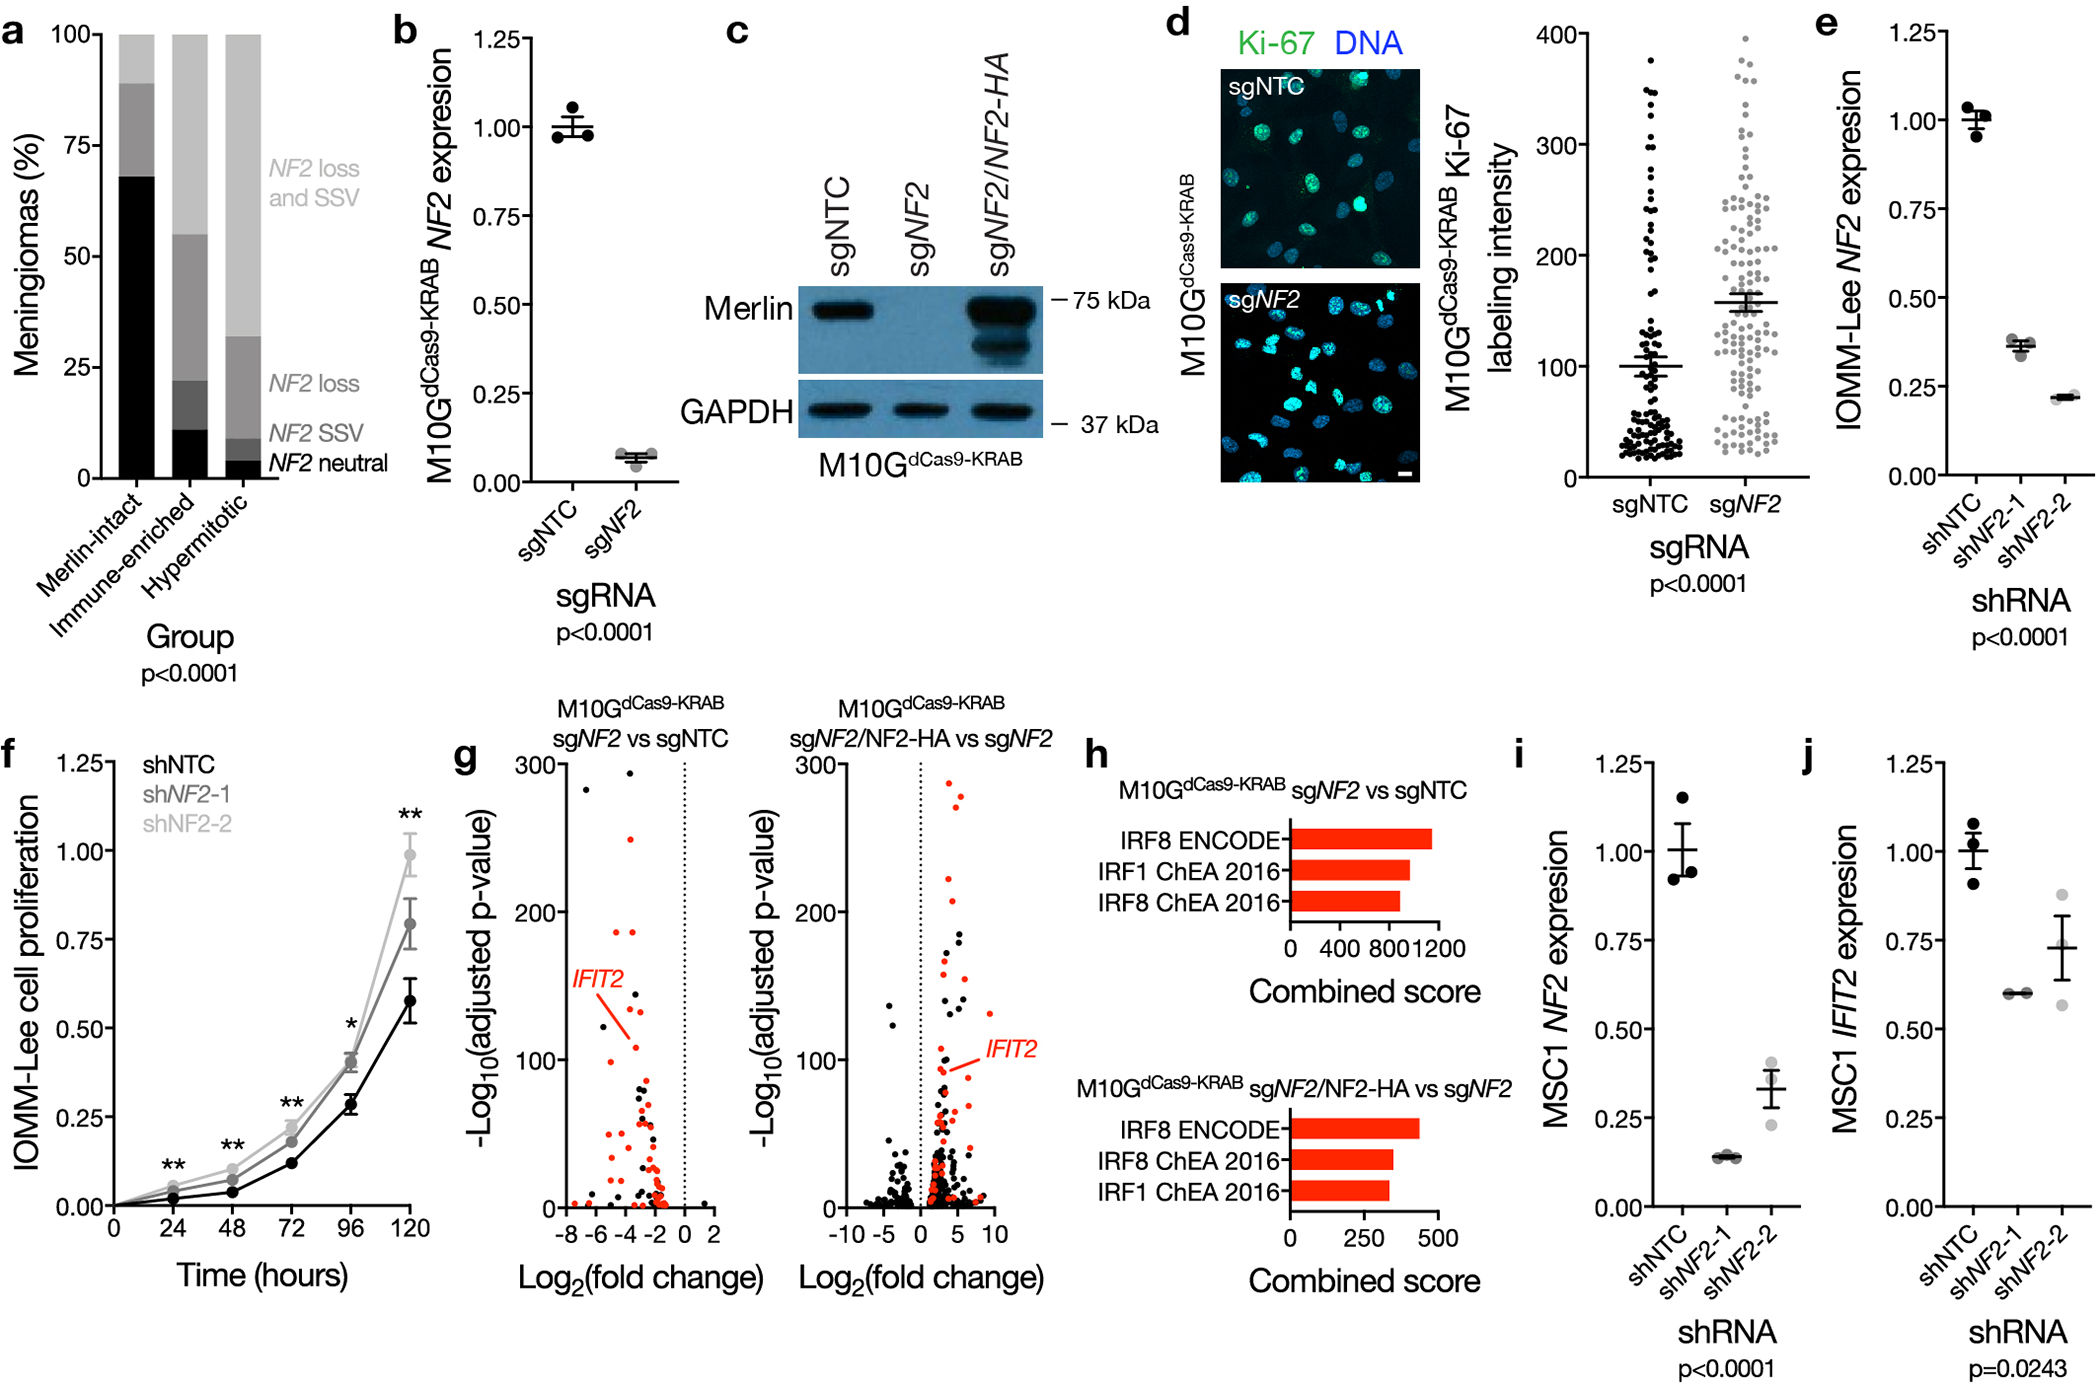
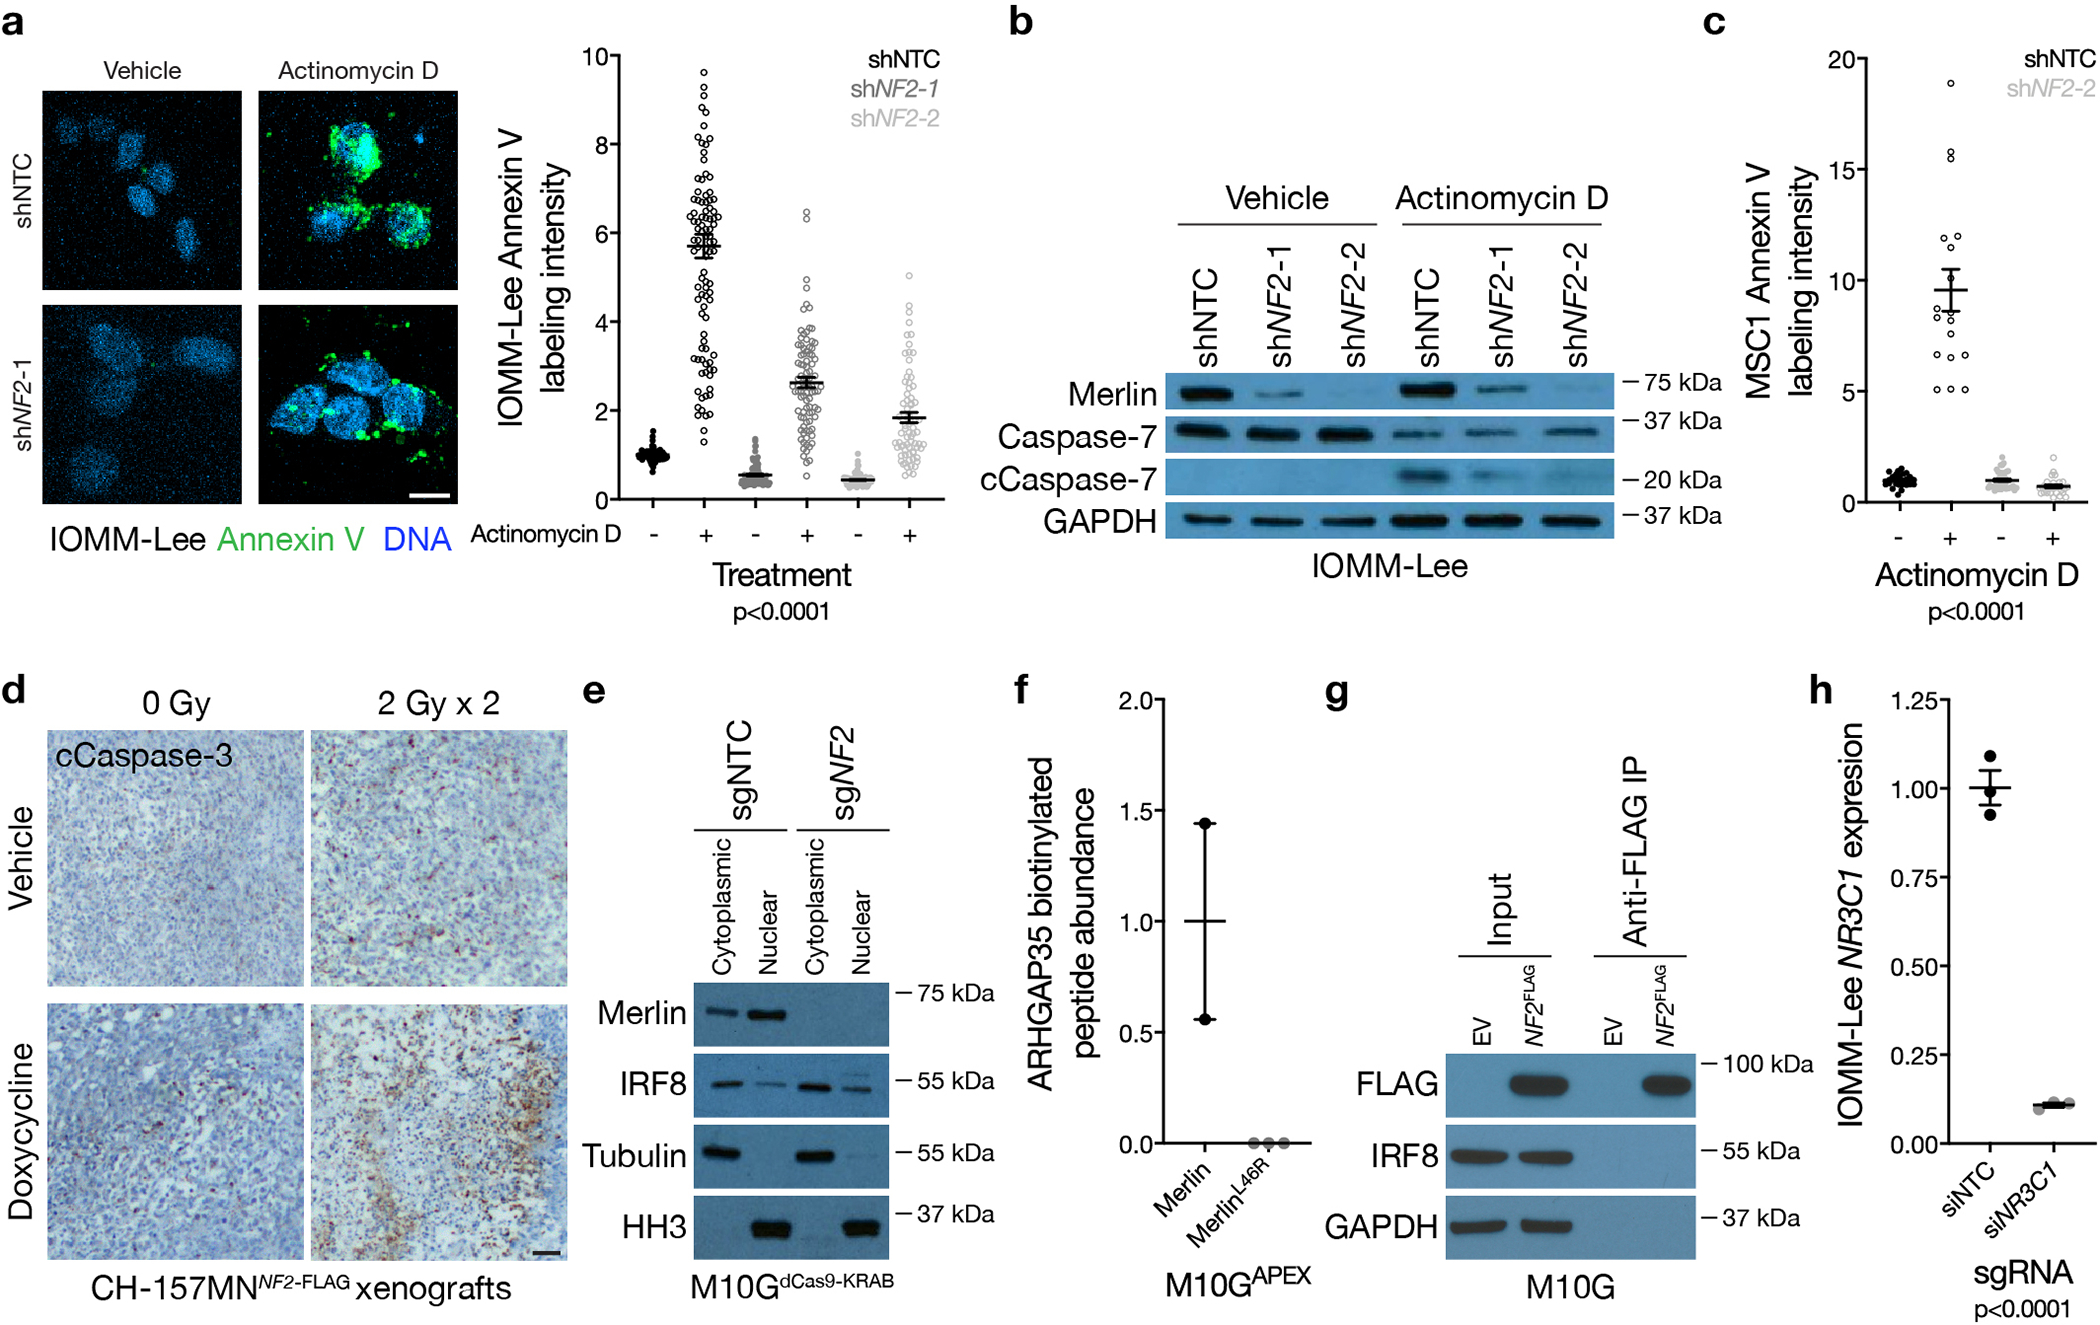
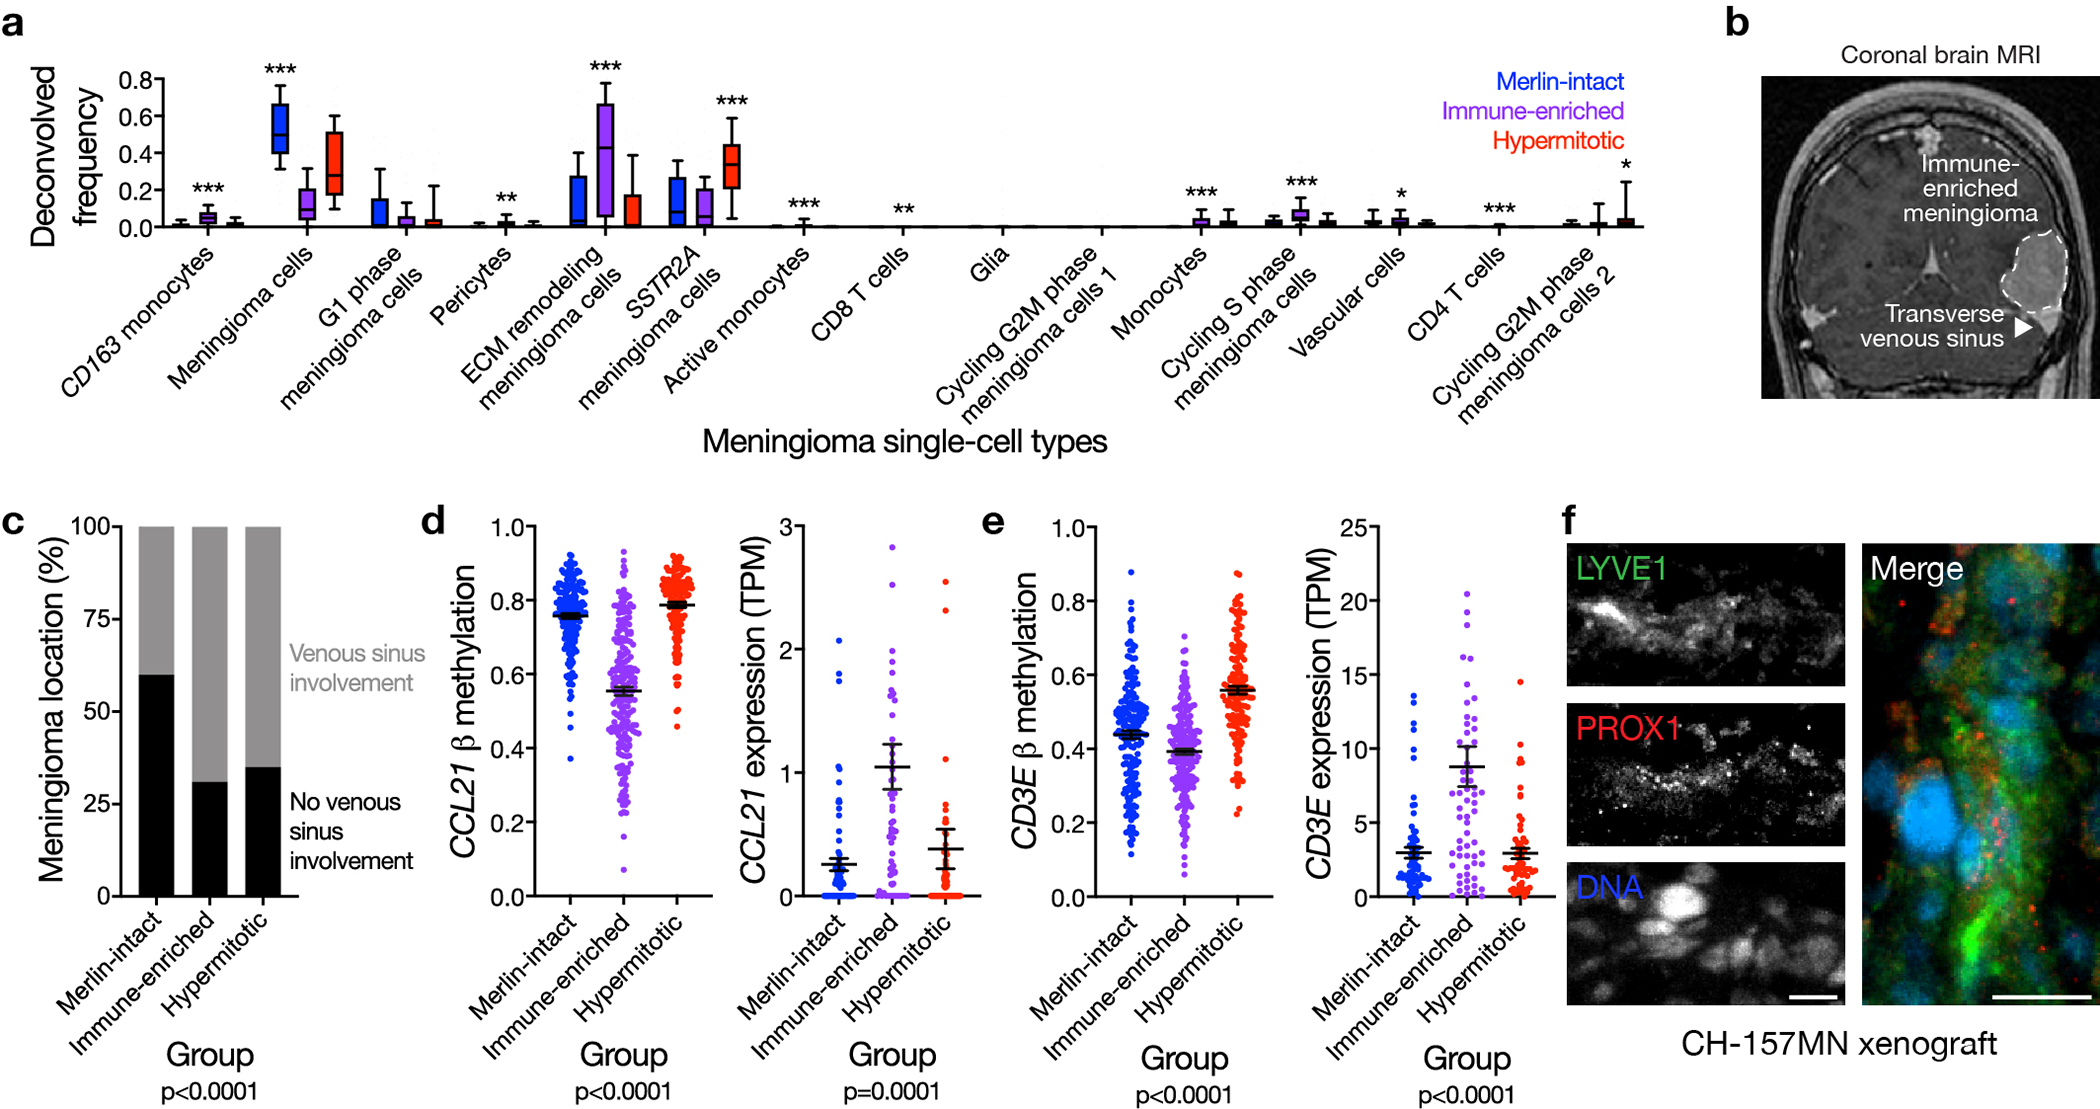
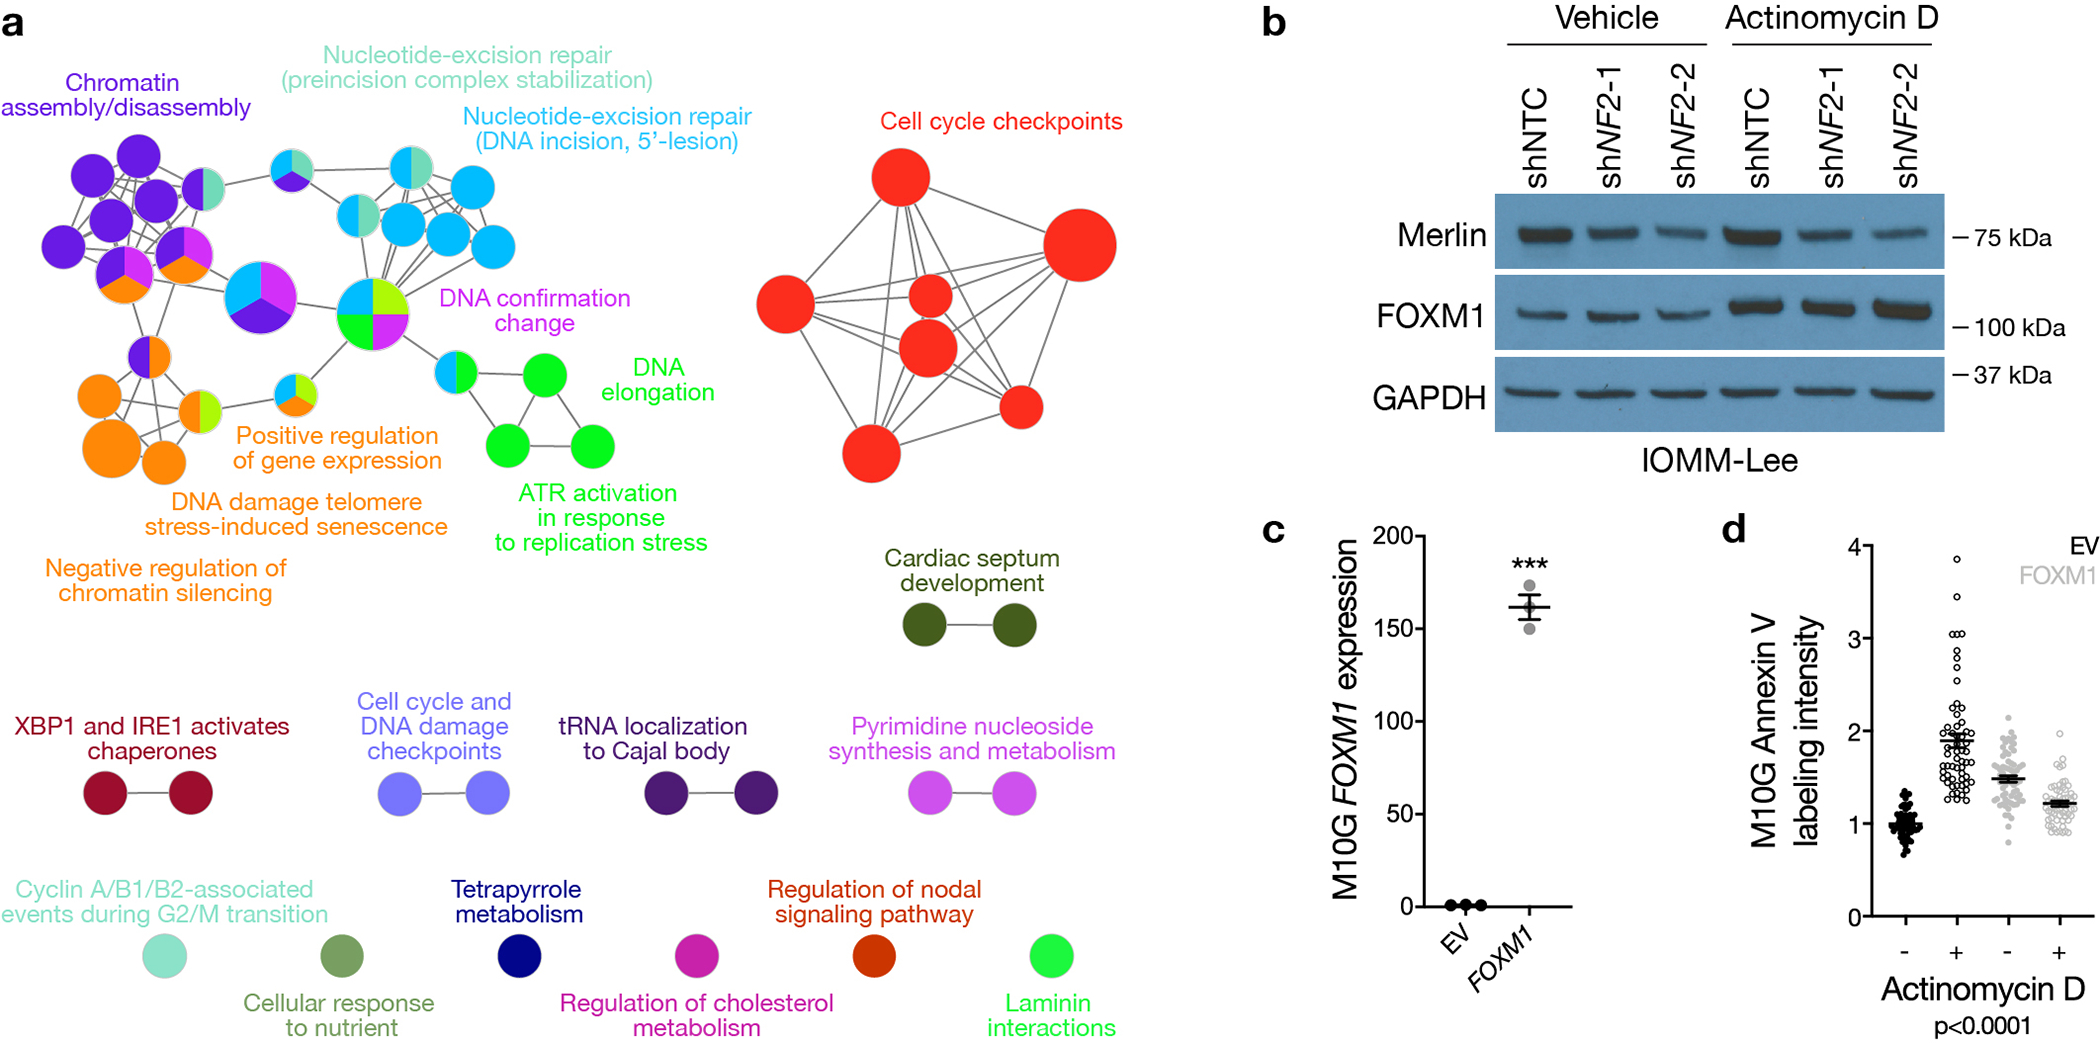
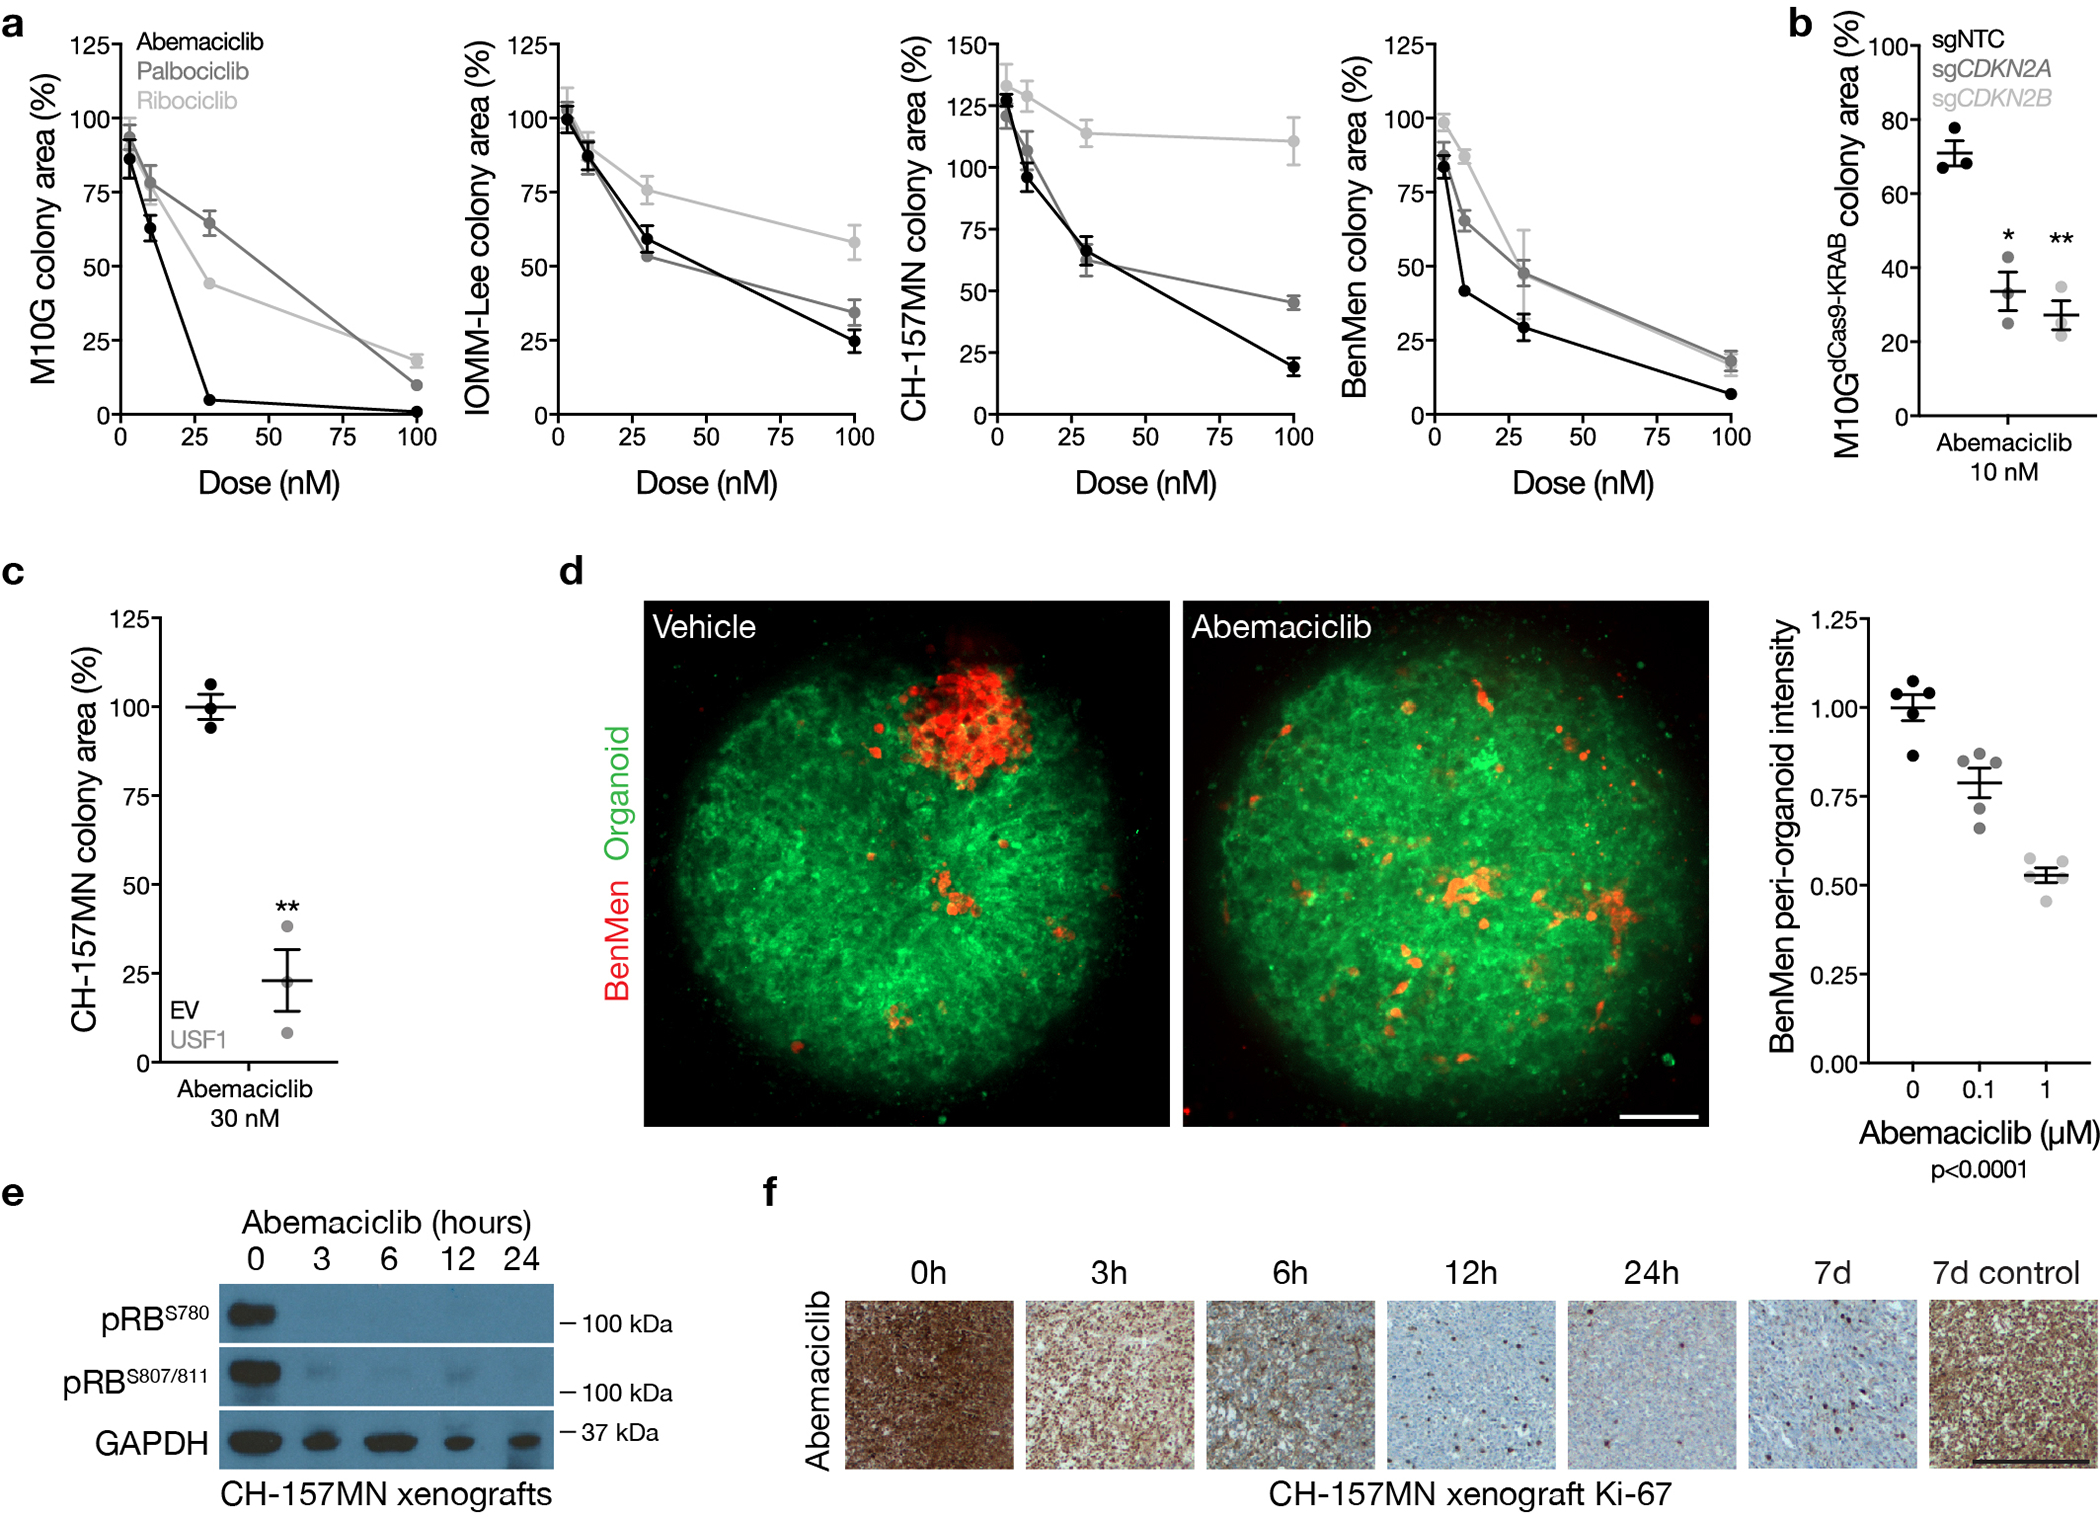
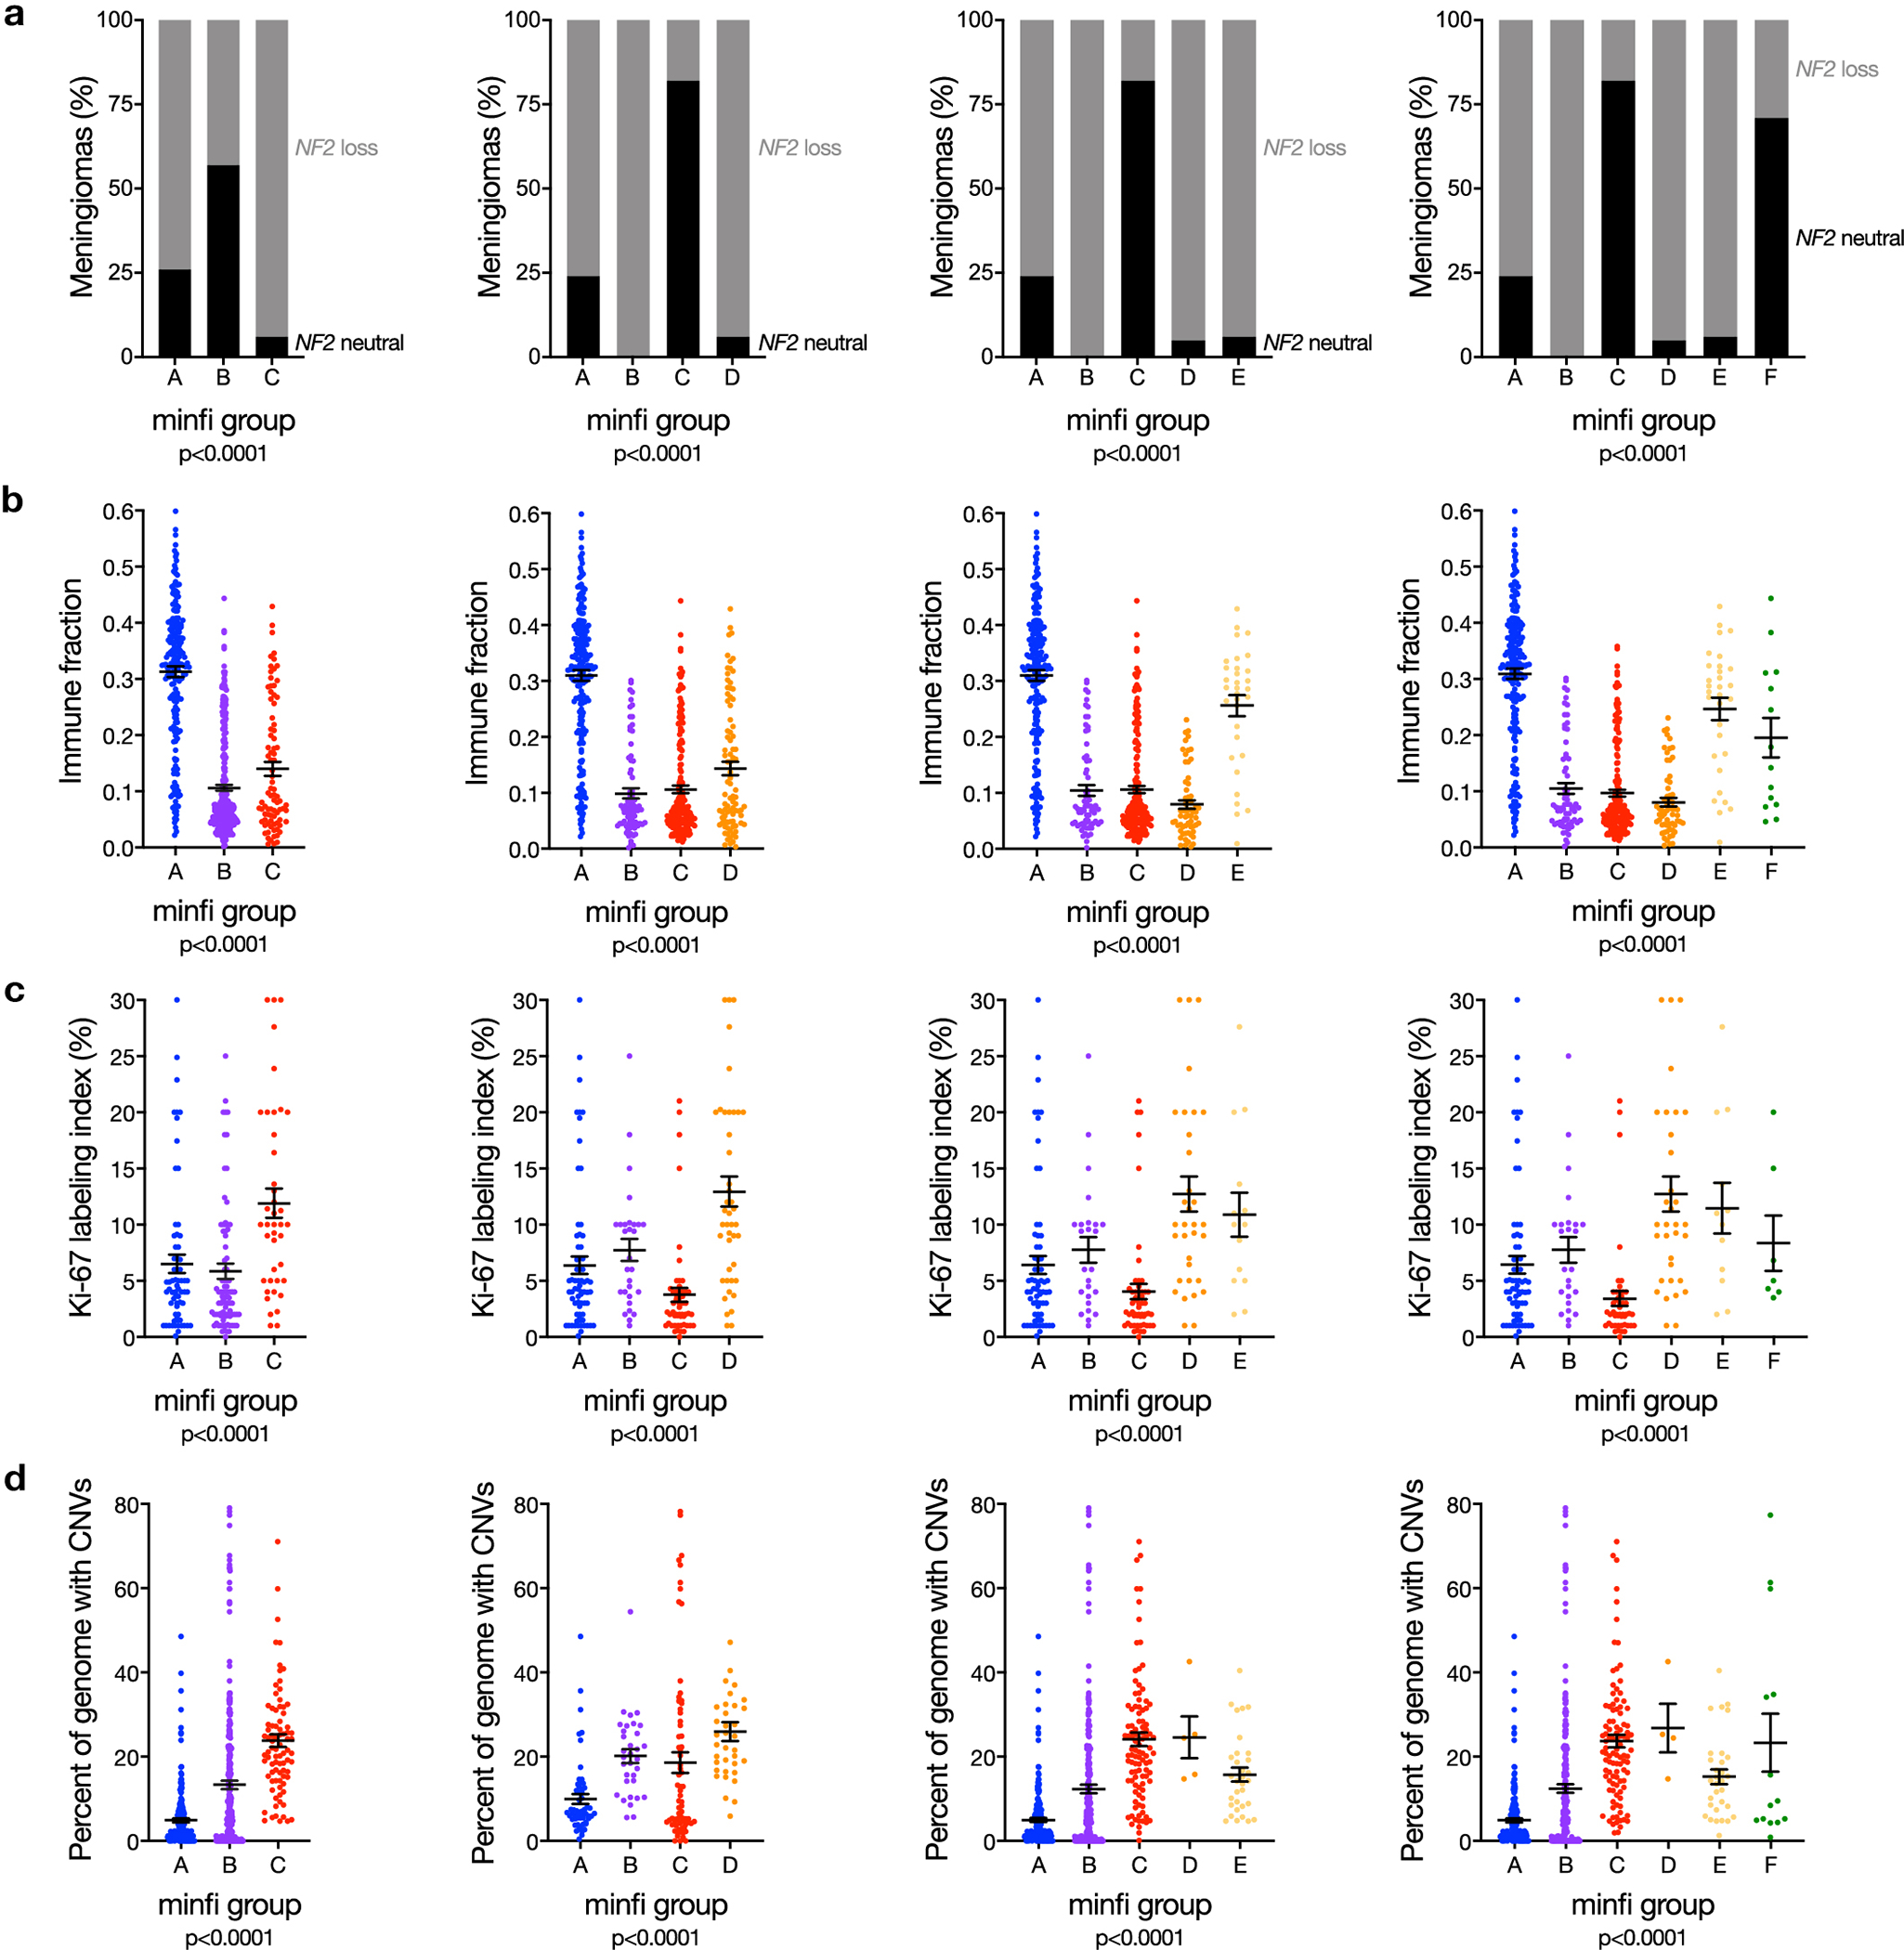
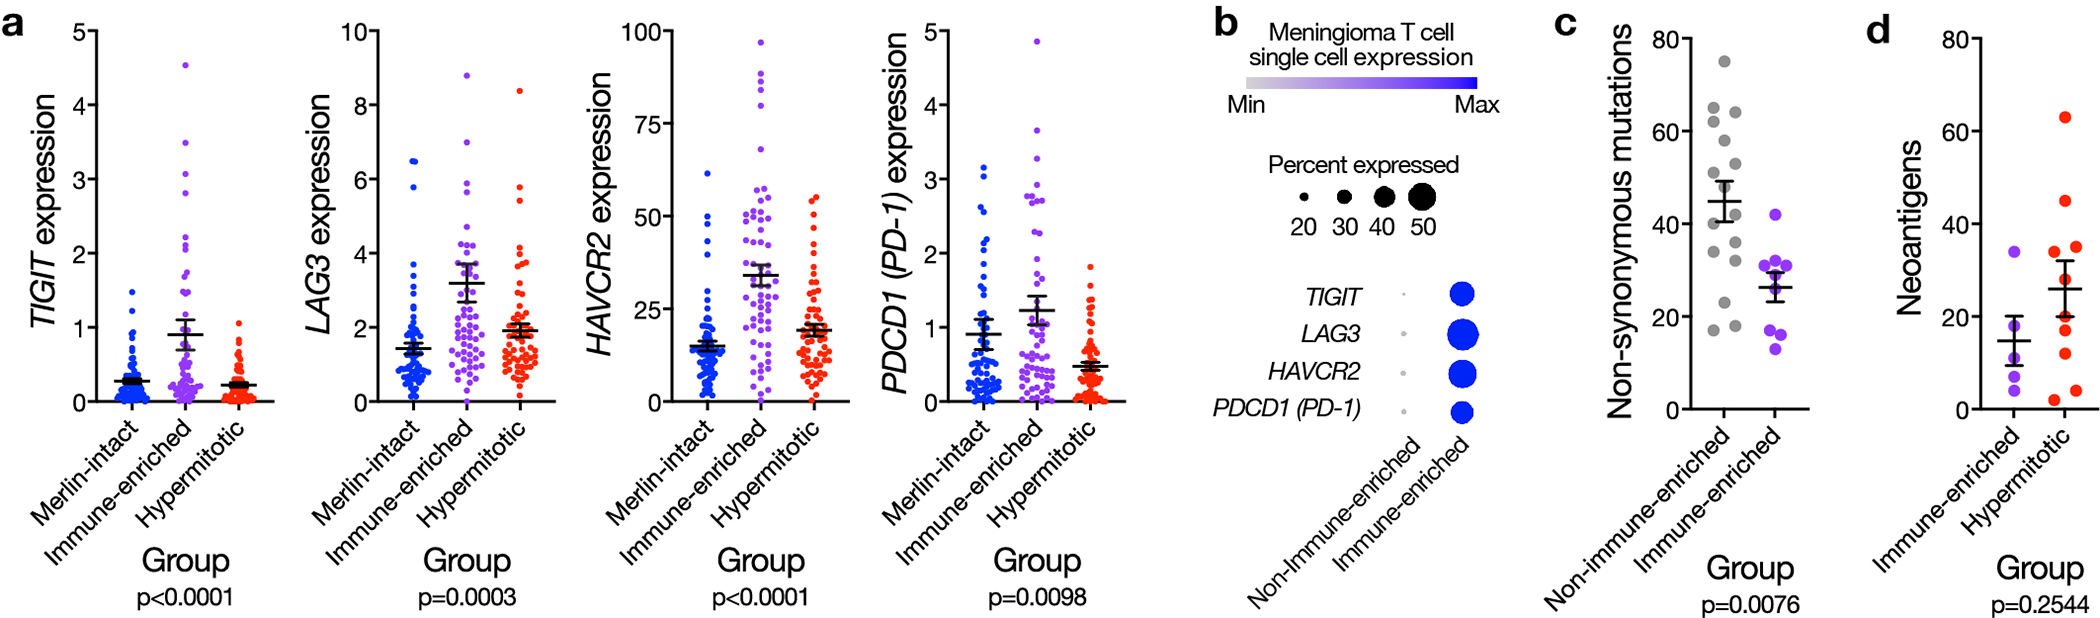
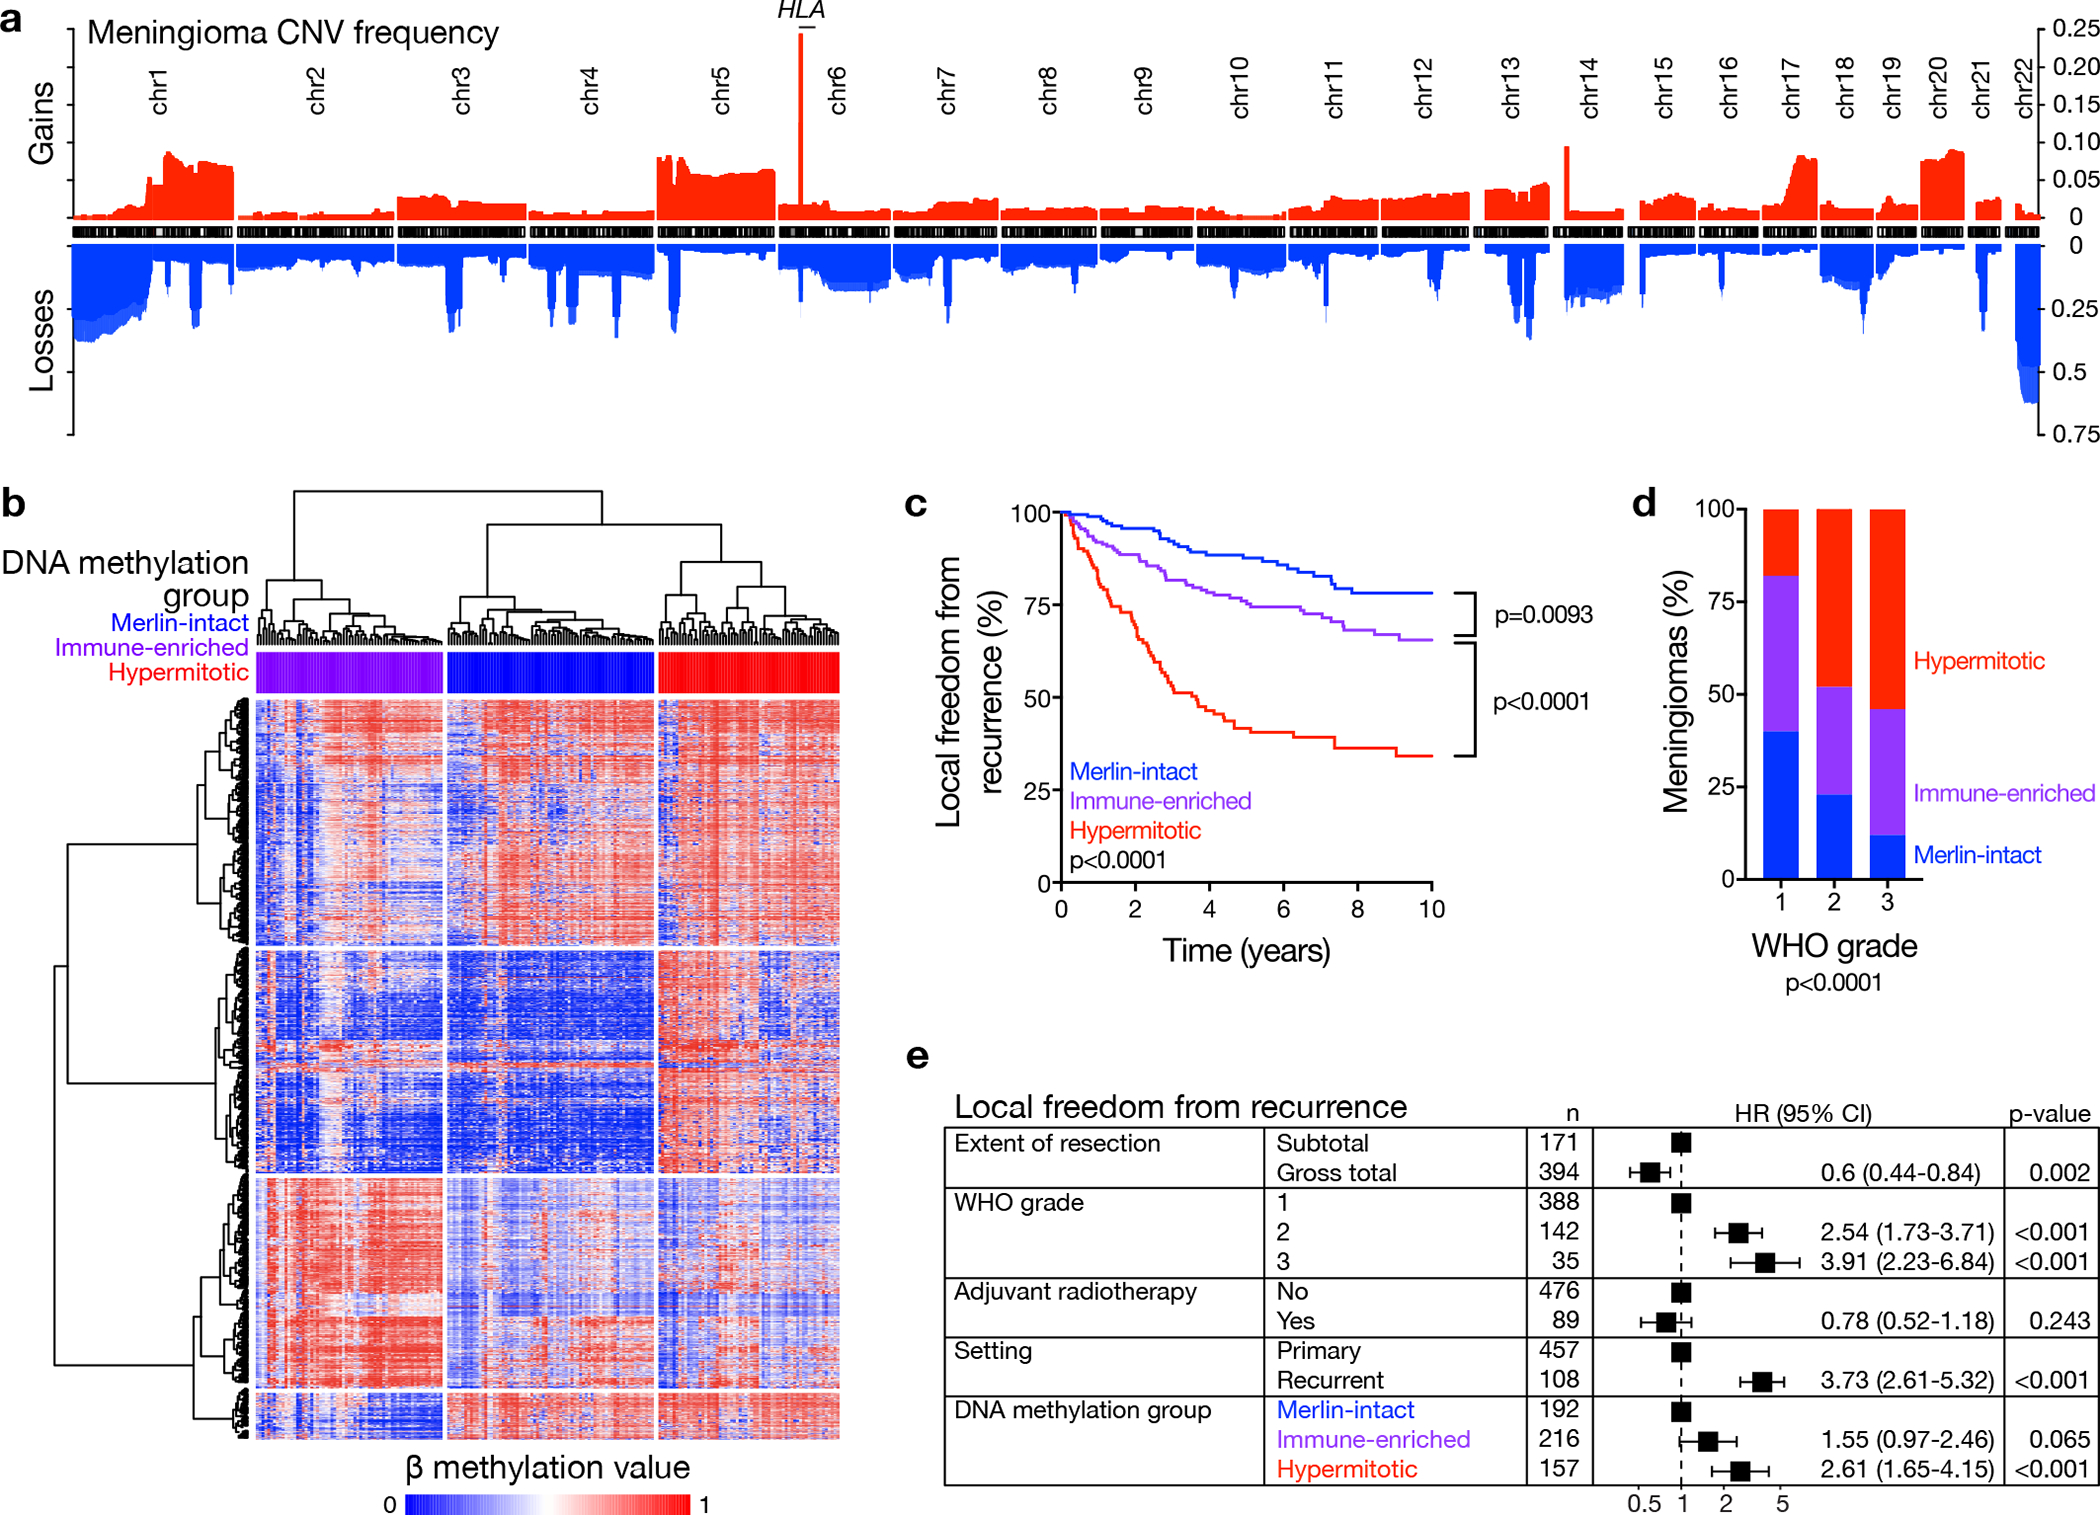
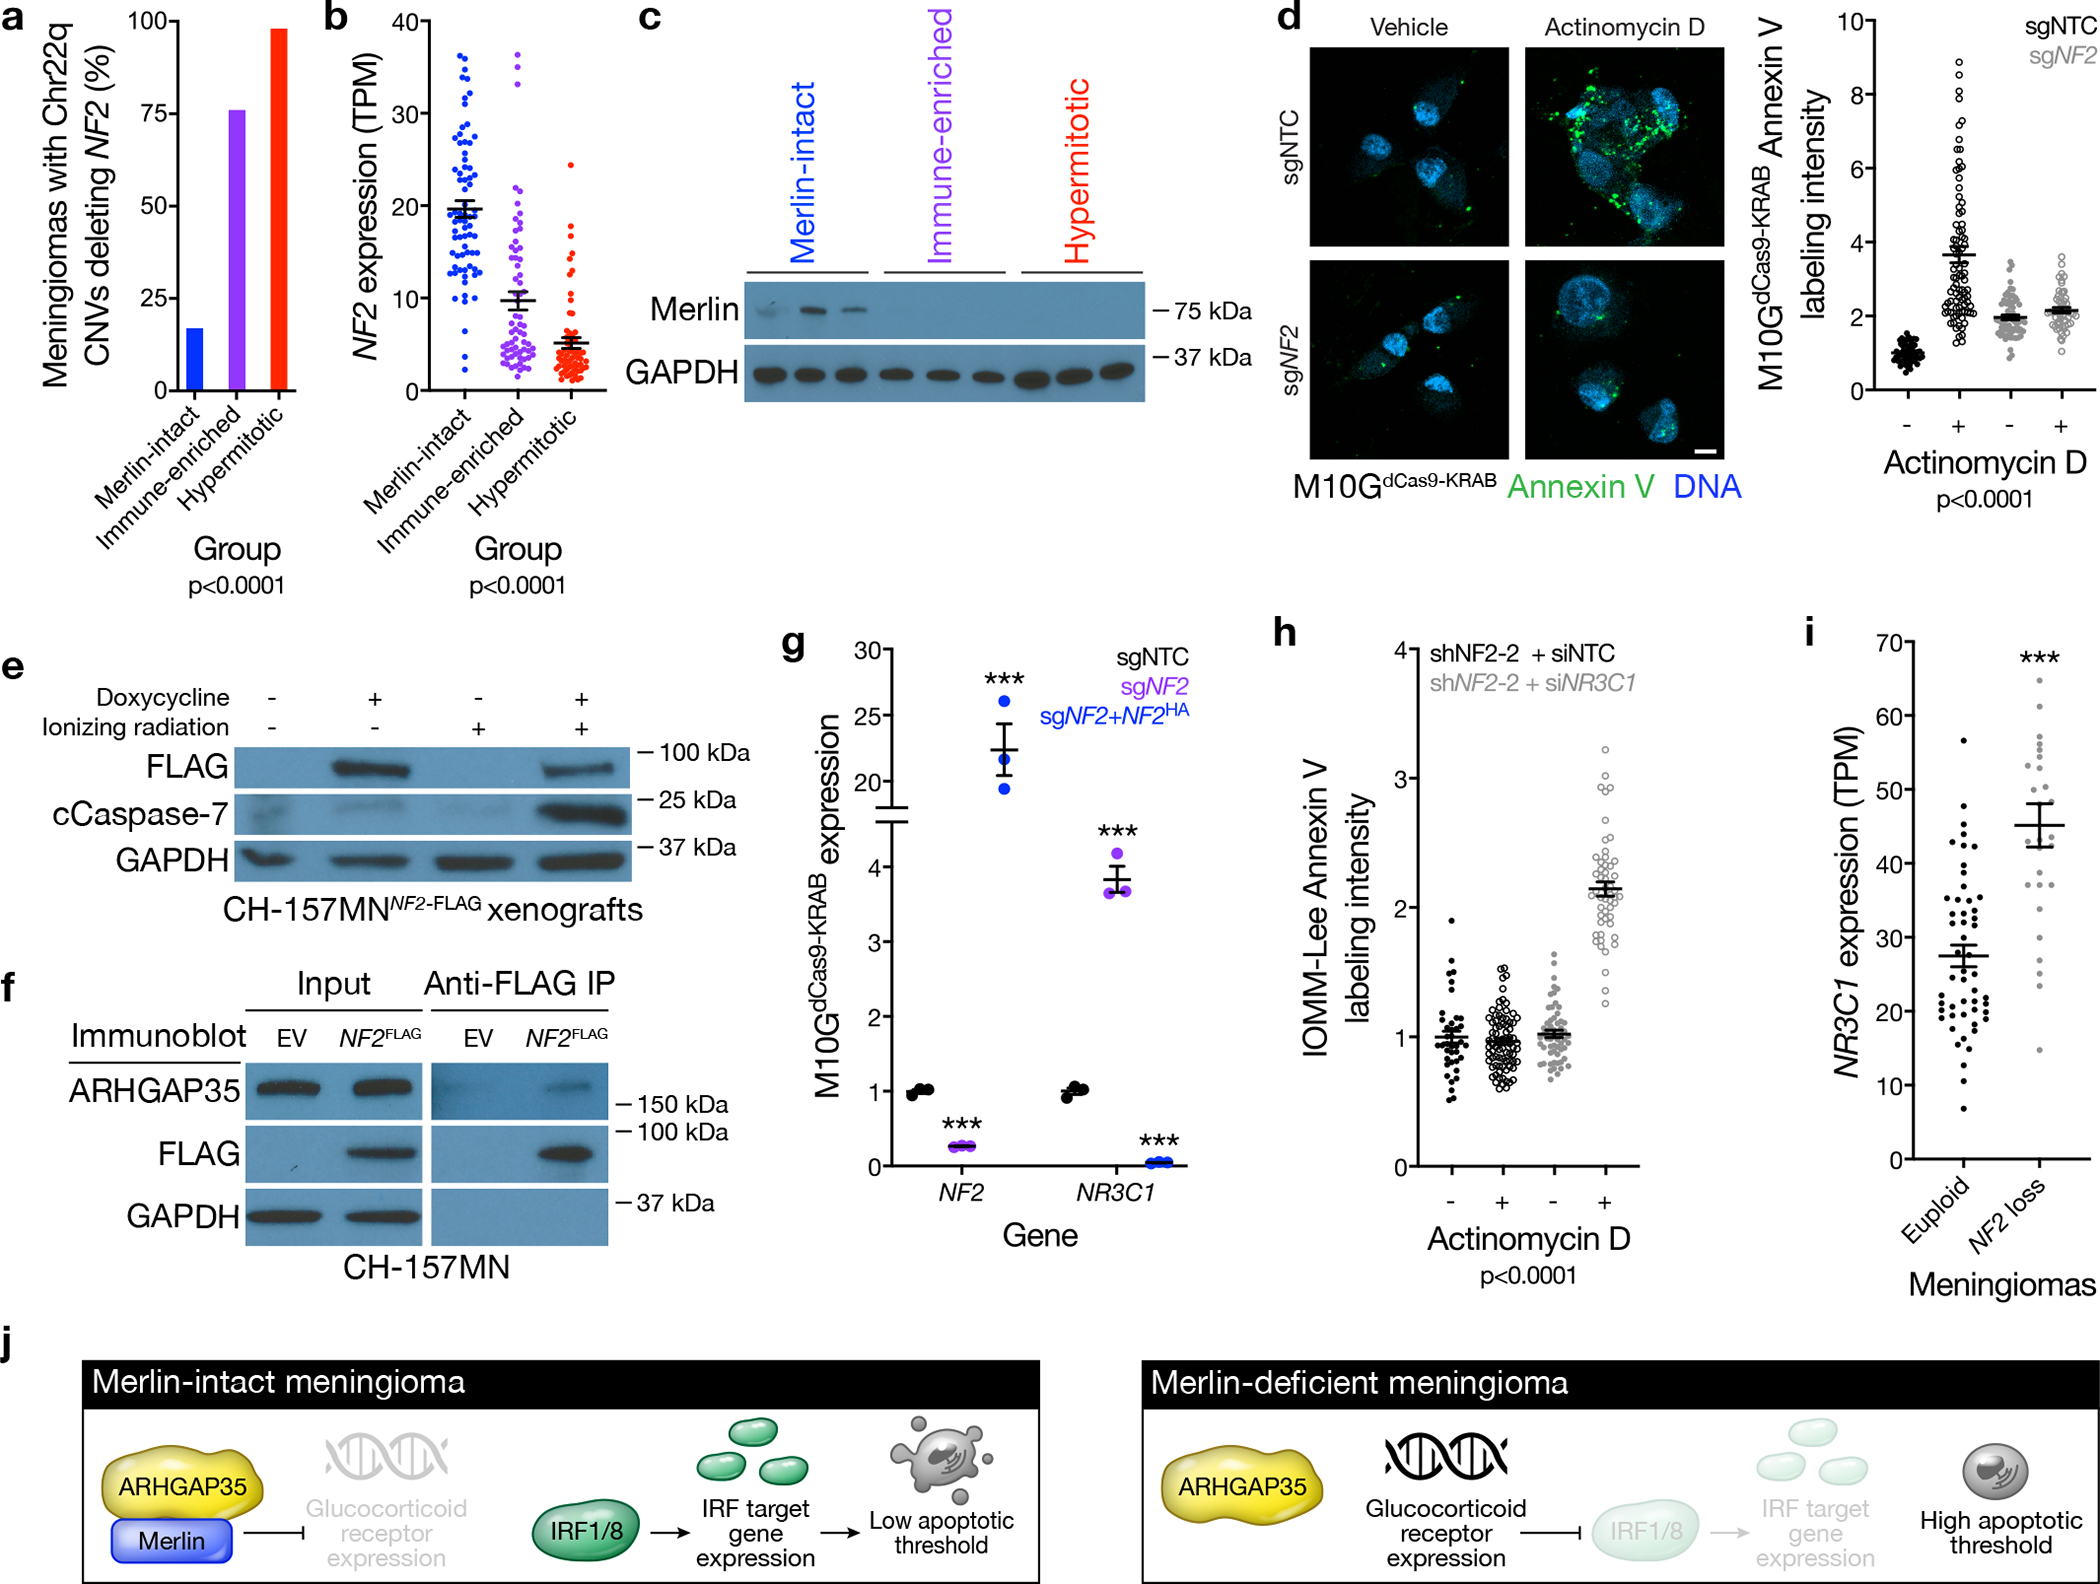
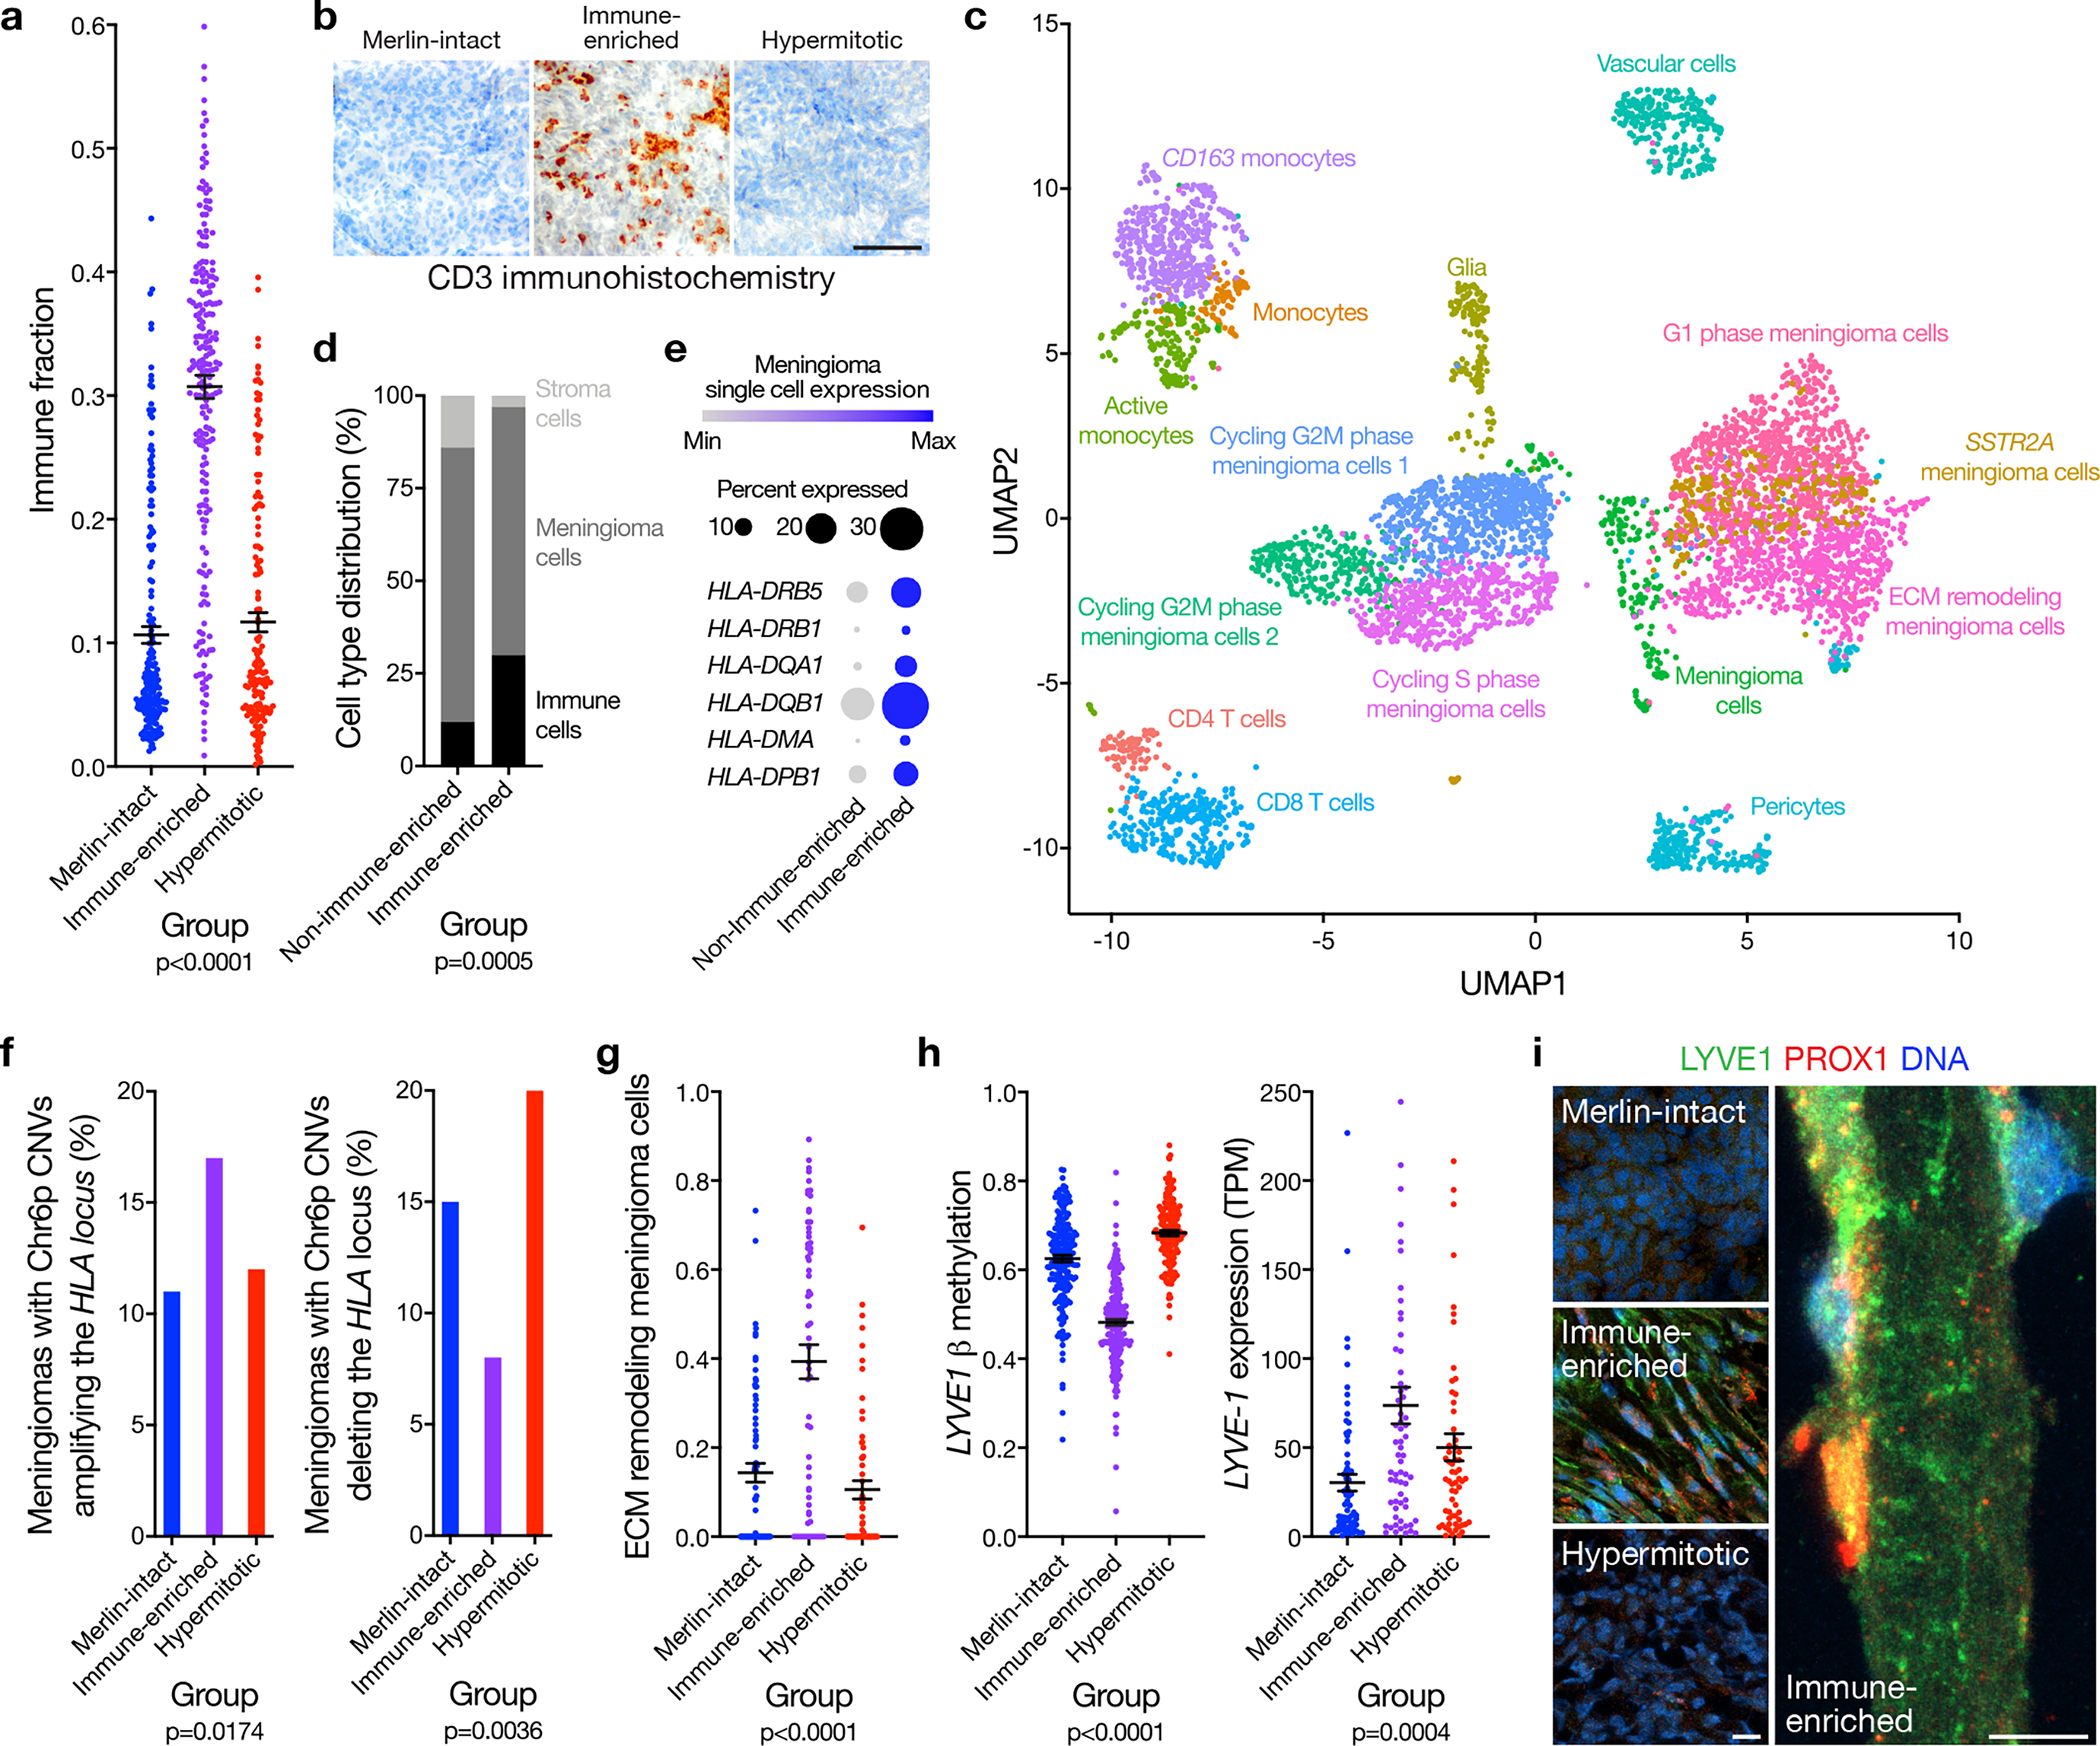
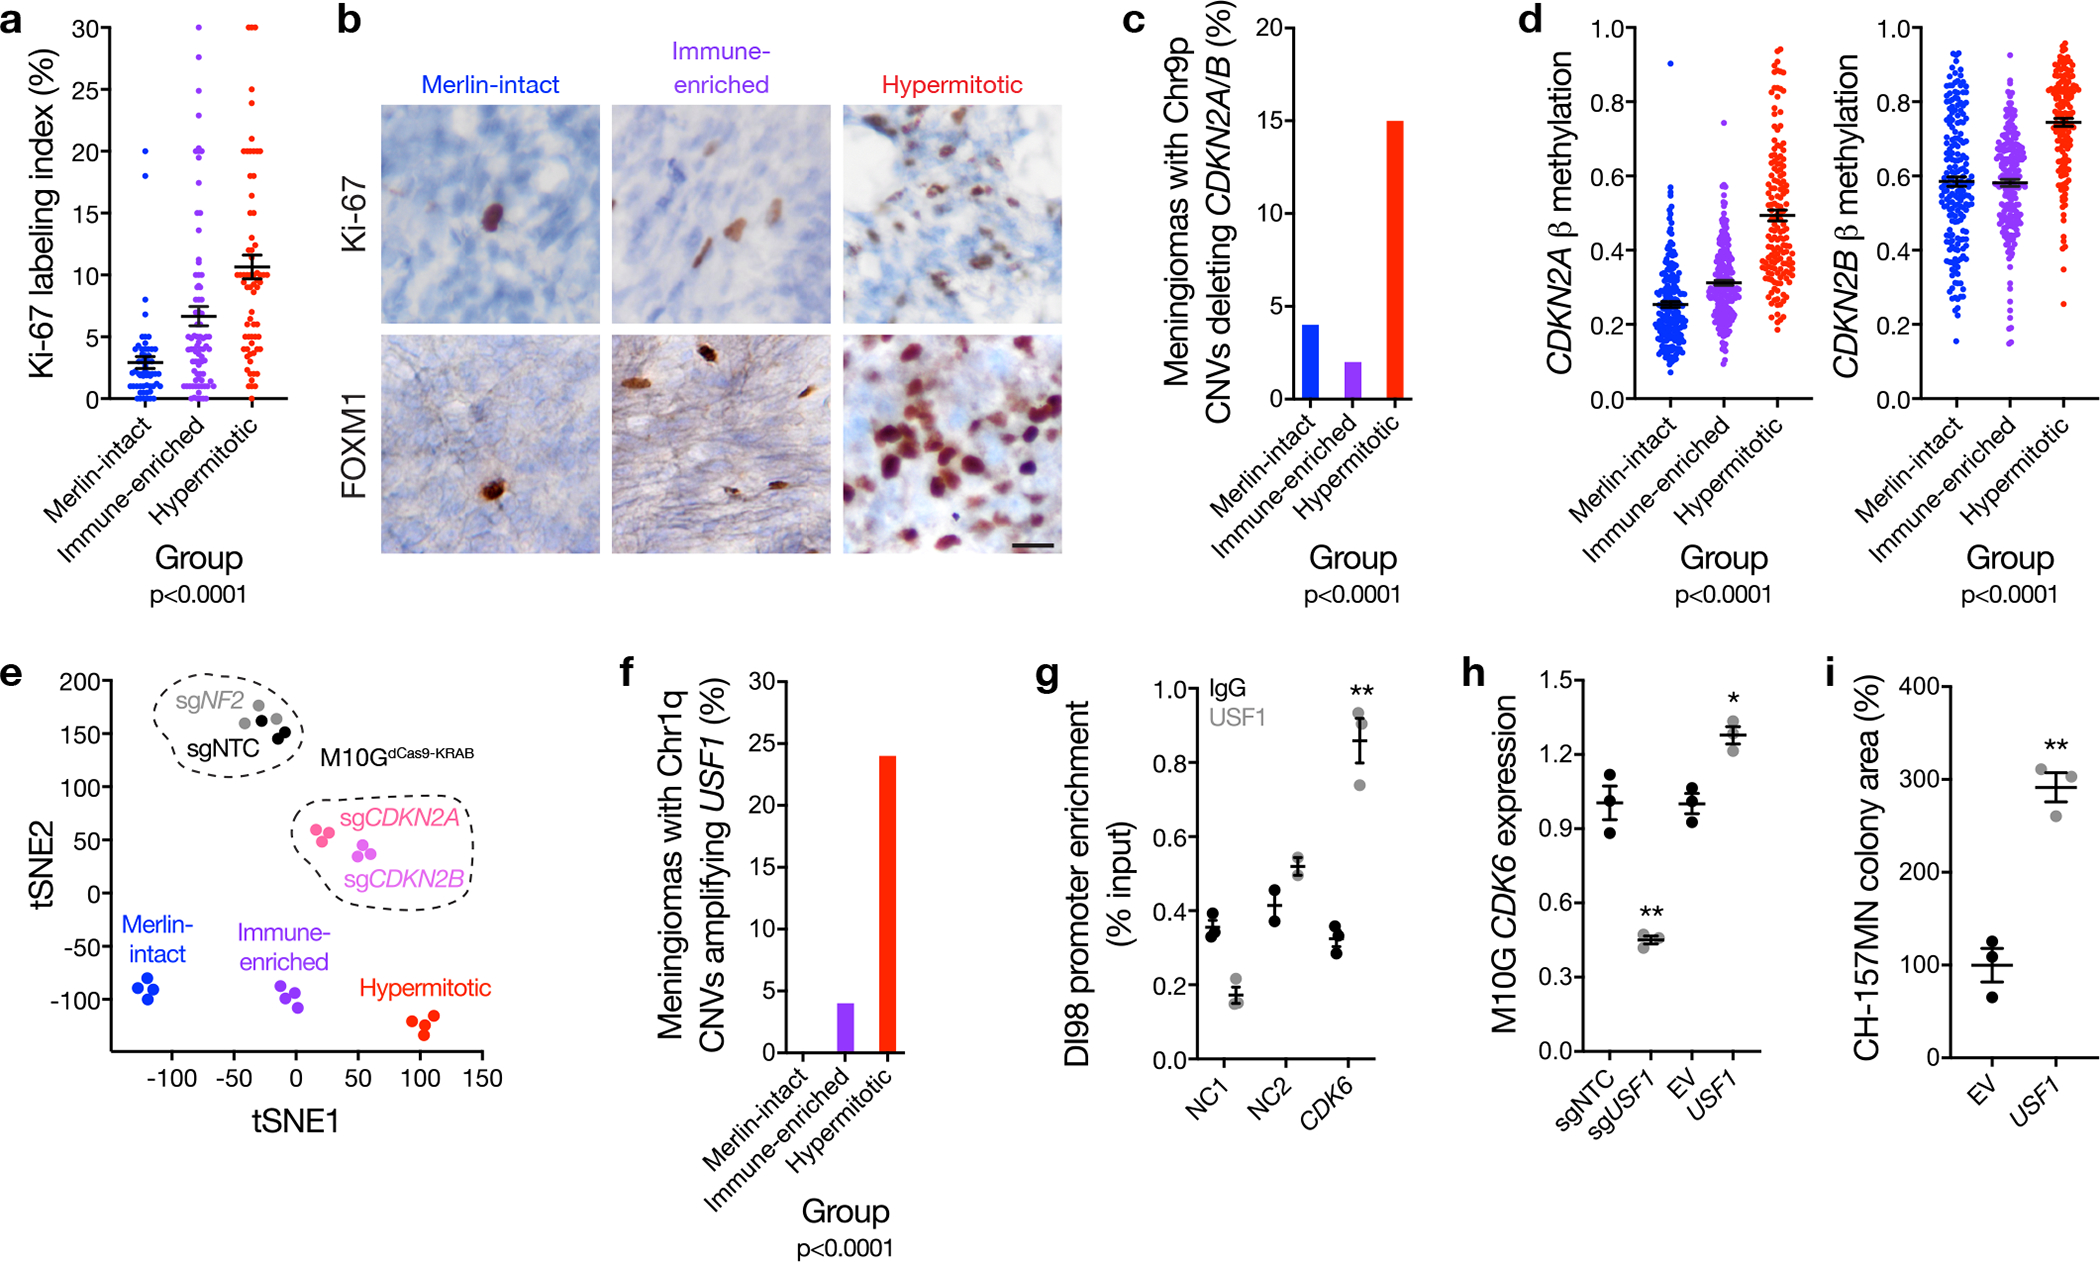
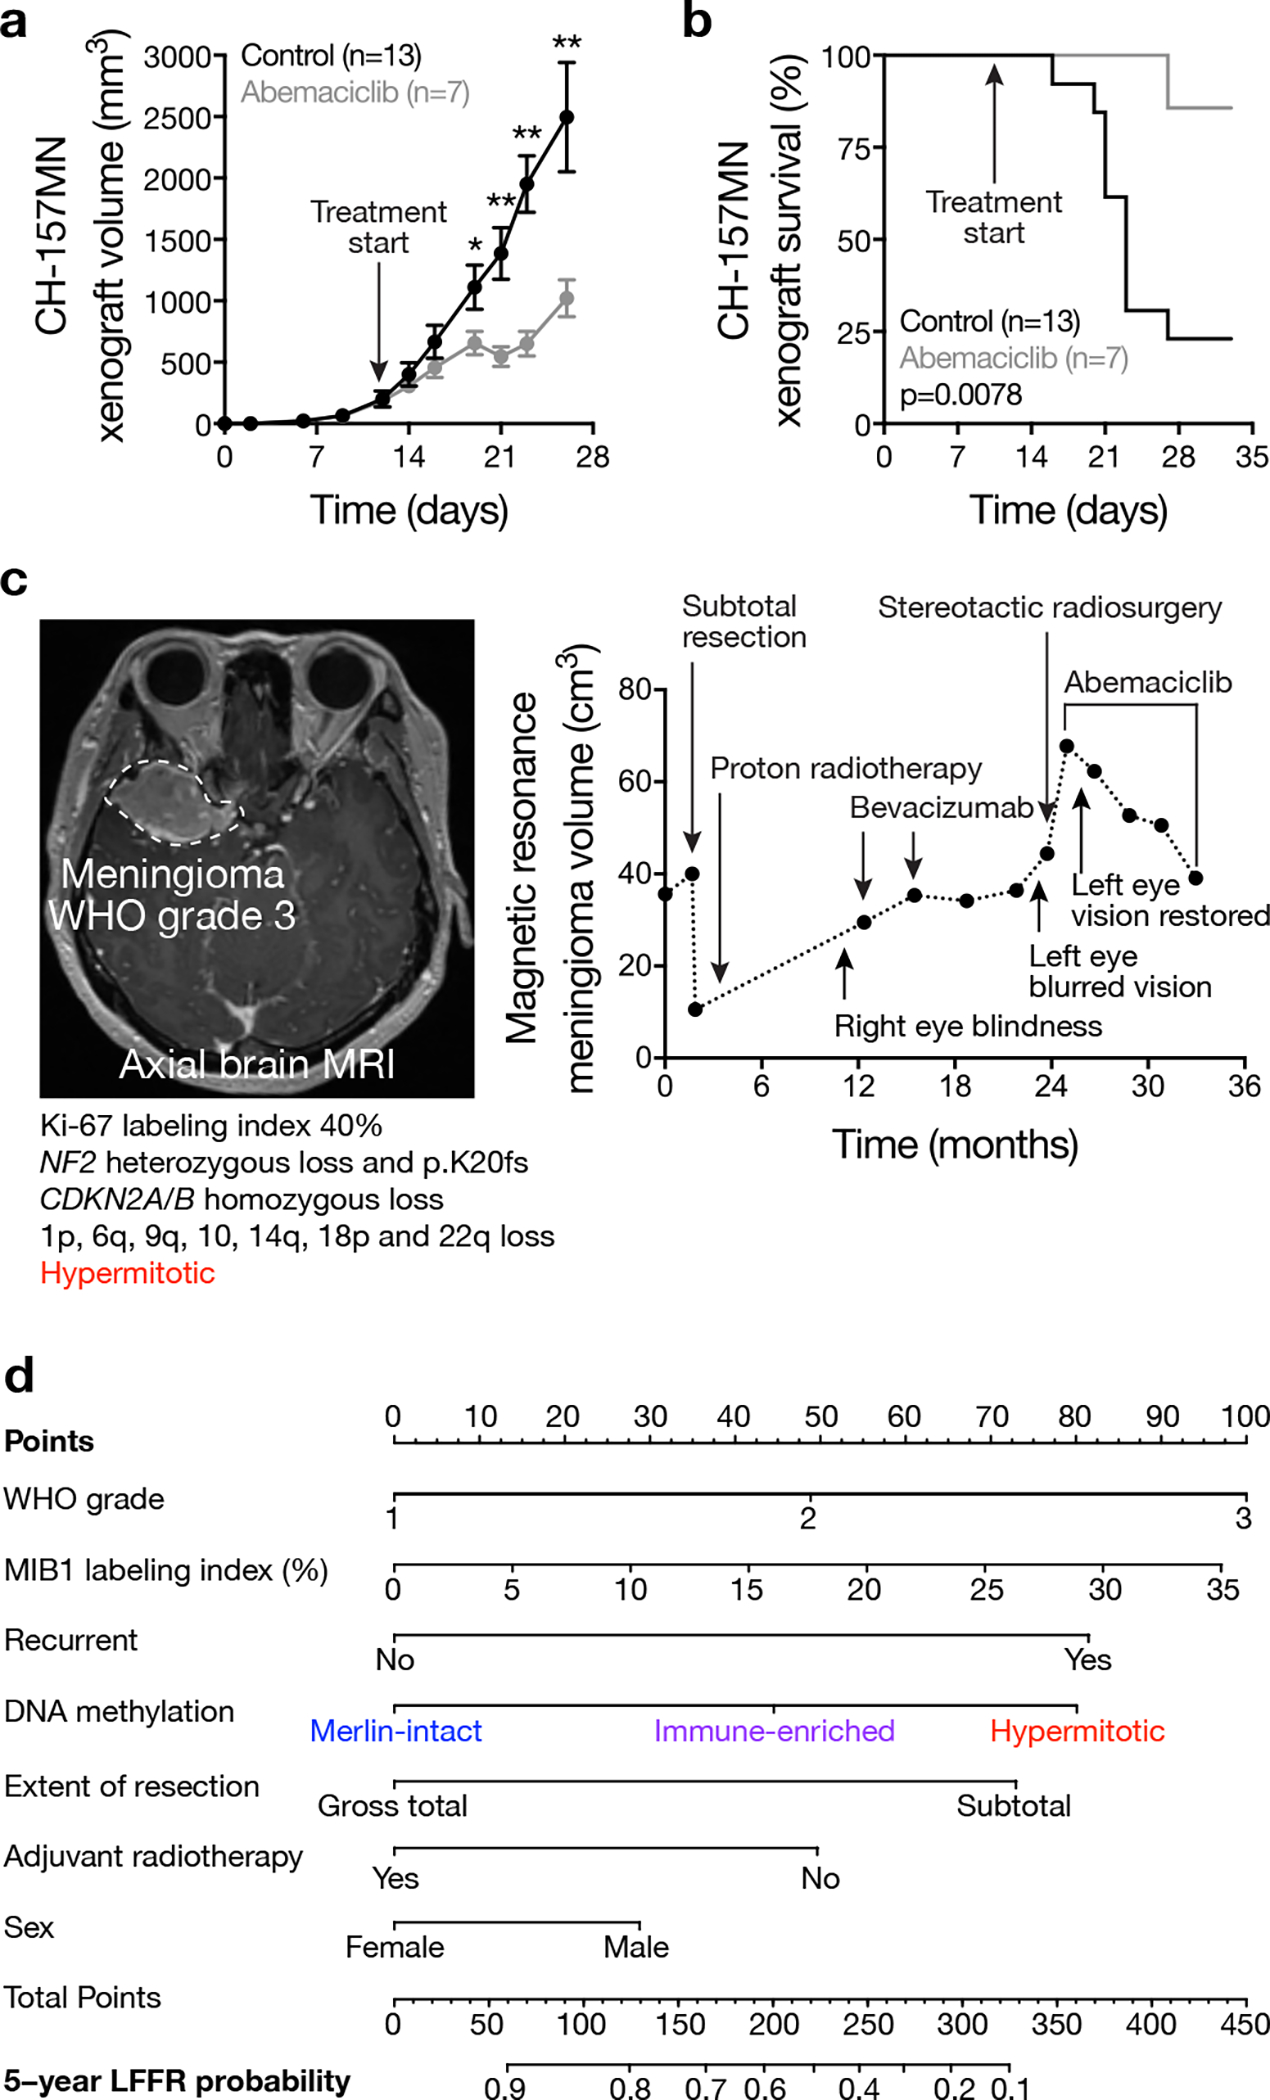
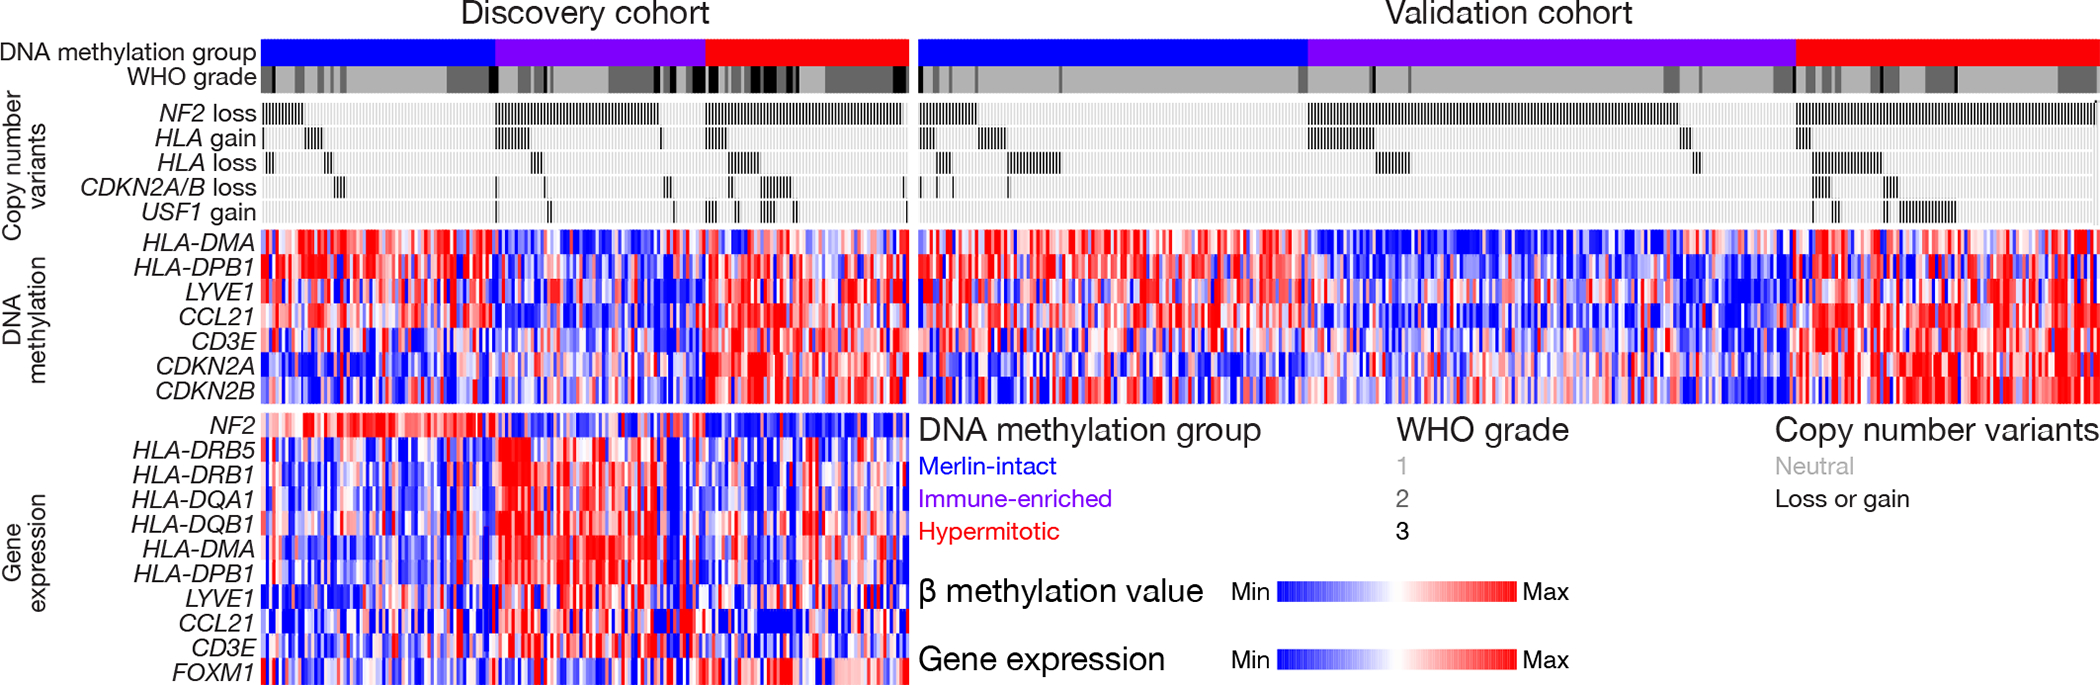
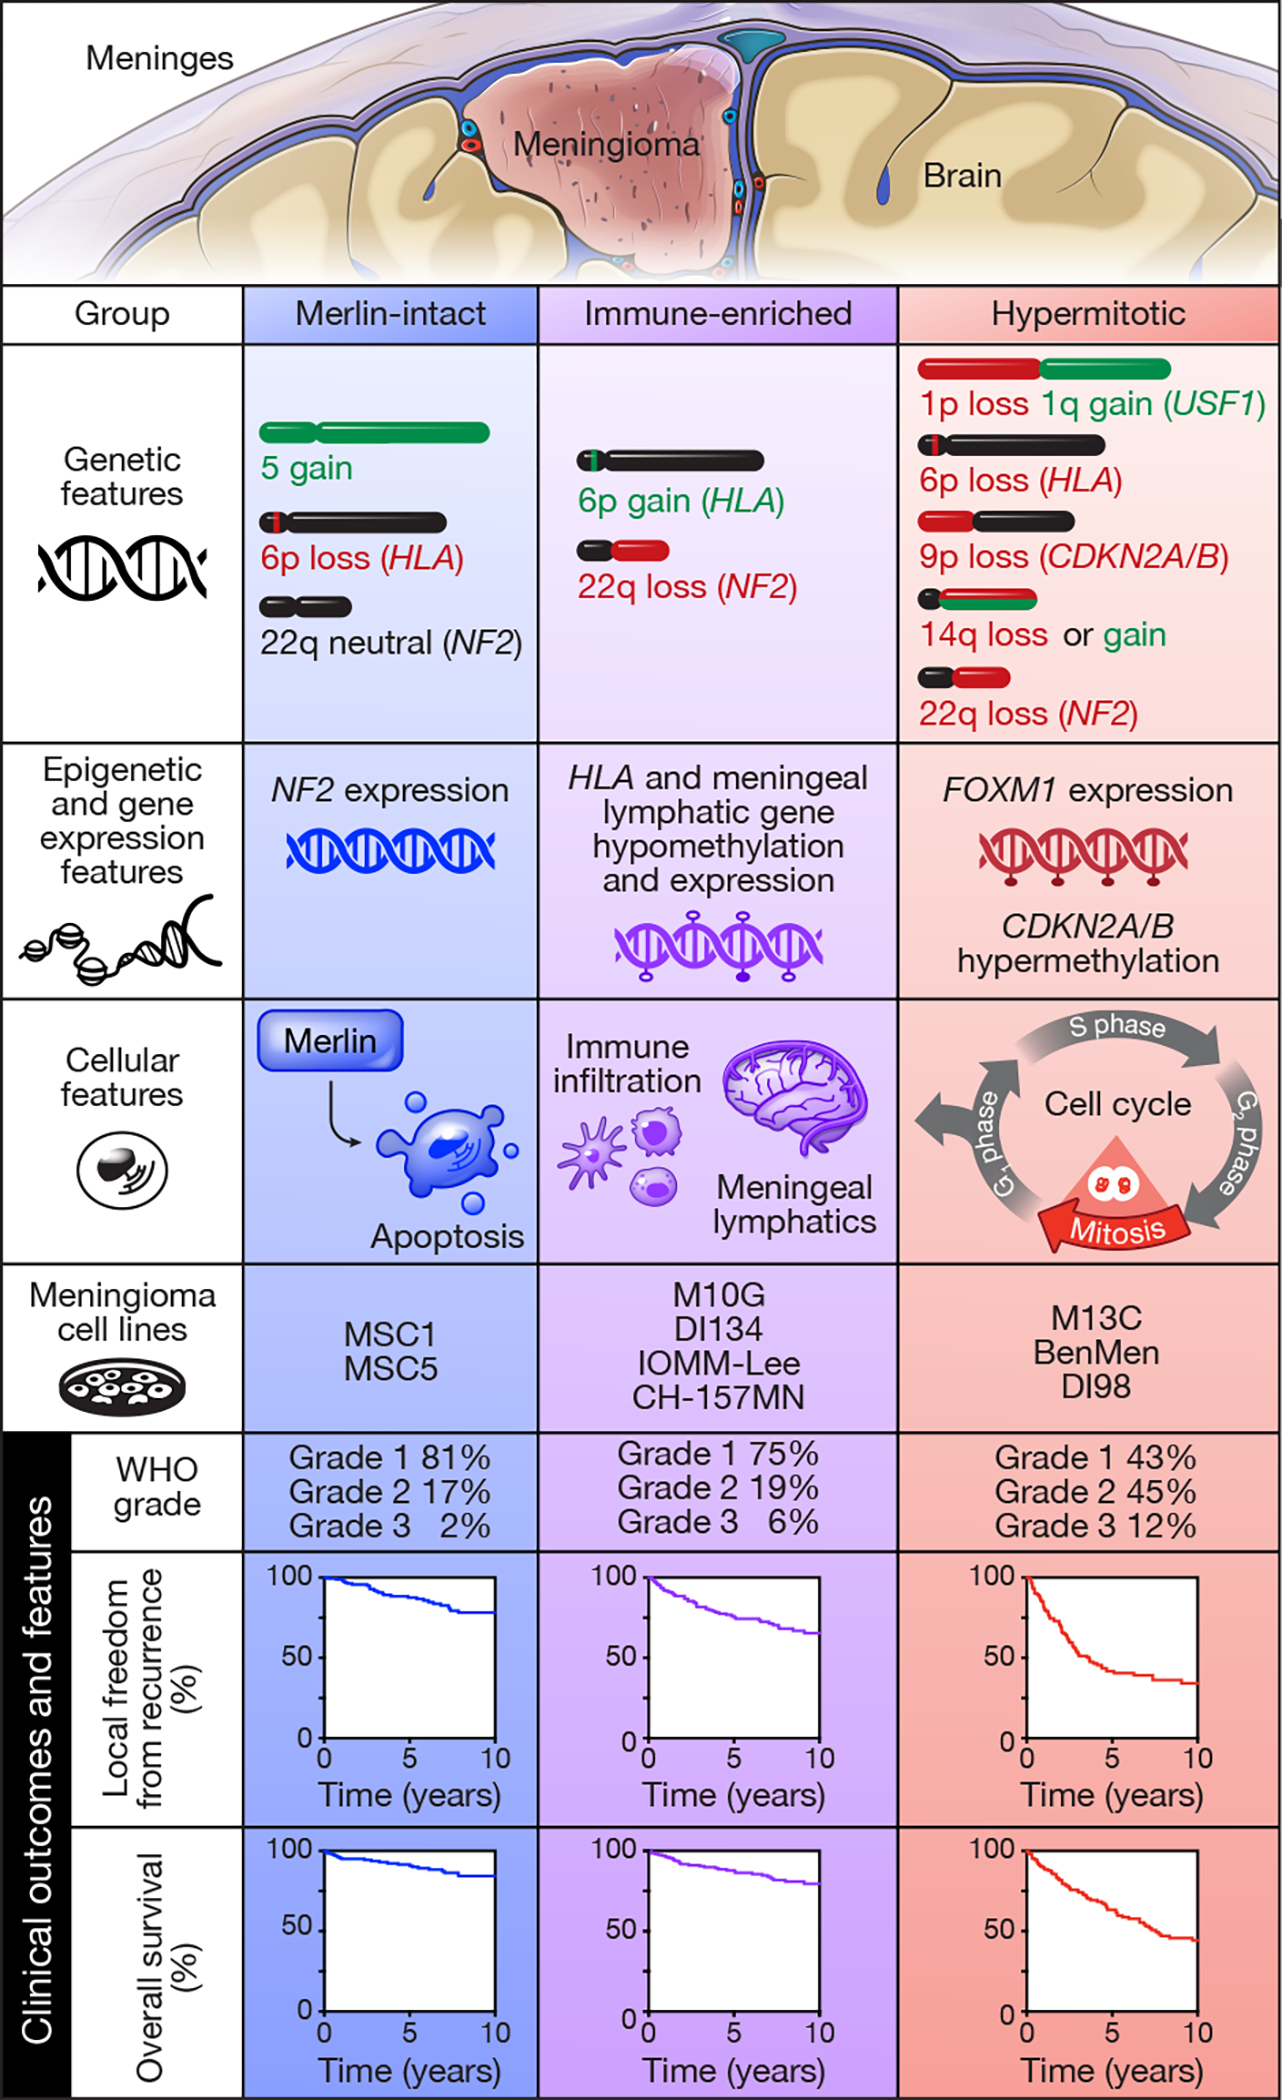
Meningiomas are the most common primary intracranial tumors. There are no effective medical therapies for meningioma patients, and new treatments have been encumbered by limited understanding of meningioma biology. Here, we use DNA methylation profiling on 565 meningiomas integrated with genetic, transcriptomic, biochemical, proteomic and single-cell approaches to show meningiomas are composed of three DNA methylation groups with distinct clinical outcomes, biological drivers and therapeutic vulnerabilities. Merlin-intact meningiomas (34%) have the best outcomes and are distinguished by NF2/Merlin regulation of susceptibility to cytotoxic therapy. Immune-enriched meningiomas (38%) have intermediate outcomes and are distinguished by immune infiltration, HLA expression and lymphatic vessels. Hypermitotic meningiomas (28%) have the worst outcomes and are distinguished by convergent genetic and epigenetic mechanisms driving the cell cycle and resistance to cytotoxic therapy. To translate these findings into clinical practice, we show cytostatic cell cycle inhibitors attenuate meningioma growth in cell culture, organoids, xenografts and patients.


Conflict of interest statement

Competing interests statement

The authors declare no competing interests.

Figures

Extended Data Fig. 1
Extended Data Fig. 1. DNA methylation analysis using SeSAMe to control for the influence of CNVs on β values identifies 3 groups of meningiomas.
a, Scree/elbow plot of principal component analysis (PCA) of meningioma DNA methylation profiles suggesting differentially methylated DNA probes from the top 3 to 4 principal components (PCs) provide the most information in the discovery cohort (n=200). b, K-means consensus clustering of meningioma DNA methylation profiles from the discovery cohort (n=200) using differentially methylated DNA probes from the top 2–4 PCs across k=2–7 groups, suggesting 3 PCs and k=3 groups are optimal. c, Continuous distribution functions from K-means consensus clustering of meningiomas from the discovery cohort (n=200) using differentially methylated DNA probes from the top 2 or 3 PCs across k=3 groups, validating 3 PCs as the optimal number (p<2.2×10⁻¹⁶, Kolmogorov-Smirnov test). d, Distribution of absolute DNA methylation probe loadings across the top 3 PCs from the discovery cohort (n=200) for the top 10,000 probes for each PC. Loading distribution plots for each PC were similar, and the top 700 probes for each PC were selected using the elbow method for meningioma clustering. e, Unsupervised hierarchical clustering of meningiomas from the discovery cohort (n=200) using 500, 1000, or 1500 differentially methylated DNA probes from each PC demonstrating the precise number of probes from each PC does not significantly influence meningioma DNA methylation grouping. In comparison to Figure 1b, altering the number of probes for meningioma DNA methylation grouping only altered assignments for 3–9 meningiomas (1–4%). Merlin-intact (blue), Immune-enriched (purple), and Hypermitotic (red) DNA methylation group assignments are from Figure 1b.
Extended Data Fig. 2
Extended Data Fig. 2. Independent validation of 3 meningioma DNA methylation groups.
a, K-means consensus clustering of meningioma DNA methylation profiles from the discovery (n=200, UCSF) and validation (n=365, HKU) cohorts. b, Sampling distributions of DNA methylation group fractions from the discovery cohort (n=100 per DNA methylation group), with the observed DNA methylation group fractions from the validation cohort denoted in grey. Lines represent means, and error bars represent standard deviations. The observed fractions of each DNA methylation group from the validation cohort fall within the sampling distributions from the discovery cohort.
Extended Data Fig. 3
Extended Data Fig. 3. Meningioma DNA methylation grouping using SeSAMe to control for the influence of CNVs on β values compared to approaches that do not control for the influence of CNVs on β values.
a, Unsupervised hierarchical clustering of meningiomas from the discovery cohort (n=200) using 2,000 differentially methylated DNA probes from the minfi pre-processing pipeline, which does not control for the influence of CNVs on β values. SeSAME meningioma DNA methylation groups (21% altered by minfi) are shown beneath the vertical dendrogram. b, K-means consensus clustering of meningiomas from the discovery and validation cohorts (n=565) using differentially methylated DNA probes and β values from SeSAMe or minfi. SeSAMe consensus clustering identifies 3 groups as the optimal number, but minfi consensus clustering is unable to discriminate between 3 and 4 clusters. c, Continuous distribution functions (CDFs) from K-means consensus clustering of meningiomas from the discovery and validation cohorts (n=565) using differentially methylated DNA probes and β values from SeSAMe or minfi. SeSAMe CDFs validated 3 groups as the optimal number, which was quantitatively different from 3 minfi groups (p=1.341×10⁻⁴) or 4 minfi groups (p<2.2×10⁻⁶) (Kolmogorov-Smirnov test). d, Kaplan-Meier curves for meningioma local freedom from recurrence (n=565) across minfi DNA methylation groups fails to identify a grouping scheme with non-redundant differences in clinical outcomes, in contrast to SeSAMe DNA methylation groups (Figure 1c) (Log-rank tests). minfi meningioma DNA methylation grouping schemed comprised of 3, 4, 5, or 6 groups are designated by letters A-C, A-D, A-E, or A-F, respectively.
Extended Data Fig. 4
Extended Data Fig. 4. Mechanisms of NF2/Merlin tumor suppression in meningioma cells.
a, Meningioma NF2 copy number deletions containing the entire locus and targeted sequencing of somatic short variants (SSV, n=65) across DNA methylation groups (Chi-squared test, two-sided). b, QPCR for NF2 in M10GdCas9-KRAB cells expressing a non-targeting control single-guide RNA (sgNTC) or a single-guide RNA suppressing NF2 (sgNF2). 3 biological replicates per condition (Student’s t test, one-sided). c, Immunoblot for Merlin or GAPDH in M10GdCas9-KRAB cells expressing sgNTC, sgNF2, or sgNF2 with NF2 rescue (sgNF2+NF2HA). d, Confocal immunofluorescence microscopy and quantification of Ki-67 in M10GdCas9-KRAB cells from b. DNA is marked with Hoechst 33342. Scale bar 10 μM. From left to right, 123 or 145 cells are shown (Student’s t test, one-sided). e, QPCR for NF2 in IOMM-Lee cells stably expressing a non-targeting control shRNA (shNTC) or shRNAs suppressing NF2 (shNF2-1 or shNF2-2). From left to right, 3, 3, or 2 biological replicates are shown (ANOVA, one-sided). f, MTT cell proliferation of IOMM-Lee cells from e, normalized to shNTC at 120 hours. 4 biological replicates per condition per timepoint. *p=0.0101, **p≤0.01 (ANOVA, one-sided). g, Volcano plots of relative gene expression from RNA sequencing of M10GdCas9-KRAB cells in c. Interferon-regulated genes (including IFIT2, validated in j) are marked in red. h, Gene ontology analysis of differentially expressed genes from RNA sequencing of M10GdCas9-KRAB cells in g. i, QPCR for NF2 in MSC1 cells stably expressing shNTC, shNF2-1, or shNF2-2. 3 biological replicates per condition (ANOVA, one-sided). j, QPCR for the IRF target gene IFIT2 in MSC1 cells from i. From left to right, 3, 2, or 3 biological replicates are shown (ANOVA, one-sided). Lines represent means, and error bars represent standard error of the means.
Extended Data Fig. 5
Extended Data Fig. 5. NF2/Merlin drives meningioma apoptosis.
a, Confocal microscopy and quantification of Annexin V in IOMM-Lee cells from Extended data figure 4e treated with actinomycin D or vehicle control for 24 hours. DNA is marked with DAPI. Scale bar 10 μM. From left to right, 96, 101, 95, 90, 98, or 75 cells are shown (ANOVA, one-sided). b, Immunoblot for Merlin, Caspase-7, cleaved Caspase-7 (cCaspase-7), or GAPDH in IOMM-Lee cells from a. c, Quantification of Annexin V confocal microscopy in MSC1 cells stably expressing sgNTC or sgNF2-2. Cells were treated as in a. From left to right, 29, 19, 40, or 30 cells are shown (ANOVA, one-sided). d, Representative images of cleaved Caspase-3 (cCaspase-3) immunohistochemistry from CH-157MN xenografts stably expressing doxycycline-inducible Merlin encoding a FLAG tag (NF2-FLAG) in NU/NU mice after 7 days of doxycycline (n=6) or vehicle treatment (n=6), and 24 hours after 4 Gy ionizing radiation (n=6) or control treatment (n=6). Scale bar 100 μM. e, Immunoblot for Merlin, IRF8, Tubulin, or Histone H3 (HH3) in cytoplasmic or nuclear fractions of M10GdCas9-KRAB cells from Extended data figure 4b. f, Normalized proteomic proximity-labeling mass spectrometry from M10G cells stably expressing Merlin constructs with APEX tags. From left to right, 2 or 3 biological replicates are shown. g, Immunoblot for IRF8 or FLAG after FLAG immunoprecipitation from M10G cells stably expressing Merlin encoding a FLAG tag (NF2FLAG). EV, empty vector. h, QPCR for the glucocorticoid receptor (NR3C1) in IOMM-Lee cells expressing a non-targeting control siRNA (siNTC) or siRNAs suppressing NR3C1 (siNR3C1). 3 biological replicates per condition (Student’s t test, one-sided). Lines represent means, and error bars represent standard error of the means.
Extended Data Fig. 6
Extended Data Fig. 6. Lymphatic vessels underlie meningioma immune infiltration.
a, Fraction of meningioma samples (n=200) classified meningioma single-cell types across DNA methylation groups, based on single-cell reference transcriptomes. Lines represent means, boxes represent inner quartile ranges, and error bars represent 10th-90th percentiles (ANOVA, one-sided). b, c, Meningioma location on preoperative magnetic resonance imaging (n=169) across DNA methylation groups (Chi-squared test, two-sided). Representative magnetic resonance image shown. d, Meningioma DNA methylation (n=565) of CCL21 (cg27443224) and TPM expression (n=200) of CCL21 across DNA methylation groups (ANOVA, one-sided). e, Meningioma DNA methylation (n=565) of CD3E (cg08956138) and TPM expression (n=200) of CD3E across DNA methylation groups (ANOVA, one-sided). f, Representative image of LYVE1 and PROX1 confocal immunofluorescence microscopy in CH157-MN xenografts in NU/NU mice (n=3). DNA is marked with Hoechst 33342. Scale bars 10 μM. Lines represent means, and error bars represent standard error of the means. *p≤0.05, **p≤0.01, ***p≤0.0001.
Extended Data Fig. 7
Extended Data Fig. 7. FOXM1 target gene functions in meningiomas and meningioma cells.
a, Predicted network of FOXM1-regulated pathways in Hypermitotic meningiomas based on H3K27ac ChIP sequencing of 25 meningiomas with matched RNA sequencing and DNA methylation profiling (15 Hypermitotic, 10 non-Hypermitotic). b, Immunoblot for Merlin, FOXM1, or GAPDH in IOMM-Lee meningioma cells stably expressing a non-targeting ontrol shRNA (shNTC) or shRNAs suppressing NF2 (shNF2-1 or shNF2-2), after treatment with actinomycin D or vehicle control for 24 hours. c, QPCR for FOXM1 in M10G meningioma cells over-expressing FOXM1 or empty vector (EV). 3 biological replicates per condition. ***p≤0.0001 (Student’s t test, one-sided). d, Quantification of Annexin V confocal microscopy in M10G cells over-expressing FOXM1 or EV after treatment with actinomycin D or vehicle control for 24 hours. From left to right, 57, 58, 65, or 60 cells are shown (ANOVA, one-sided). Lines represent means, and error bars represent standard error of the means.
Extended Data Fig. 8
Extended Data Fig. 8. Cell cycle inhibition blocks meningioma growth in cells, organoids, and xenografts.
a, Relative colony area of M10G, BenMen, CH-157MN, or IOMM-Lee meningioma cells after 10 days of clonogenic growth and treatment with abemaciclib, ribociclib, or palbociclib. 3 biological replicates per condition per timepoint. b, Relative colony area of M10GdCas9-KRAB cells expressing sgNTC, sgCDKN2A, or sgCDKN2B after 10 days of clonogenic growth and treatment with abemaciclib. 3 biological replicates per condition. *p=0.002, **p=0.001 (Student’s t test, one-sided). Data are normalized to growth with vehicle treatment of each cell lines. c, Relative colony area of CH-157MN cells stably over-expressing USF or empty vector (EV) after 10 days of clonogenic growth and treatment with abemaciclib. 3 biological replicates per condition. **p=0.001 (Student’s t test, one-sided). Data are normalized to growth with vehicle treatment of each cell lines. d, Quantification of BenMen peri-organoid intensity after 10 days of growth and treatment with abemaciclib or vehicle control Representative images of meningioma (red) and organoid (green) cells are shown. Scale bar 100 μM. 5 biological replicates per condition (ANOVA, one-sided). e, Representative immunoblots from CH-157MN xenografts in NU/NU mice (left) harvested at intervals after a single treatment of abemaciclib (100 μg/g) via oral gavage (right). f, Representative images of CH-157MN xenograft Ki-67 immunohistochemistry after a daily treatment of abemaciclib or control. Scale bar 1 mm. Lines represent means, and error bars represent standard error of the means.
Extended Data Fig. 9
Extended Data Fig. 9. Meningioma DNA methylation grouping schemes uncontrolled for the influence of CNVs on β values.
a, Meningioma DNA methylation analysis of copy number loss at the NF2 locus (n=565) across different numbers of DNA methylation groups determined by the minfi pre-processing pipeline (Chi-squared tests, two-sided). b, Meningioma DNA methylation estimation of leukocyte fraction (n=565) across different numbers of DNA methylation groups determined by the minfi pre-processing pipeline (ANOVA, one-sided). c, Ki-67 labeling index from meningioma clinical pathology reports (n=206) across different numbers of DNA methylation groups determined by the minfi pre-processing pipeline (ANOVA, one-sided). b, Meningioma genomes (n=565) with copy number variations (CNVs) across DNA methylation groups determined by the minfi pre-processing pipeline (ANOVA, one-sided). Regardless of the number of groups, meningioma DNA methylation analysis uncontrolled for the influence of CNVs on β values cannot identify a grouping scheme with non-redundant differences in clinical outcomes (Extended data figure 3d), NF2 loss, immune enrichment, cell proliferation, and chromosome instability. Lines represent means, and error bars represent standard error of the means. minfi meningioma DNA methylation grouping schemed comprised of 3, 4, 5, or 6 groups are designated by letters A-C, A-D, A-E, or A-F, respectively.
Extended Data Fig. 10
Extended Data Fig. 10. Immune-enriched meningiomas display markers of T cell exhaustion and immunoediting.
a, Meningioma transcripts per million (TPM) expression of TIGIT, LAG3, HAVCR2, or PDCD1 (n=200) T cell exhaustion markers across DNA methylation groups. Lines represent means, and error bars represent standard error of the means (ANOVA, one-sided). b, Single-cell RNA sequencing relative expression of immune exhaustion genes in T cells across Immune-enriched (n=5) and non-Immune-enriched (n=3) meningioma samples. Circle size denotes percentage of cells. Circle shading denotes average expression. c, Non-synonymous mutations from whole-exome sequencing of Immune-enriched (n=9) and non-Immune-enriched (n=16) and meningiomas, with paired normal samples, overlapping with the discovery cohort. Lines represent means, and error bars represent standard error of the means (Student’s t test, one-sided). d, Neoantigen prediction from whole-exome sequencing of Immune-enriched (n=5) and Hypermitotic (n=9) meningiomas, with paired normal samples, overlapping with the discovery cohort. Lines represent means, and error bars represent standard error of the means (Student’s t test, one-sided).
Figure 1.
Figure 1.. Meningiomas are comprised of 3 DNA methylation groups with distinct outcomes.
a, Frequency of copy number losses (blue) and gains (red) across the discovery and validation cohorts (n=565). b, Unsupervised hierarchical clustering of meningiomas from the discovery cohort (n=200) using 2000 differentially methylated DNA probes. c, Kaplan-Meier curves for meningioma local freedom from recurrence from the discovery and validation cohorts (n=565) across DNA methylation groups (Log-rank test). d, Meningioma WHO grades (n=565) across DNA methylation groups (Chi-squared test, two-sided). e, Multivariable regression hazard ratio (HR) forest plots for local freedom from recurrence using meningioma clinical variables and DNA methylation groups (n=565, Cox proportional hazards model, Wald test, two-sided, no adjustment for multiple comparisons). Boxes represent means, and error bars represent 95% confidence intervals (CI).
Figure 2.
Figure 2.. NF2/Merlin drives meningioma apoptosis and susceptibility to cytotoxic therapy.
a, Meningioma DNA methylation analysis of chromosome 22q segment copy number deletions of any size containing the entire NF2 locus across Merlin-intact (n=32 of 192 meningiomas, 17%), Immune-enriched (n=165 of 216 meningiomas, 76%), and Hypermitotic (n=154 of 157 meningiomas, 98%) DNA methylation groups (n=565, Chi-squared test, two-sided). b, Meningioma NF2 transcripts per million (TPM) expression across Merlin-intact (n=72), Immune-enriched (n=65), and Hypermitotic (n=63) DNA methylation groups (n=200, ANOVA, one-sided). c, Immunoblot for Merlin or GAPDH in 3 meningiomas with loss of at least one copy of the NF2 locus from each meningioma DNA methylation group. d, Confocal microscopy and quantification of Annexin V in M10GdCas9-KRAB cells stably expressing a non-targeting control single-guide RNA (sgNTC) or a single-guide RNA suppressing NF2 (sgNF2) after 24 hours of actinomycin D or vehicle control treatment. DNA is marked with DAPI. Scale bar 10 μM. From left to right, 53, 88, 69, or 56 cells are shown (ANOVA, one-sided). e, Immunoblot for FLAG, cleaved Caspase-7 (cCaspase-7), or GAPDH from CH-157MN xenografts stably expressing doxycycline-inducible Merlin encoding a FLAG tag (NF2-FLAG) in NU/NU mice after 7 days of doxycycline or vehicle treatment, and 24 hours after 4 Gy ionizing radiation or control treatment. f, Immunoblot for ARHGAP35 or FLAG after FLAG immunoprecipitation from CH-157MN cells stably expressing Merlin encoding a FLAG tag (NF2FLAG). EV, empty vector. g, QPCR for NF2 or NR3C1 in M10GdCas9-KRAB cells stably expressing sgNTC, sgNF2, or sgNF2 with NF2 rescue (sgNF2+NF2HA). 3 biological replicates per condition (Student’s t test, one-sided). h, Quantification of Annexin V confocal microscopy in IOMM-Lee cells stably expressing a short-hairpin RNA suppressing NF2 (sgNF2-2) and transiently expressing a non-targeting control siRNA (siNTC) or siRNAs suppressing NR3C1 (siNR3C1). Cells were treated as in d. From left to right, 39, 80, 58, or 52 cells are shown (ANOVA, one-sided). i, NR3C1 TPM expression in euploid meningiomas (n=52) or meningiomas with loss of NF2 as the only CNV (n=28) (Student’s t test, one-sided). j, Model of Merlin pro-apoptotic tumor suppressor function in meningioma cells. Lines represent means, and error bars represent standard error of the means. ***p≤0.0001.
Figure 3.
Figure 3.. HLA expression and meningeal lymphatics underlie meningioma immune enrichment.
a, Meningioma DNA methylation leukocyte fractions (n=565) across DNA methylation groups (ANOVA, one-sided). b, Representative images of T cell immunohistochemistry across meningioma DNA methylation groups (n=87, p<0.0001, Chi-squared test, two-sided). Scale bar 100 μM. c, UMAP of single-cell RNA sequencing transcriptomes of 57,114 cells from 8 human meningioma samples and 2 human dura samples, colored by assignments from Louvain clustering. d, Quantification of single-cell types from c in Immune-enriched (n=5) and non-Immune-enriched (n=3) meningioma samples (Chi-squared test, two-sided). e, Single-cell RNA sequencing relative expression of HLA genes in meningioma cells across Immune-enriched (n=5) and non-Immune-enriched (n=3) meningioma samples. Circle size denotes percentage of cells. Shading denotes average expression. f, Meningioma DNA methylation analysis of chromosome 6p segment CNVs containing the entire polymorphic HLA locus encompassing HLA-DRB5, HLA-DRB1, HLA-DQA1, and HLA-DQB1 across Merlin-intact (n=192 meningiomas, 21 gains, 28 losses), Immune-enriched (n=216 meningiomas, 37 gains, 18 losses), and Hypermitotic (n=157 meningiomas, 12 gains, 32 losses) DNA methylation groups (Chi-squared test, two-sided). g, Fraction of meningioma samples (n=200) classified as extracellular matrix (ECM) remodeling meningioma cells across DNA methylation groups, based on single-cell reference transcriptomes from c (ANOVA, one-sided). h, Meningioma DNA methylation (n=565) of LYVE1 (cg26455970) and transcripts per million (TPM) expression (n=200) of LYVE-1 across DNA methylation groups (ANOVA, one-sided). i, Representative images of meningioma LYVE1 and PROX1 immunofluorescence microscopy across DNA methylation groups (n=12). DNA is marked with Hoechst 33342. Scale bars 10 μM. Lines represent means, and error bars represent standard error of the means.
Figure 4.
Figure 4.. Convergent genetic and epigenetic mechanisms misactivate the cell cycle in meningioma.
a, Ki-67 labeling index from meningioma clinical pathology reports (n=206) across DNA methylation groups (ANOVA, one-sided). b, Representative images of meningioma Ki-67 and FOXM1 immunohistochemistry (n=92) across meningioma DNA methylation groups. Scale bar 10 μM. c, Meningioma DNA methylation analysis of chromosome 9p segment copy number deletions of any size containing the entire CDKN2A/B locus across Merlin-intact (n=8 of 192 meningiomas, 4%), Immune-enriched (n=5 of 216 meningiomas, 2%), and Hypermitotic (n=24 of 157 meningiomas, 15%) DNA methylation groups (n=565, Chi-squared test, two-sided). d, Meningioma DNA methylation (n=565) of CDKN2A (cg26349275) or CDKN2B (cg08390209) across DNA methylation groups (ANOVA, one-sided). e, tSNE plot of meningioma and meningioma cell line DNA methylation profiles. Four representative meningiomas from each DNA methylation group are shown. Triplicate meningioma M10GdCas9-KRAB cultures stably expressing a non-targeting control single-guide RNA (sgNTC) or single-guide RNAs suppressing NF2 (sgNF2), CDKN2A (sgCDKN2A), or CDKN2B (sgCDKN2B) are shown. Differences in DNA methylation groups are captured in tSNE1, and a positive shift from Immune-enriched meningiomas to Hypermitotic meningiomas mimics the shift from M10GdCas9-KRAB-sgNTC and M10GdCas9-KRAB-sgNF2 cells to M10GdCas9-KRAB-sgCDKN2A and M10GdCas9-KRAB-sgCDKN2B cells. Differences between tumors and cell lines, such as the tumor microenvironment, are captured in tSNE2. f, Meningioma DNA methylation analysis of chromosome 1p segment copy number amplifications of any size containing the entire USF1 locus across Merlin-intact (n=0 of 192 meningiomas, 0%), Immune-enriched (n=2 of 216 meningiomas, 4%), and Hypermitotic (n=38 of 157 meningiomas, 24%) DNA methylation groups (n=565, Chi-squared test, two-sided). g, USF1 ChIP-QPCR in DI98 meningioma cells for the CDK6 promoter compared to negative control primers targeting a gene desert (NC1) or a gene not predicted to be bound by USF1 (NC2) from ChIP sequencing. **p=0.001 (Student’s t test, one-sided, no adjustment for multiple comparisons). h, QPCR for CDK6 in M10GdCas9-KRAB cells expressing sgNTC or a single-guide RNA suppressing USF1 (sgUSF1), or M10G cells over-expressing USF1 or empty vector (EV). *p=0.003, **p=0.001 (Student’s t test, one-sided, no adjustment for multiple comparisons). i, Relative colony area of CH-157MN cells stably over-expressing USF1 or EV after 10 days of clonogenic growth. **p=0.001 (Student’s t test, one-sided, no adjustment for multiple comparisons). Lines represent means, and error bars represent standard error of the means.
Figure 5.
Figure 5.. Clinical translation of meningioma DNA methylation groups.
a, Subcutaneous CH-157MN xenograft measurements in NU/NU mice treated with abemaciclib (100 μg/g) by daily oral gavage with versus control. Lines represent means, and error bars represent standard error of the means. *p≤0.05, **p≤0.01 (Student’s t tests, one-sided). b, Kaplan-Meier curve for CH-157MN xenograft overall survival in NU/NU mice treated as in c (Log-rank test). c, Magnetic resonance imaging and molecular features of a representative human meningioma (left) that was resistant to cytotoxic therapies but responded to cytostatic cell cycle inhibition (right). d, Nomogram for meningioma local freedom from recurrence (LFFR, n=201) integrating clinical features and DNA methylation groups. Variables contribute points (top row), which estimate the probably of 5-year LFFR (bottom rows) (https://william-c-chen.shinyapps.io/RaleighLab_MethylationSubgroupNomogram/).
Figure 6.
Figure 6.. Genetic, epigenetic, and transcriptomic mechanisms distinguishing meningioma DNA methylation groups.
Oncoprint comprised of the 565 meningiomas in this study. CNVs of any size deleting or amplifying entire genes, scaled β methylation values, and scaled transcripts per million (TPM) are shown. The focal versus broad nature of CNVs are described in the Copy number analysis section of the Methods. HLA gain/loss shows the polymorphic locus encompassing HLA-DRB5, HLA-DRB1, HLA-DQA1, and HLA-DQB1. β methylation values and TPM are scaled from the bottom 10th percentile to the top 90th percentile of each row. RNA sequencing was performed on the discovery cohort (n=200) but not on the validation cohort.
Figure 7.
Figure 7.. Molecular, cellular, and clinical features distinguishing meningioma DNA methylation groups.
DNA methylation profiling was performed on 565 meningiomas and integrated with genetic, transcriptomic, biochemical, proteomic, and single-cell approaches to show meningiomas are comprised of 3 DNA methylation groups with distinct clinical outcomes, biological drivers, and therapeutic vulnerabilities. DNA methylation profiling was also performed on 9 meningioma cell lines to define reagents to study biological drivers and therapeutic vulnerabilities underlying meningioma DNA methylation groups.

References

    1. Bi WL et al. Genomic landscape of intracranial meningiomas. Journal of Neurosurgery 125, 525–535 (2016). - PubMed
    1. Vasudevan HN et al. Comprehensive Molecular Profiling Identifies FOXM1 as a Key Transcription Factor for Meningioma Proliferation. Cell Reports 22, 3672–3683 (2018). - PMC - PubMed
    1. Zhou W, Triche TJ, Laird PW & Shen H SeSAMe: reducing artifactual detection of DNA methylation by Infinium BeadChips in genomic deletions. Nucleic Acids Res 46, e123–e123 (2018). - PMC - PubMed
    1. Sahm F et al. DNA methylation-based classification and grading system for meningioma: a multicentre, retrospective analysis. The Lancet Oncology 18, 682–694 (2017). - PubMed
    1. Olar A et al. Global epigenetic profiling identifies methylation subgroups associated with recurrence-free survival in meningioma. Acta Neuropathol 133, 431–444 (2017). - PMC - PubMed

Publication types

Substances