Clinical Trial
. 2022 Jun;28(6):1189-1198.
doi: 10.1038/s41591-022-01800-8. Epub 2022 May 9.

Claudin18.2-specific CAR T cells in gastrointestinal cancers: phase 1 trial interim results

Affiliations
Clinical Trial

Claudin18.2-specific CAR T cells in gastrointestinal cancers: phase 1 trial interim results

Changsong Qi et al. Nat Med. 2022 Jun.

Abstract

Despite success in hematologic malignancies, the treatment landscape of chimeric antigen receptor (CAR) T cell therapy for solid tumors remains limited. Claudin18.2 (CLDN18.2)-redirected CAR T cells showed promising efficacy against gastric cancer (GC) in a preclinical study. Here we report the interim analysis results of an ongoing, open-label, single-arm, phase 1 clinical trial of CLDN18.2-targeted CAR T cells (CT041) in patients with previously treated, CLDN18.2-positive digestive system cancers ( NCT03874897 ). The primary objective was safety after CT041 infusion; secondary objectives included CT041 efficacy, pharmacokinetics and immunogenicity. We treated 37 patients with one of three CT041 doses: 2.5 × 10⁸, 3.75 × 10⁸ or 5.0 × 10⁸ cells. All patients experienced a grade 3 or higher hematologic toxicity. Grade 1 or 2 cytokine release syndrome (CRS) occurred in 94.6% of patients. No grade 3 or higher CRS or neurotoxicities, treatment-related deaths or dose-limiting toxicities were reported. The overall response rate (ORR) and disease control rate (DCR) reached 48.6% and 73.0%, respectively. The 6-month duration of response rate was 44.8%. In patients with GC, the ORR and DCR reached 57.1% and 75.0%, respectively, and the 6-month overall survival rate was 81.2%. These initial results suggest that CT041 has promising efficacy with an acceptable safety profile in patients with heavily pretreated, CLDN18.2-positive digestive system cancers, particularly in those with GC.


Conflict of interest statement

The authors declare no competing interests.

Figures

Fig. 1
Fig. 1. Objective responses, durations of response and representative tumor complete response images.
a, Change in tumor size after CT041 in the 36 patients with target lesions. b, Best responses of each patient assessed according to RECIST 1.1 by the investigator, grouped by dose. c, Tumor lesion of the umbilicus in Pt08 disappeared after CT041 infusion as visualized by CT scans and photography. W, week.
Fig. 2
Fig. 2. Correlation of CAR T cell expansion with dose, infusion cycle, response and type of tumor.
a, CAR copies as measured by vector transgene copies per microgram of genomic DNA in peripheral blood, according to dose group. LLOQ, lower limit of quantitation. b, CAR copy numbers after first and second infusions. Bold lines: polynomial regression lines using the LOESS method. c, The correlation between peak vector transgene copies per microgram of gDNA after the first infusion and the occurrence of tumor response. Patients with response, n = 18; patients with non-response, n = 19. Horizontal lines and boxes show the medians and interquartile ranges (IQRs), respectively. Whiskers show the minimum observation above the lower fence (1.5 IQR below the 25th percentile) and the maximum observation below the upper fence (1.5 IQR above the 75th percentile). The P value was based on a two-sided Wilcoxon rank-sum test. d, PFS curves were estimated by the Kaplan–Meier method. n = 37 patients infused with CT041 who completed 12 weeks of follow-up visits for all panels. NE, not estimable.
Fig. 3
Fig. 3. Correlations between T cell subsets in CT041 and clinical activity in patients with GC.
a,b, Forest plots showing Cox regression analysis of the effect of T cell subsets on PFS and OS. a, Univariate analysis between PFS and infused subset cell numbers—product characteristics. b, Univariate analysis between OS and infused subset cell numbers—product characteristics. Dots and bars show the hazard ratios and 95% CIs for each T cell subset, respectively; P values were calculated using the Cox regression model, for n = 28 patients with GC. Logistic regression analyses were performed to determine the correlation among the frequencies of CD3+CD4+CD8 (Th) cells (c), CD3+CD4CD8+ (CTLs) (d), CD45RA+/CCR7+ (naive T) cells (e), CD45RA/CCR7+ (central memory T) cells (f), CD45RA/CCR7(effector memory T) cells (g) or CD45RA+/CCR7(terminally differentiated effector T) cells (h) in CT041 product to probability of response. CT041 was evaluated before infusion. Shaded bands show the 95% CIs of predicted probability, and lines present the predicted probability of response from logistic regression analyses with nominal P values (that is, without adjustment for multiplicity), for n = 28 patients with GC.
Extended Data Fig. 1
Extended Data Fig. 1. Study flow diagram and procedure schema.
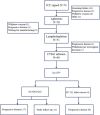
a, Two-phase study design: a dose escalation/de-escalation phase and a dose-expansion phase to determine the recommended phase II dose (RP2D). b, Schema of study procedure. DLT, dose-limiting toxicity; ECOG, Eastern Cooperative Oncology Group performance status.
Extended Data Fig. 2
Extended Data Fig. 2. CONSORT Diagram.
GC/GEJ, gastric/gastroesophageal junction cancer; PC, pancreatic cancer. * Data are from the first 37 patients who were treated with CT041 and completed at least 12 weeks of follow-up as of the data cutoff date, 08 April 2021.
Extended Data Fig. 3
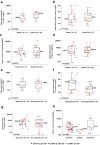
Extended Data Fig. 3. Serum biomarker peak values by tumor response and grade of cytokine release syndrome (CRS) in all patients.
Relationship between a, post-infusion ferritin peak and CRS grade; b, post-infusion C-reactive protein (CRP) peak and CRS grade; c, maximum concentration (Cmax) of CAR-CLDN18.2 in peripheral blood and CRS grade; d, post-infusion IL-6 peak and CRS grade; e, post-infusion ferritin peak and treatment response; f, post-infusion CRP peak and treatment response; g, post-infusion IL-6 peak and treatment response. The p-values were calculated using the two-sided Wilcoxon rank sum test: h, The relationship between Cmax and different cancer types. The horizontal lines and the boxes show the medians and interquartile ranges (IQR), respectively. Whiskers show the minimum observation above the lower fence (1.5 IQR below the 25th percentile) and the maximum observation below upper fence (1.5 IQR above the 75th percentile). The p-values were calculated using the Kruskal-Wallis (KW) test for N = 37 patients who were treated with CT041 and completed at least 12 weeks follow-up as of the data cutoff date, 08 April 2021. GC, gastric cancer; PC, pancreatic cancer.
Extended Data Fig. 4
Extended Data Fig. 4. Spider plot of clinical responses.
Changes in tumor size over time after CT041 infusion in the 36 patients with measurable target lesions. Solid lines indicate patients who achieved a best response of partial response or better; dashed lines indicate patients who achieved a best response of stable disease or progressive disease.
Extended Data Fig. 5
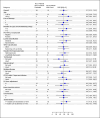
Extended Data Fig. 5. Subgroup analysis of objective response in GC patients.
The objective response analysis according to key baseline and clinical covariates. The Clopper-Pearson method was used to calculate the 95% confidence interval (not adjusted for multiplicity). Squares and bars represent the ORRs and 95% CIs for each subgroup, respectively. The vertical dashed line indicates the point estimation of ORR (57%) in 28 patients with GC.
Extended Data Fig. 6
Extended Data Fig. 6. Distribution of CT041 in bodily fluids in specific patients.
The distribution of CT041 for a, Pt 08, b, Pt 06, c, Pt 04 and d, Pt 23 in peripheral blood, pleural effusion, peritoneal effusion, or bile. CT041 distribution in terms of CAR-CLDN18.2 vector copies was detected by qPCR.
Extended Data Fig. 7
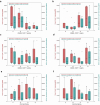
Extended Data Fig. 7. Correlation between frequencies of T-cell subsets and Cmax or AUClast of CAR copies after first infusion in GC patients.
Logistic regression analysis of Cmax or AUClast of CAR copies after first infusion and the frequencies of, a, CD45RA + /CCR7- (terminally differentiated effector T) cells, b, CD45RA-/CCR7 + (central memory T) cells, c, CD45RA + /CCR7 + (naive T) cells, d,CD45RA-/CCR7- (effector memory T) cells, e, CD3 + CD4 + CD8 (Th) cells, or f, CD3 + CD4CD8 + (cytotoxic T lymphocytes) cells in CT041 product.

Comment in

  • CAR T cells show activity.
    Romero D. Romero D. Nat Rev Clin Oncol. 2022 Jul;19(7):427. doi: 10.1038/s41571-022-00648-8. Nat Rev Clin Oncol. 2022. PMID: 35606415 No abstract available.

References

    1. Maude, S. L. et al. Tisagenlecleucel in children and young adults with B-cell lymphoblastic leukemia. N. Engl. J. Med.378, 439–448 (2018). - PMC - PubMed
    1. Neelapu, S. S., Locke, F. L. & Go, W. Y. CAR T-cell therapy in large B-cell lymphoma. N. Engl. J. Med.378, 1065 (2018). - PubMed
    1. Schuster, S. J. et al. Tisagenlecleucel in adult relapsed or refractory diffuse large B-cell lymphoma. N. Engl. J. Med.380, 45–56 (2019). - PubMed
    1. Munshi, N. C. et al. Idecabtagene vicleucel in relapsed and refractory multiple myeloma. N. Engl. J. Med.384, 705–716 (2021). - PubMed
    1. Guo, Y. et al. Phase I study of chimeric antigen receptor-modified T cells in patients with EGFR-positive advanced biliary tract cancers. Clin. Cancer Res.24, 1277–1286 (2018). - PubMed

Publication types

Associated data