. 2022 Jul;6(7):819-829.
doi: 10.1038/s41551-022-00888-0. Epub 2022 May 9.

Masking the immunotoxicity of interleukin-12 by fusing it with a domain of its receptor via a tumour-protease-cleavable linker

Affiliations

Masking the immunotoxicity of interleukin-12 by fusing it with a domain of its receptor via a tumour-protease-cleavable linker

Aslan Mansurov et al. Nat Biomed Eng. 2022 Jul.

Abstract

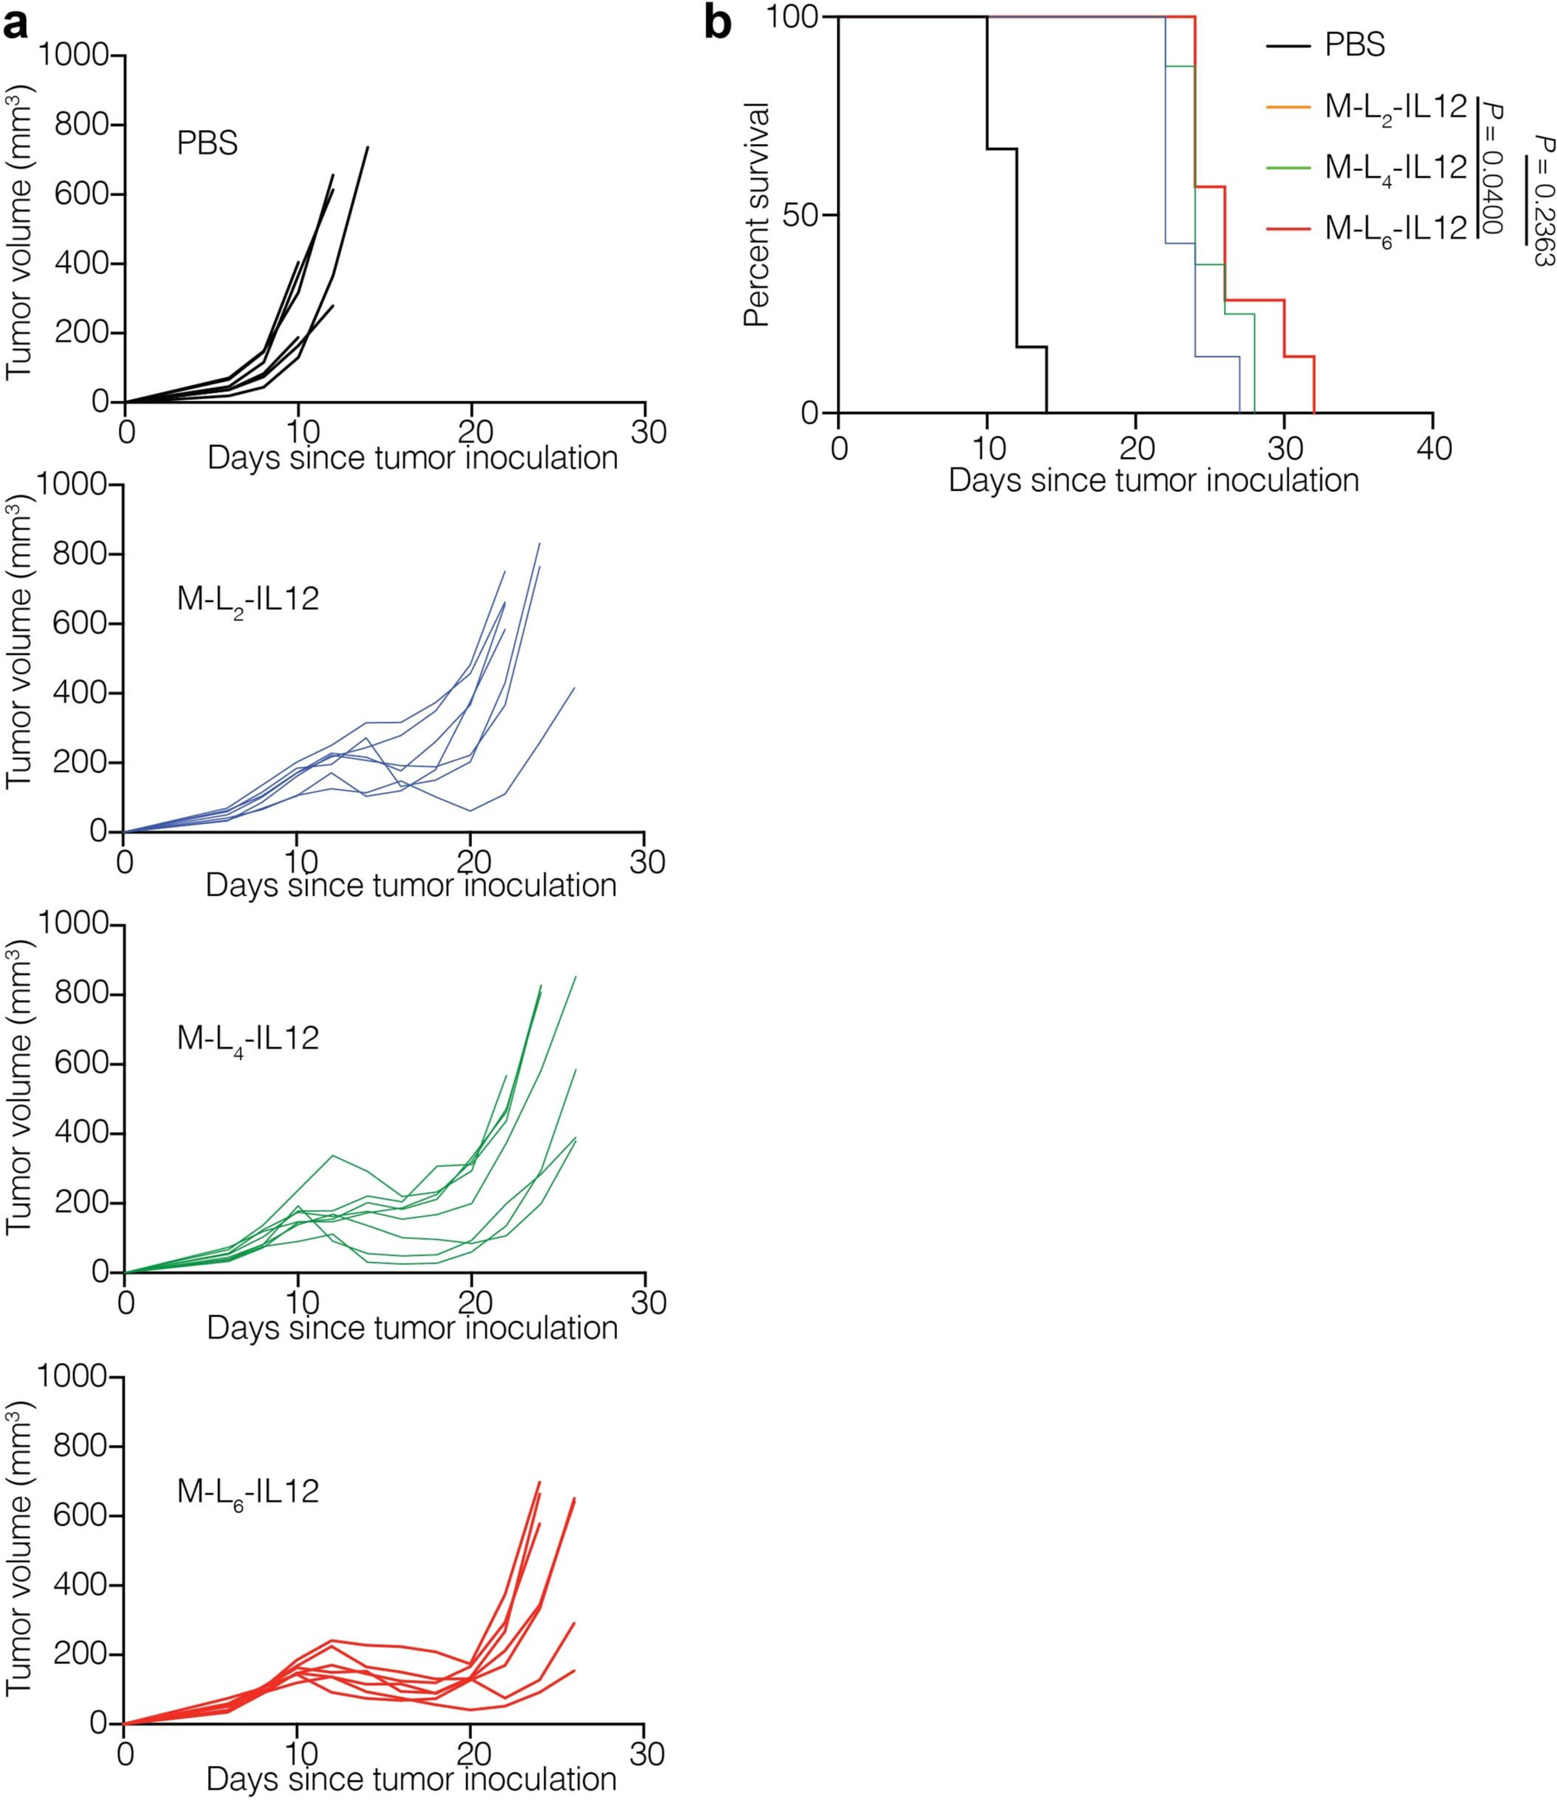
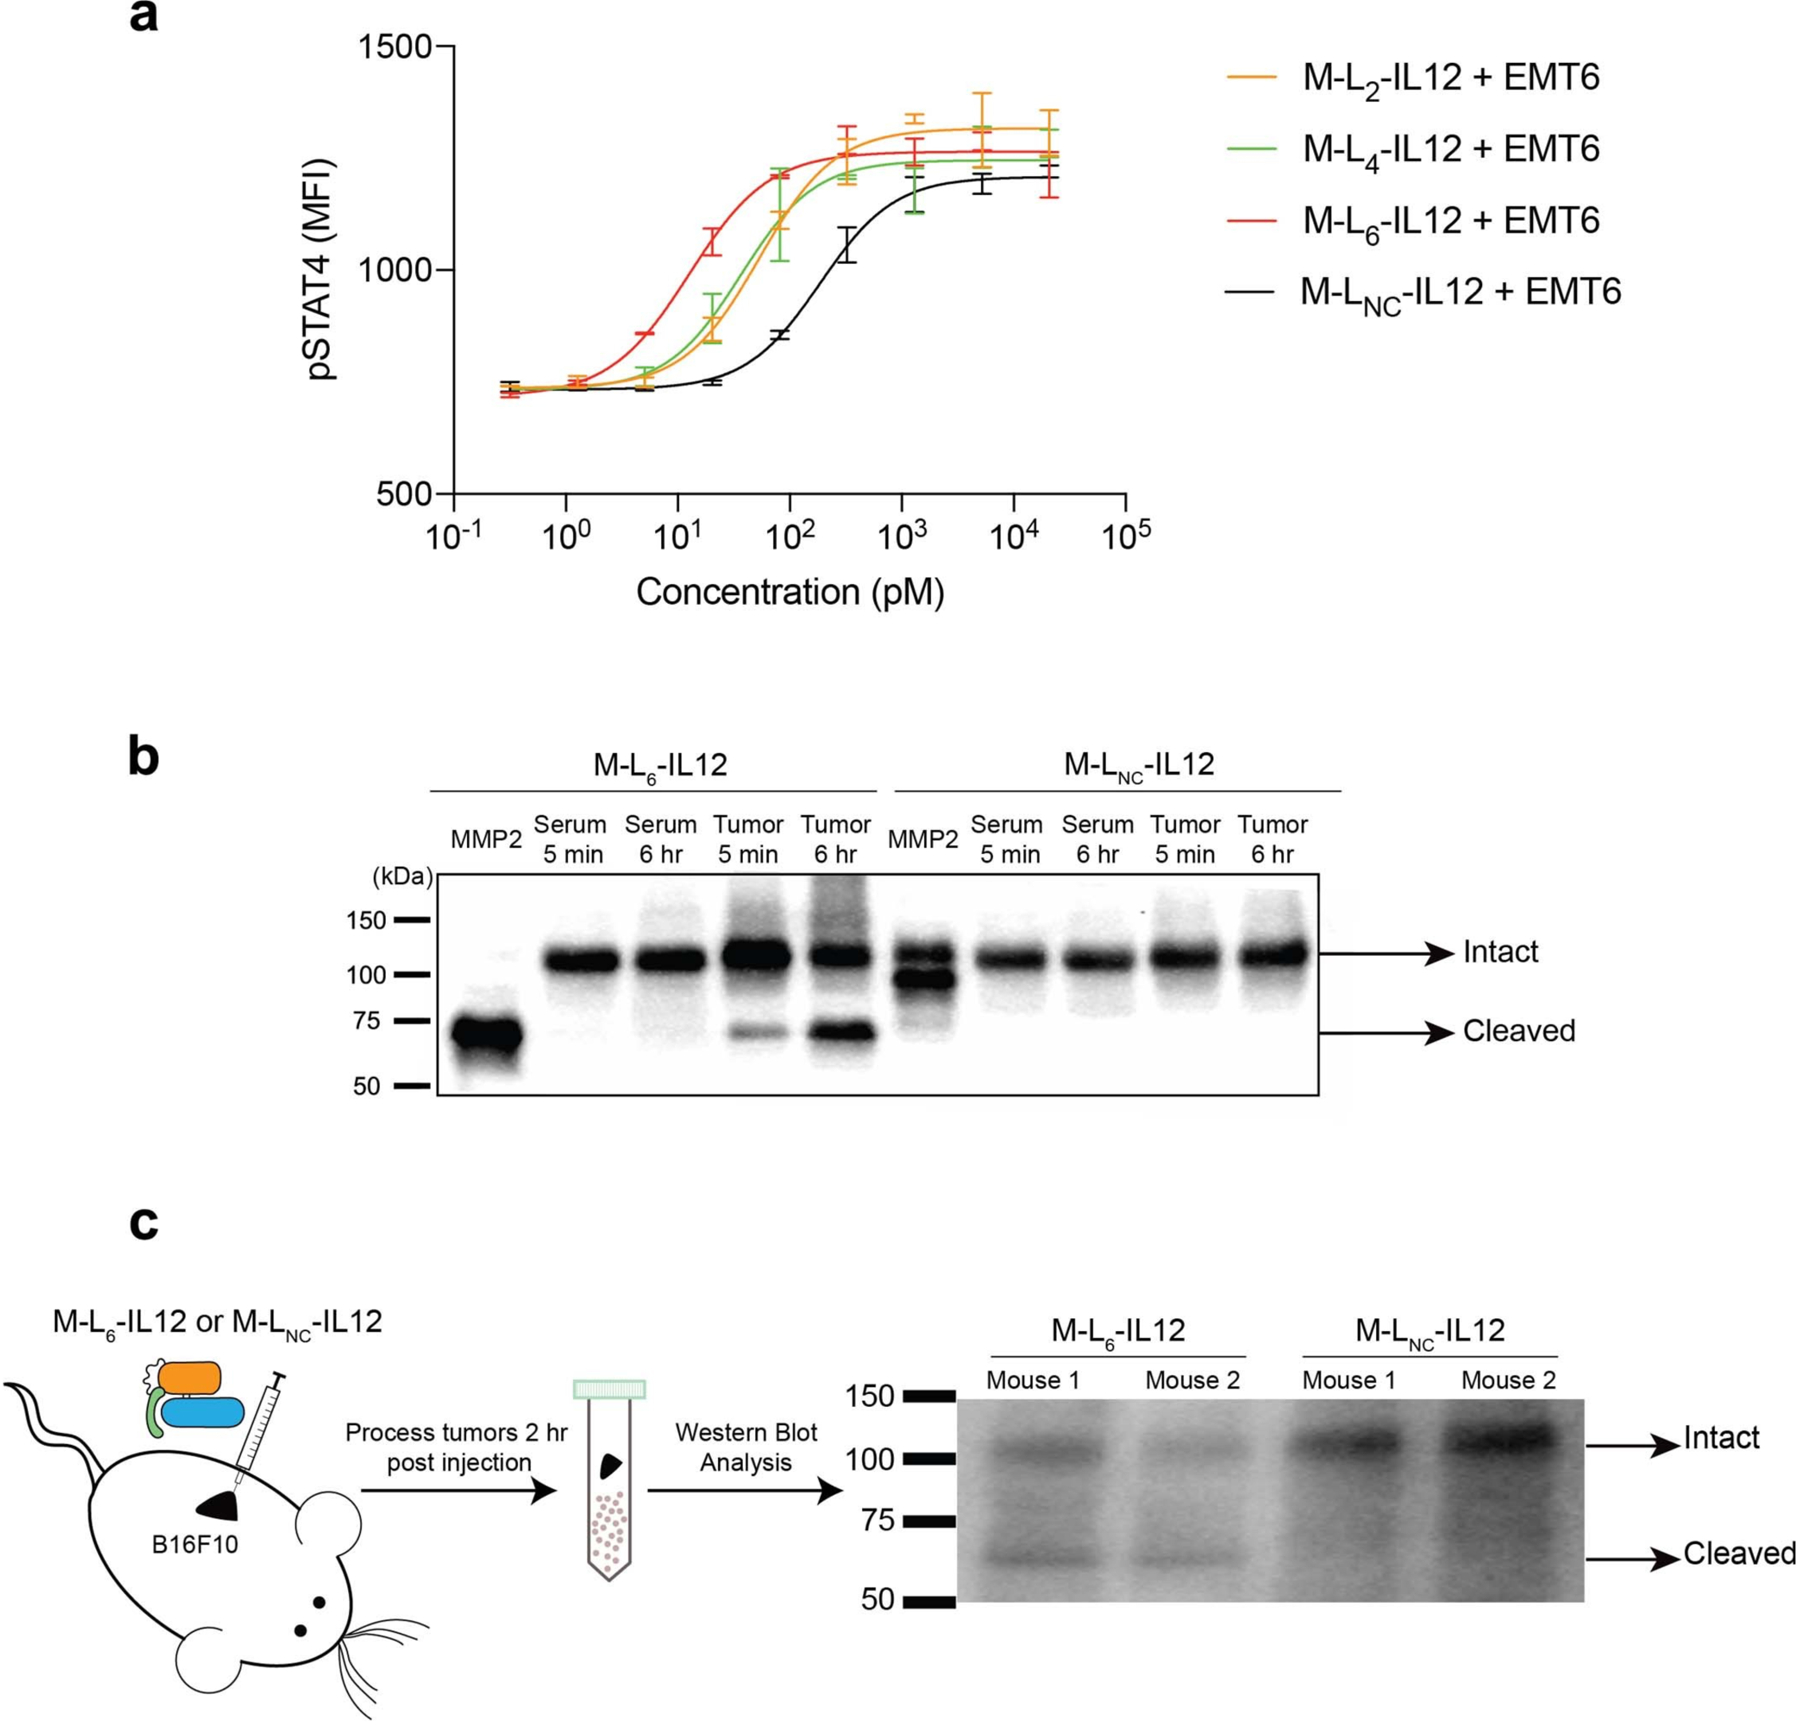
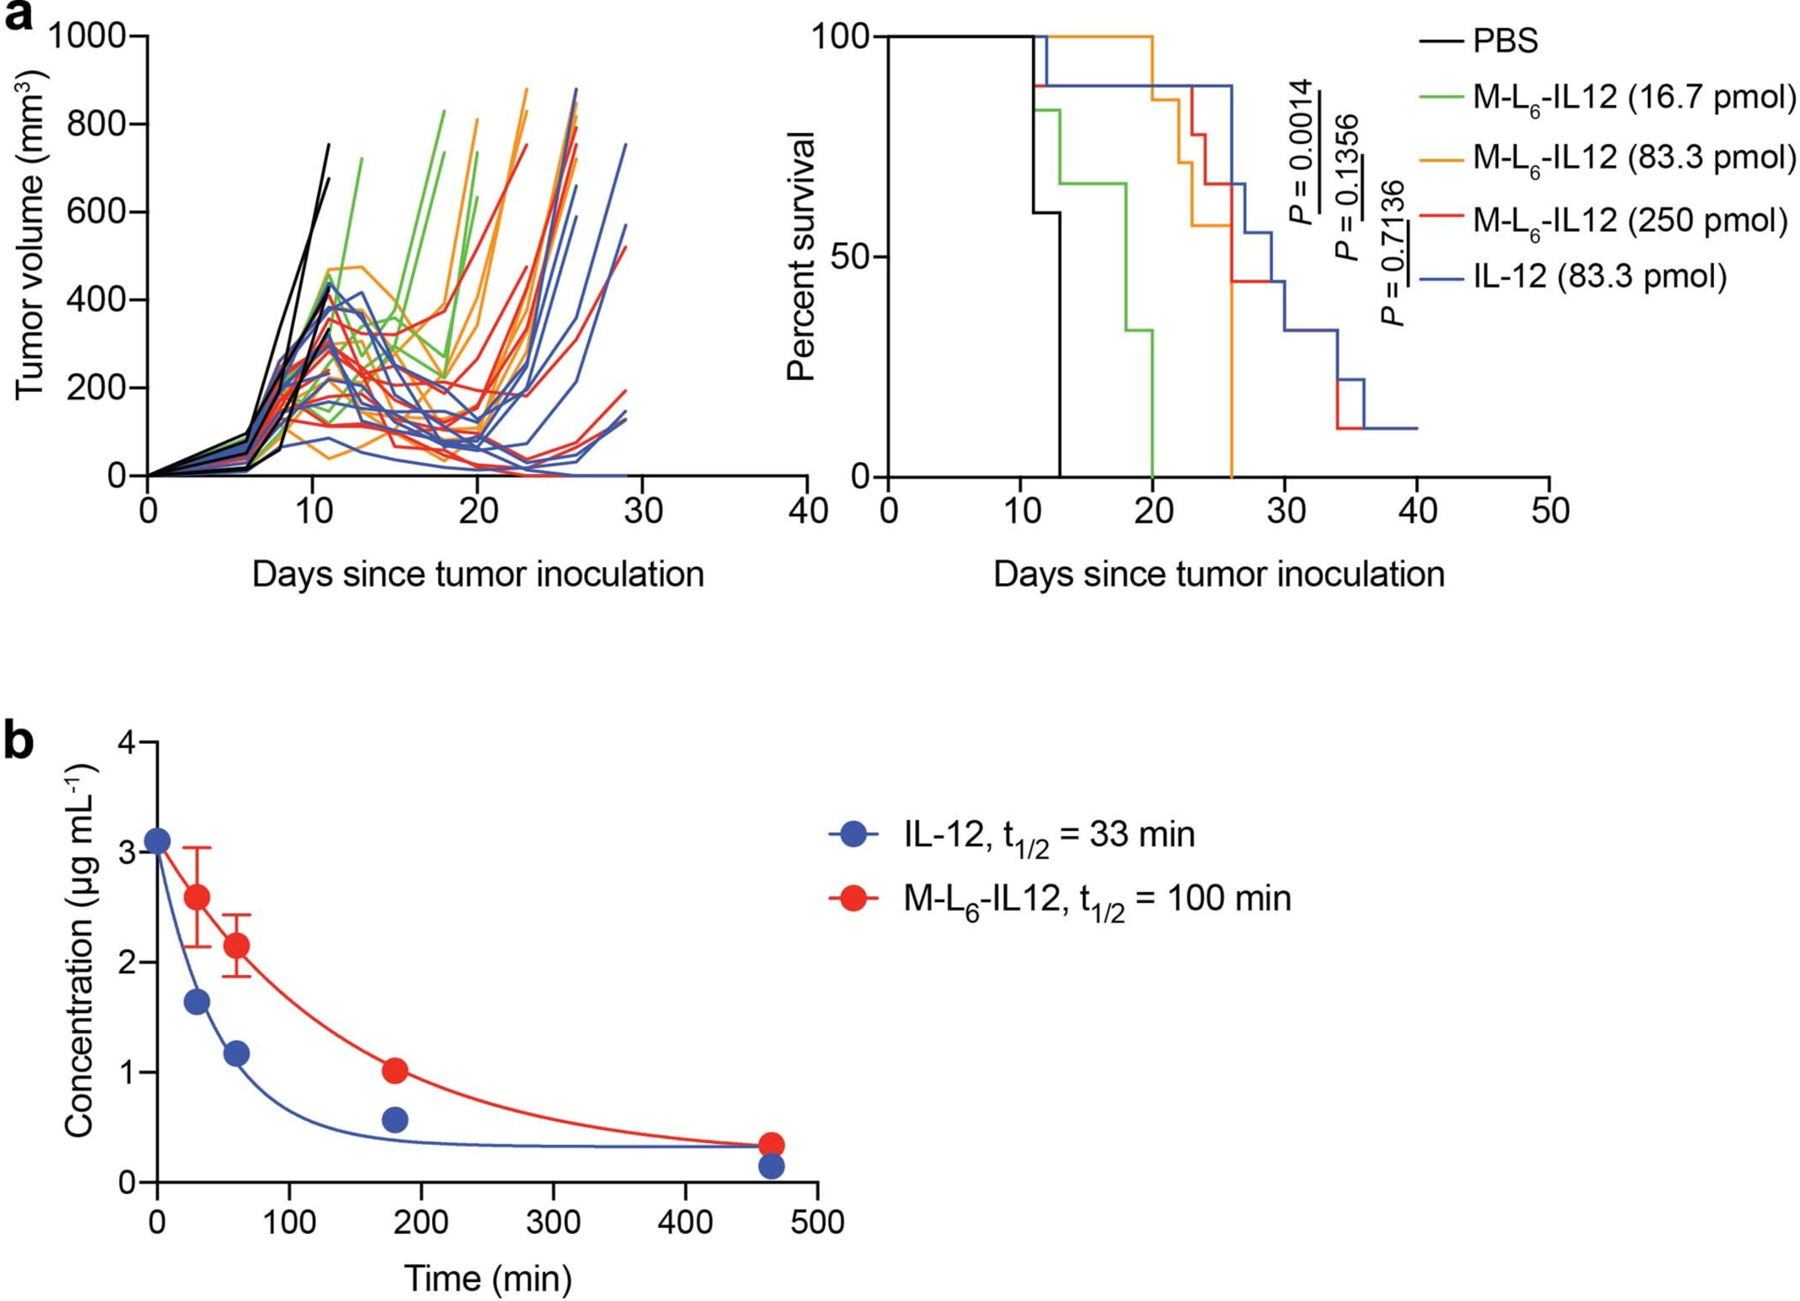
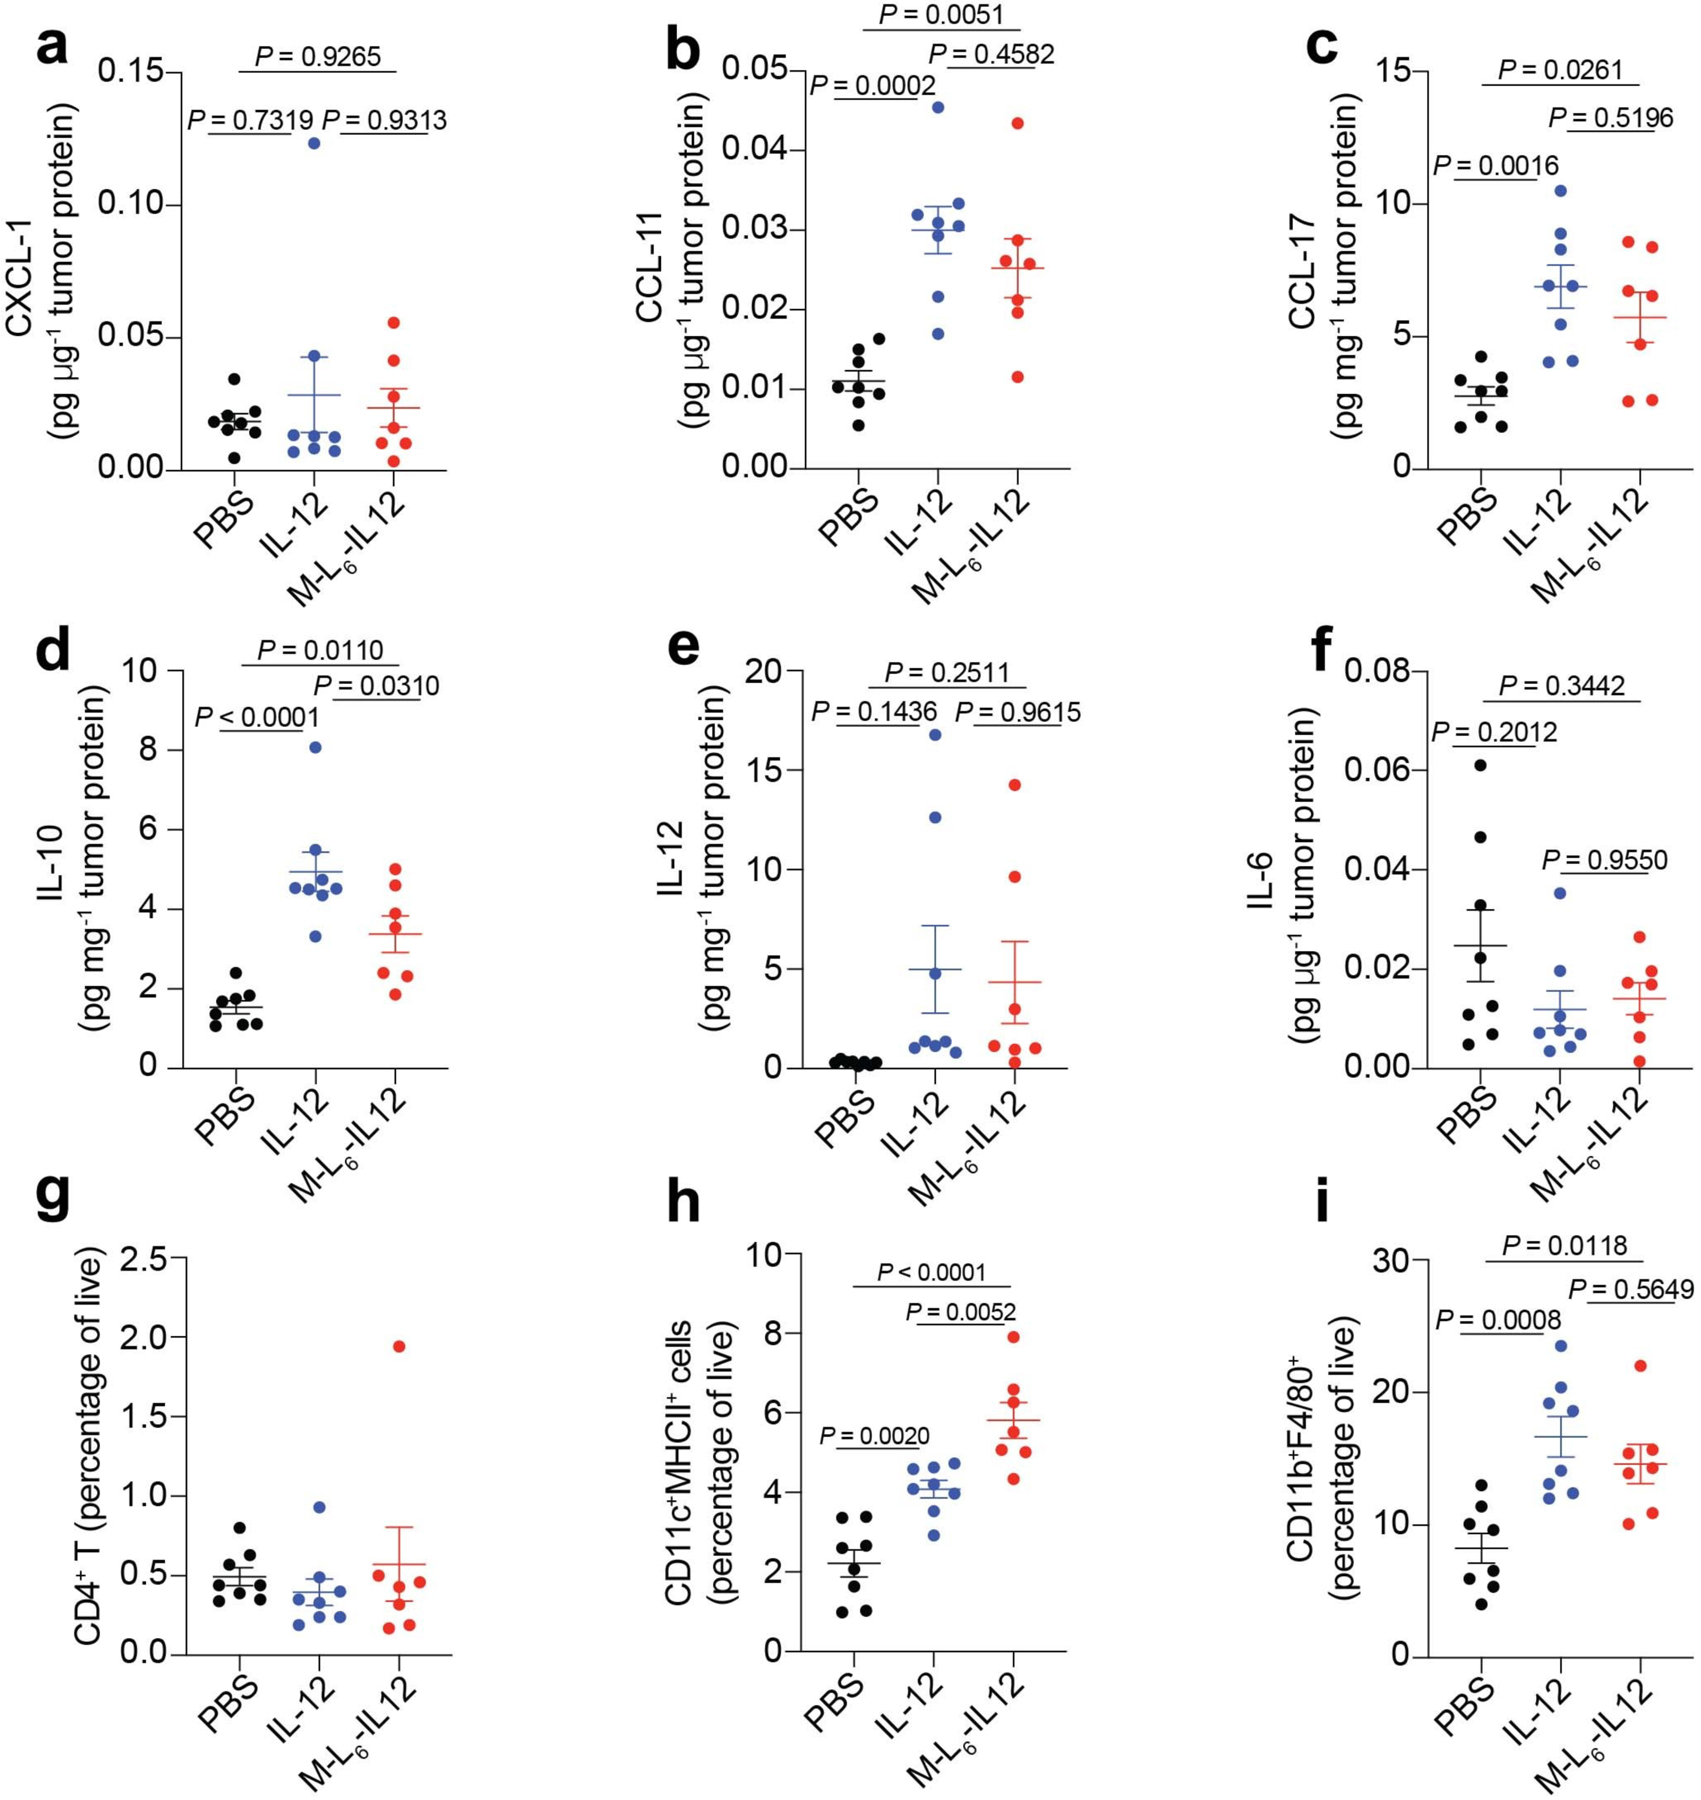
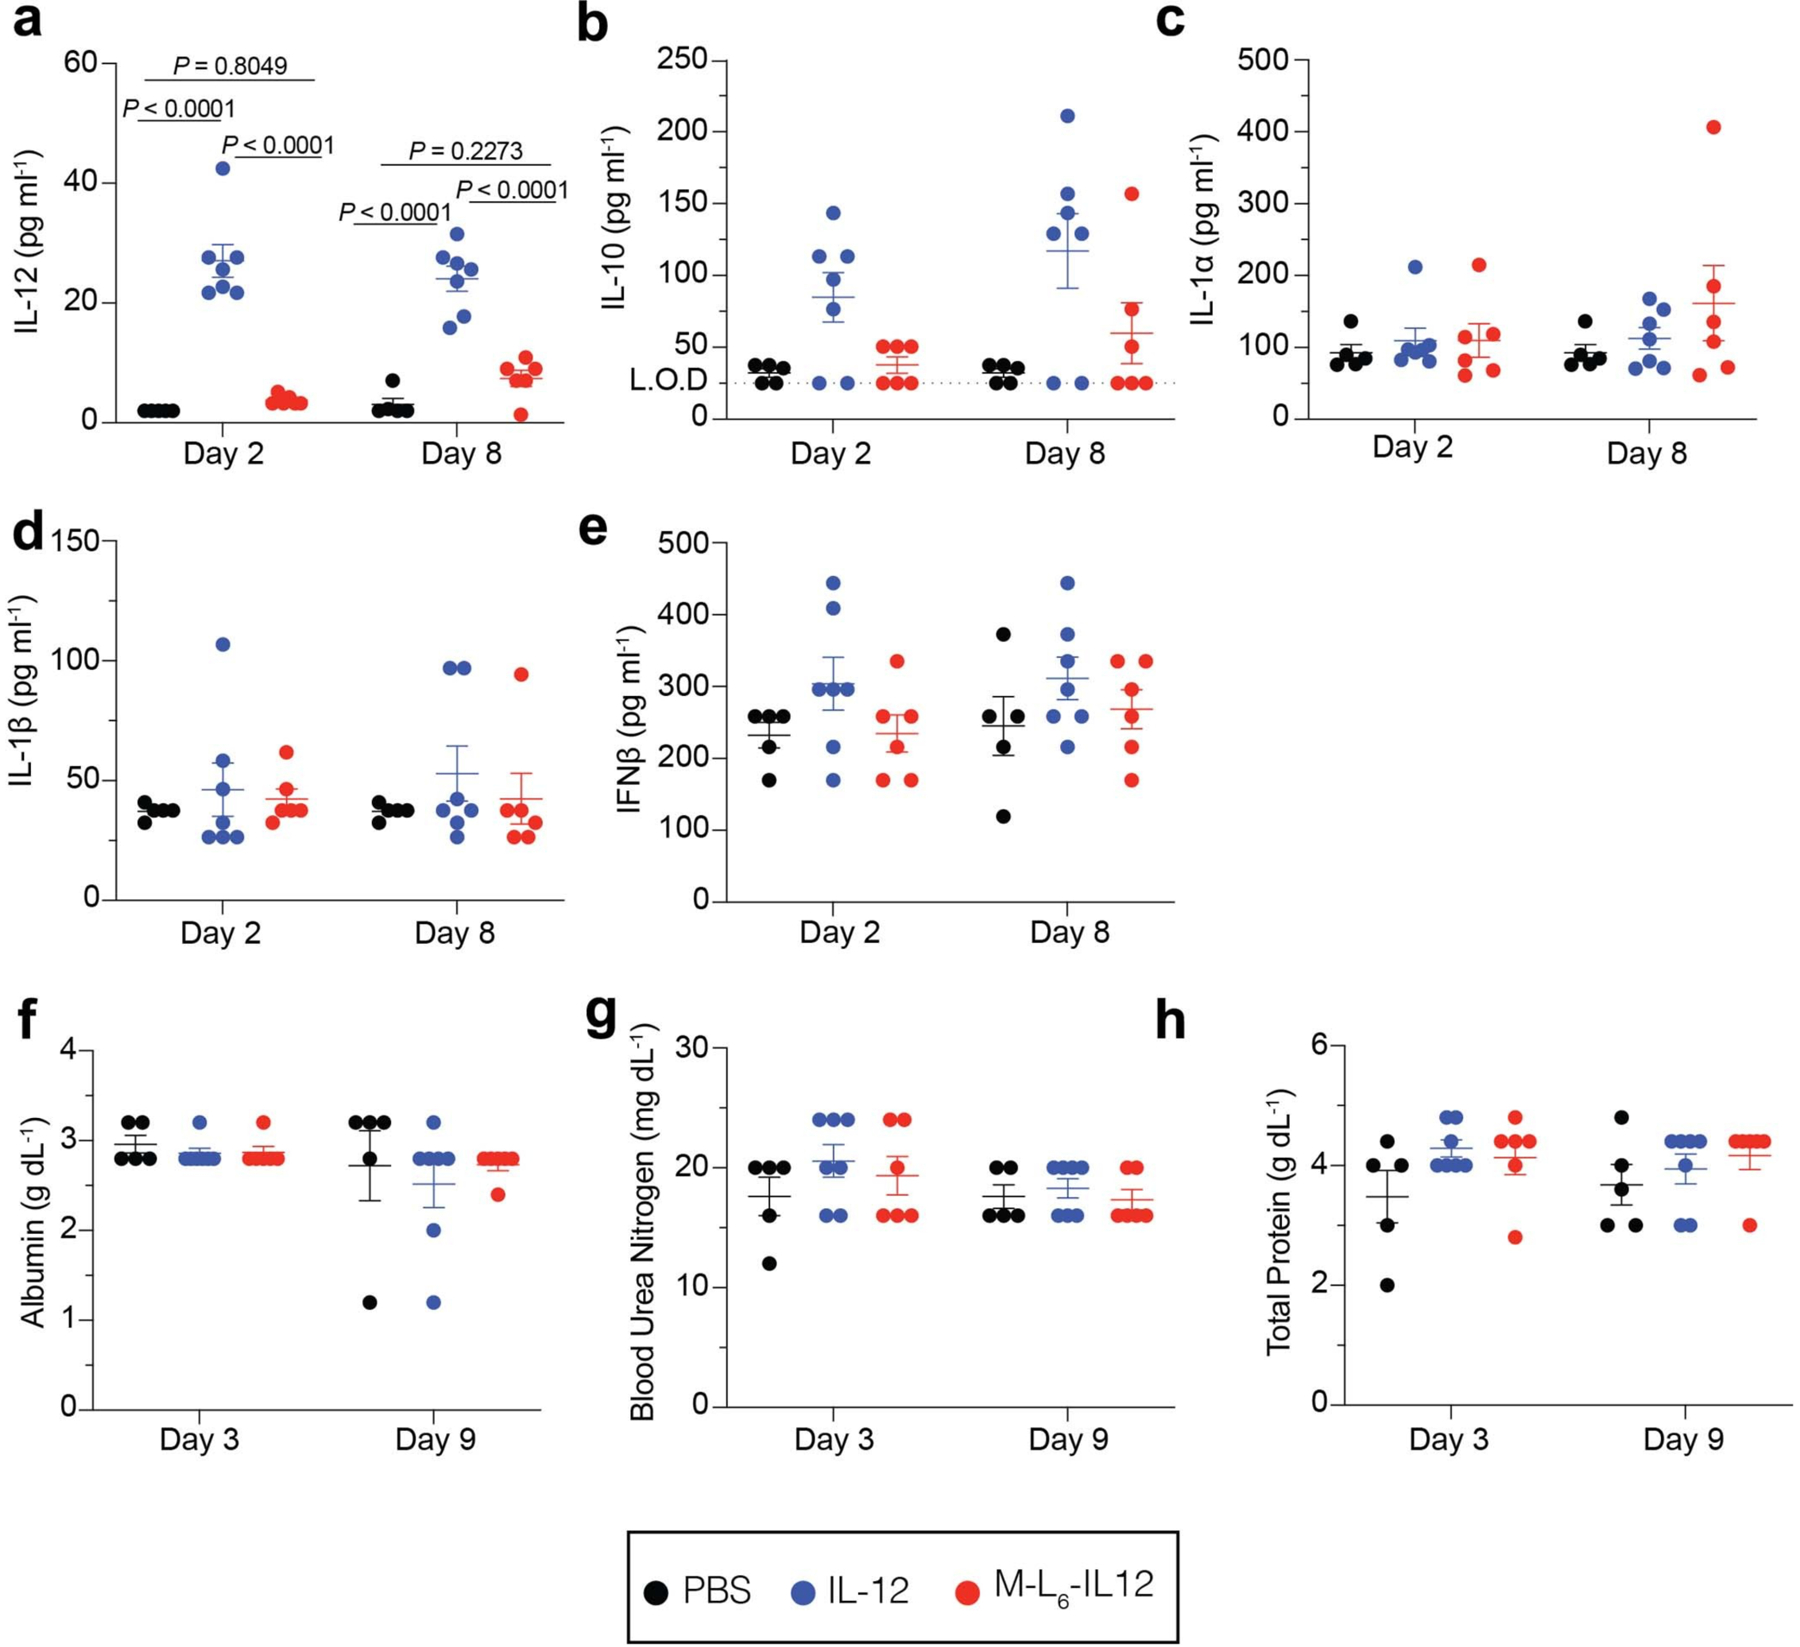
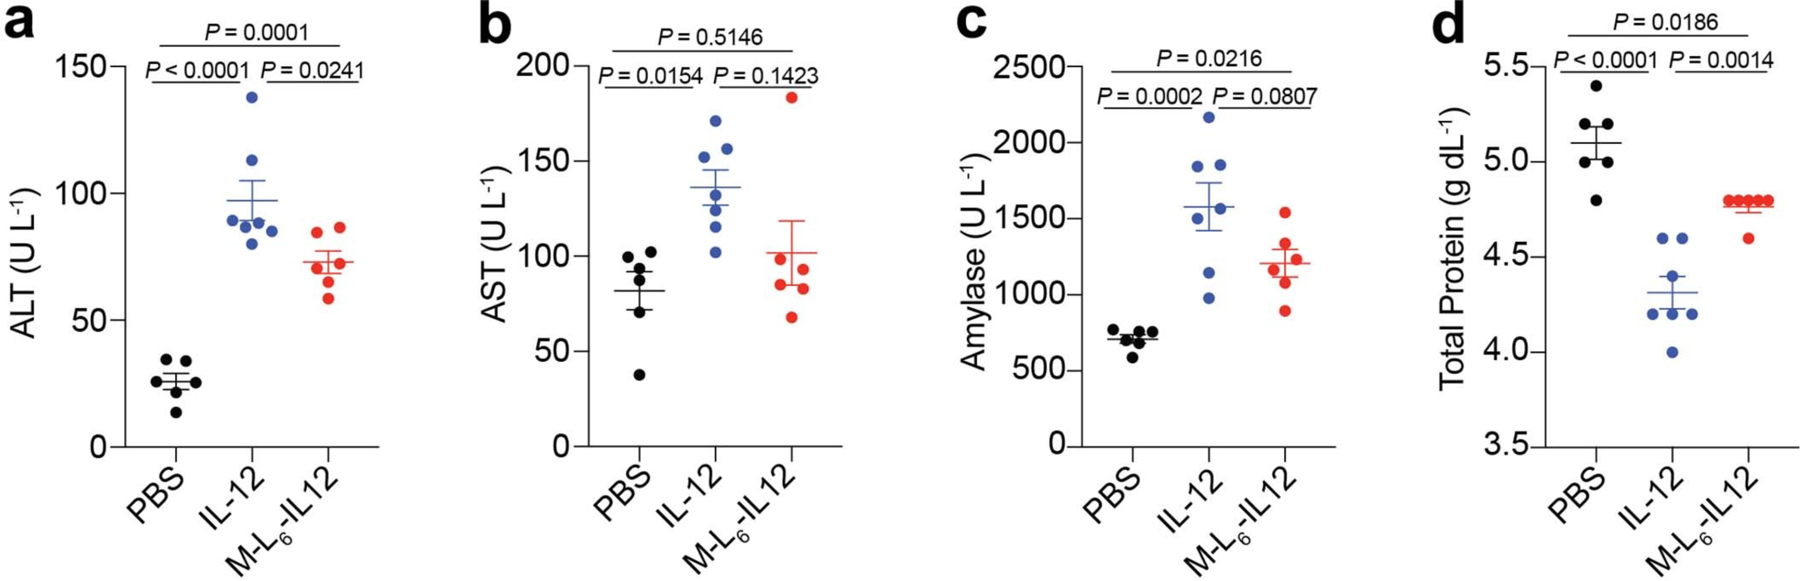
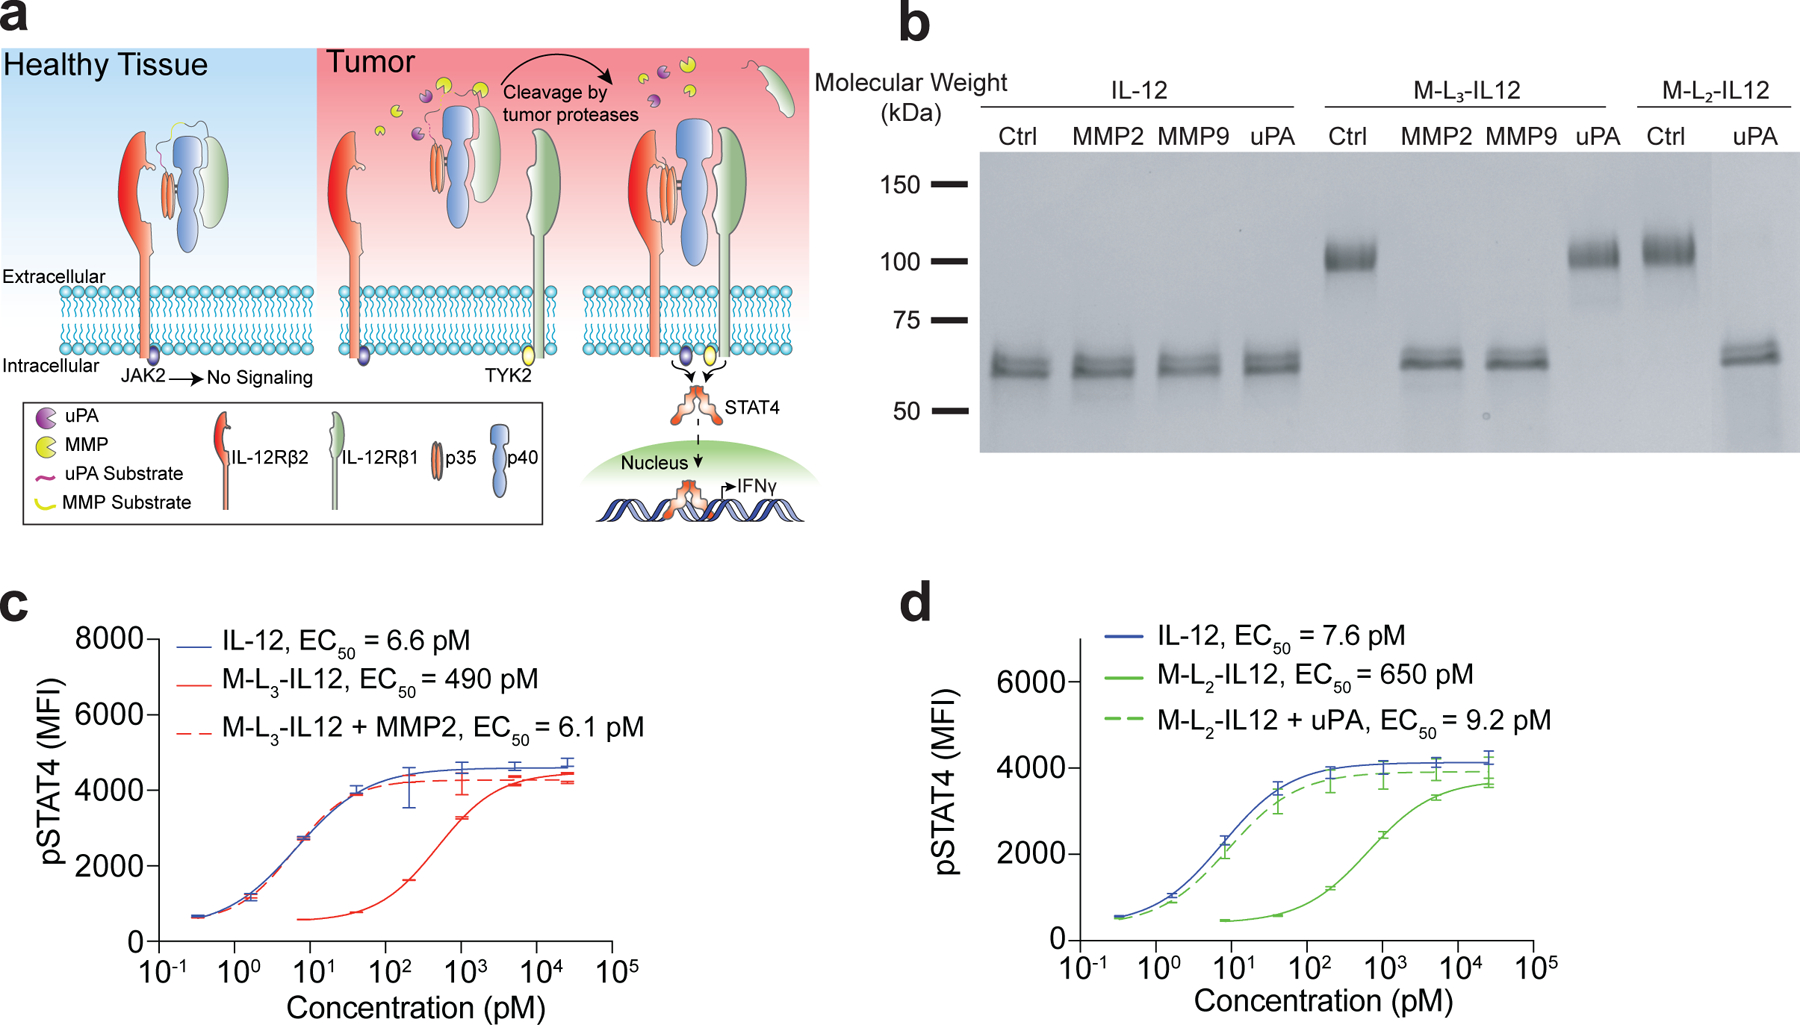
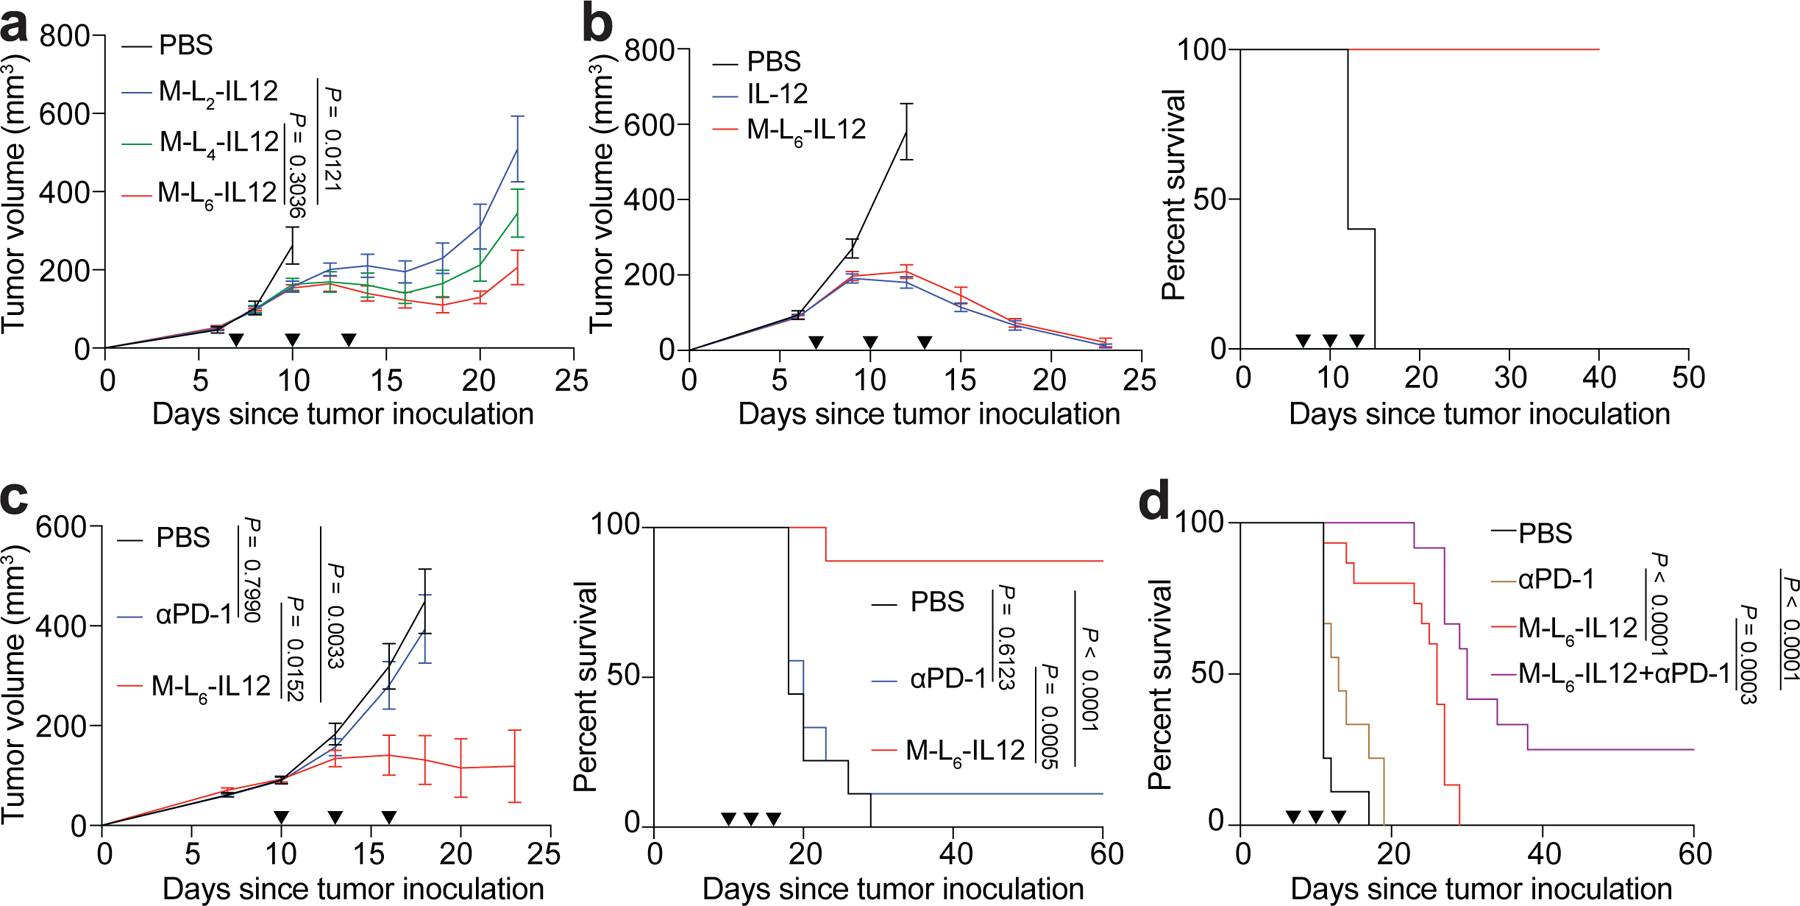
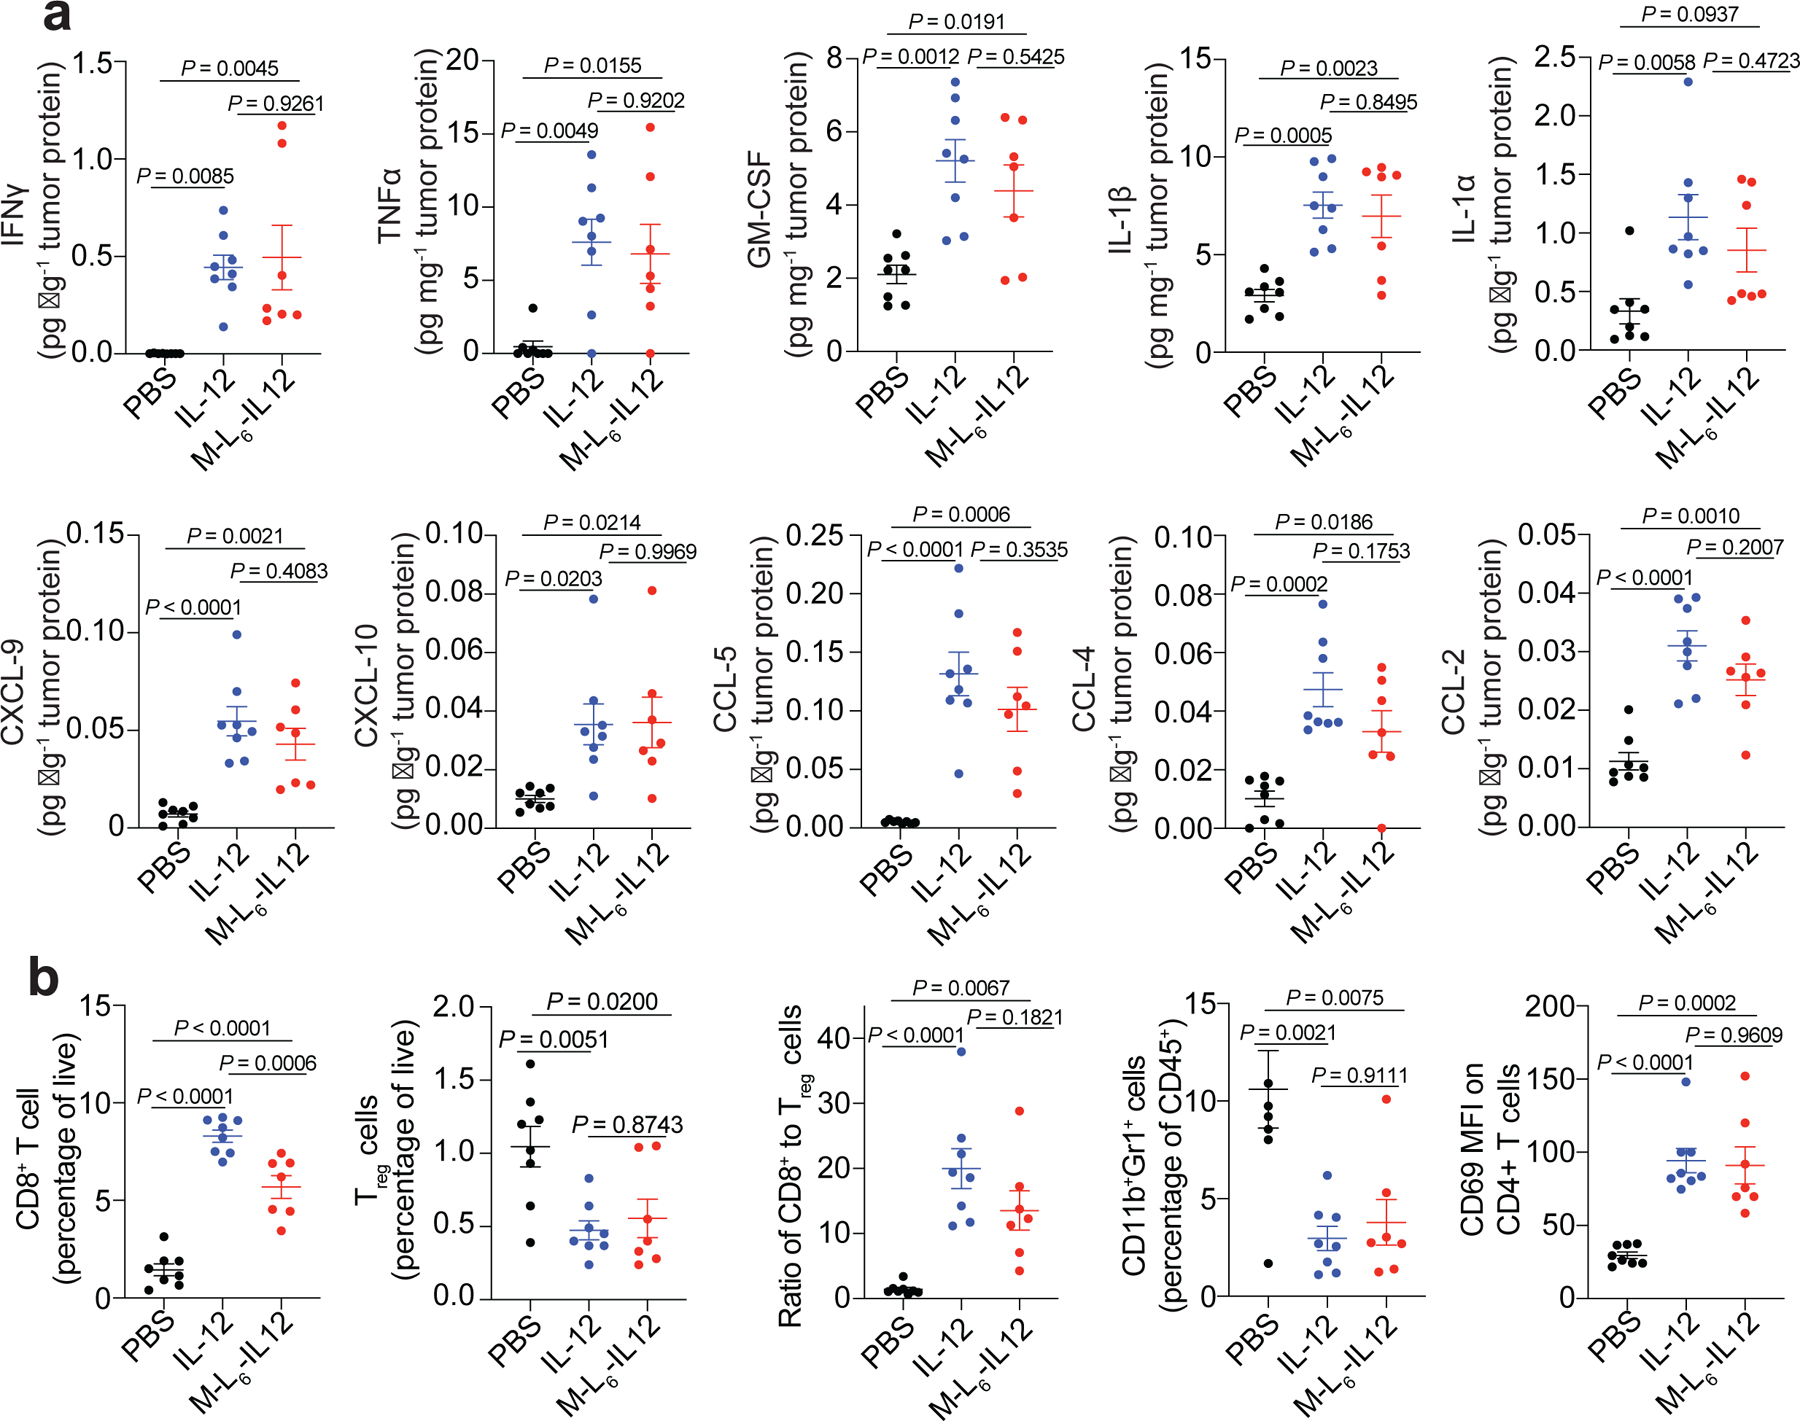
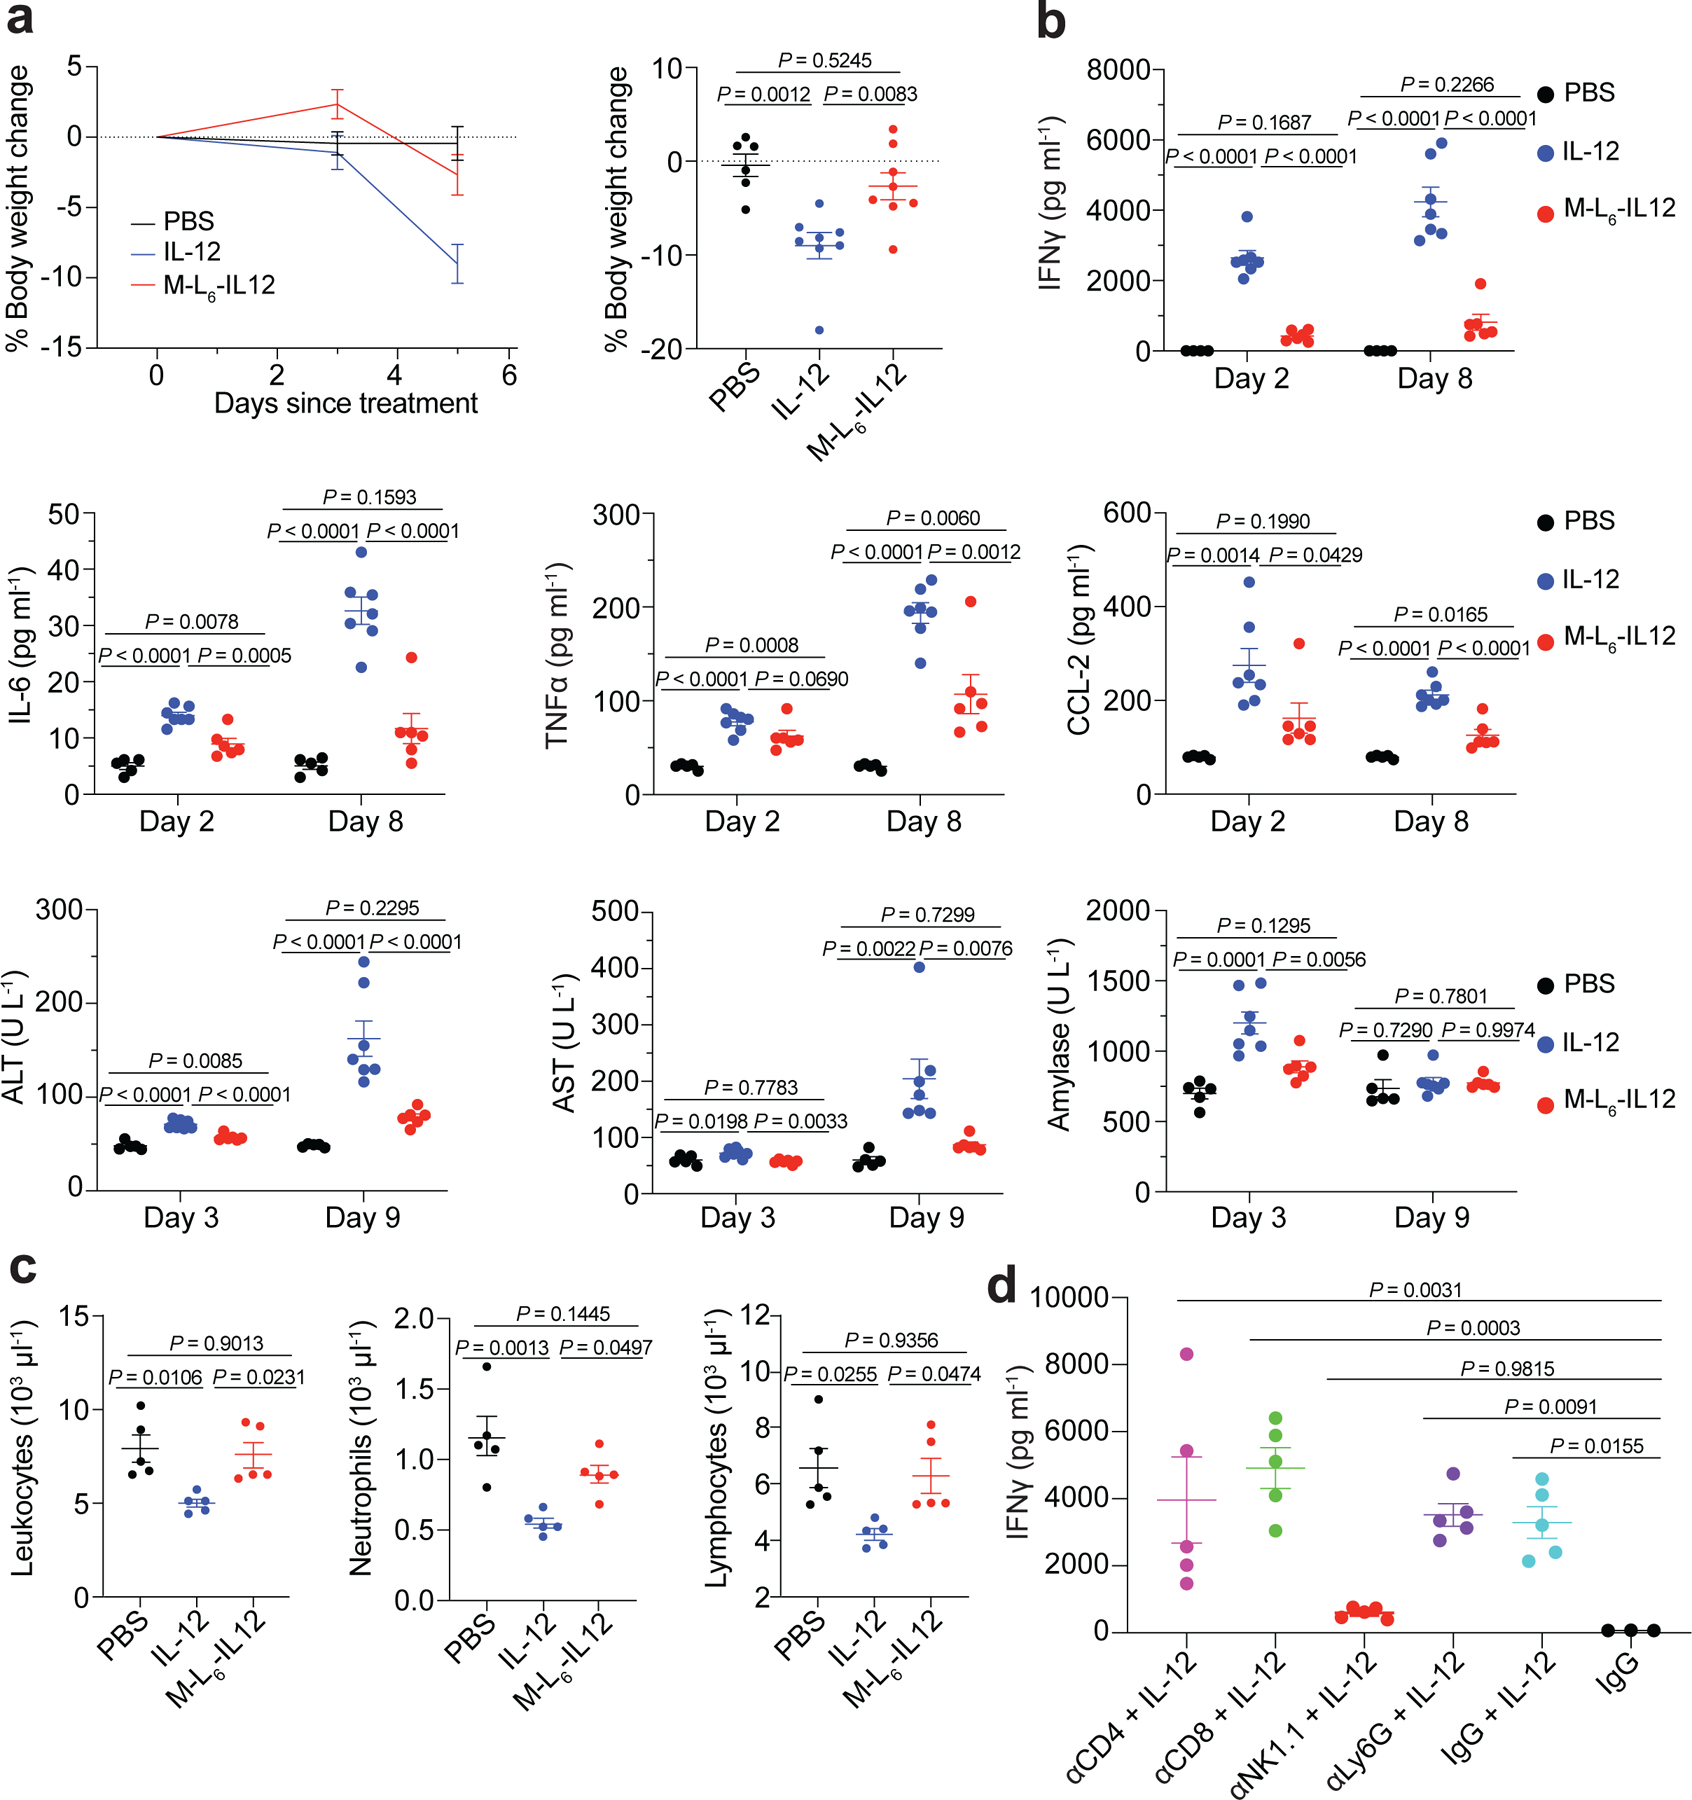
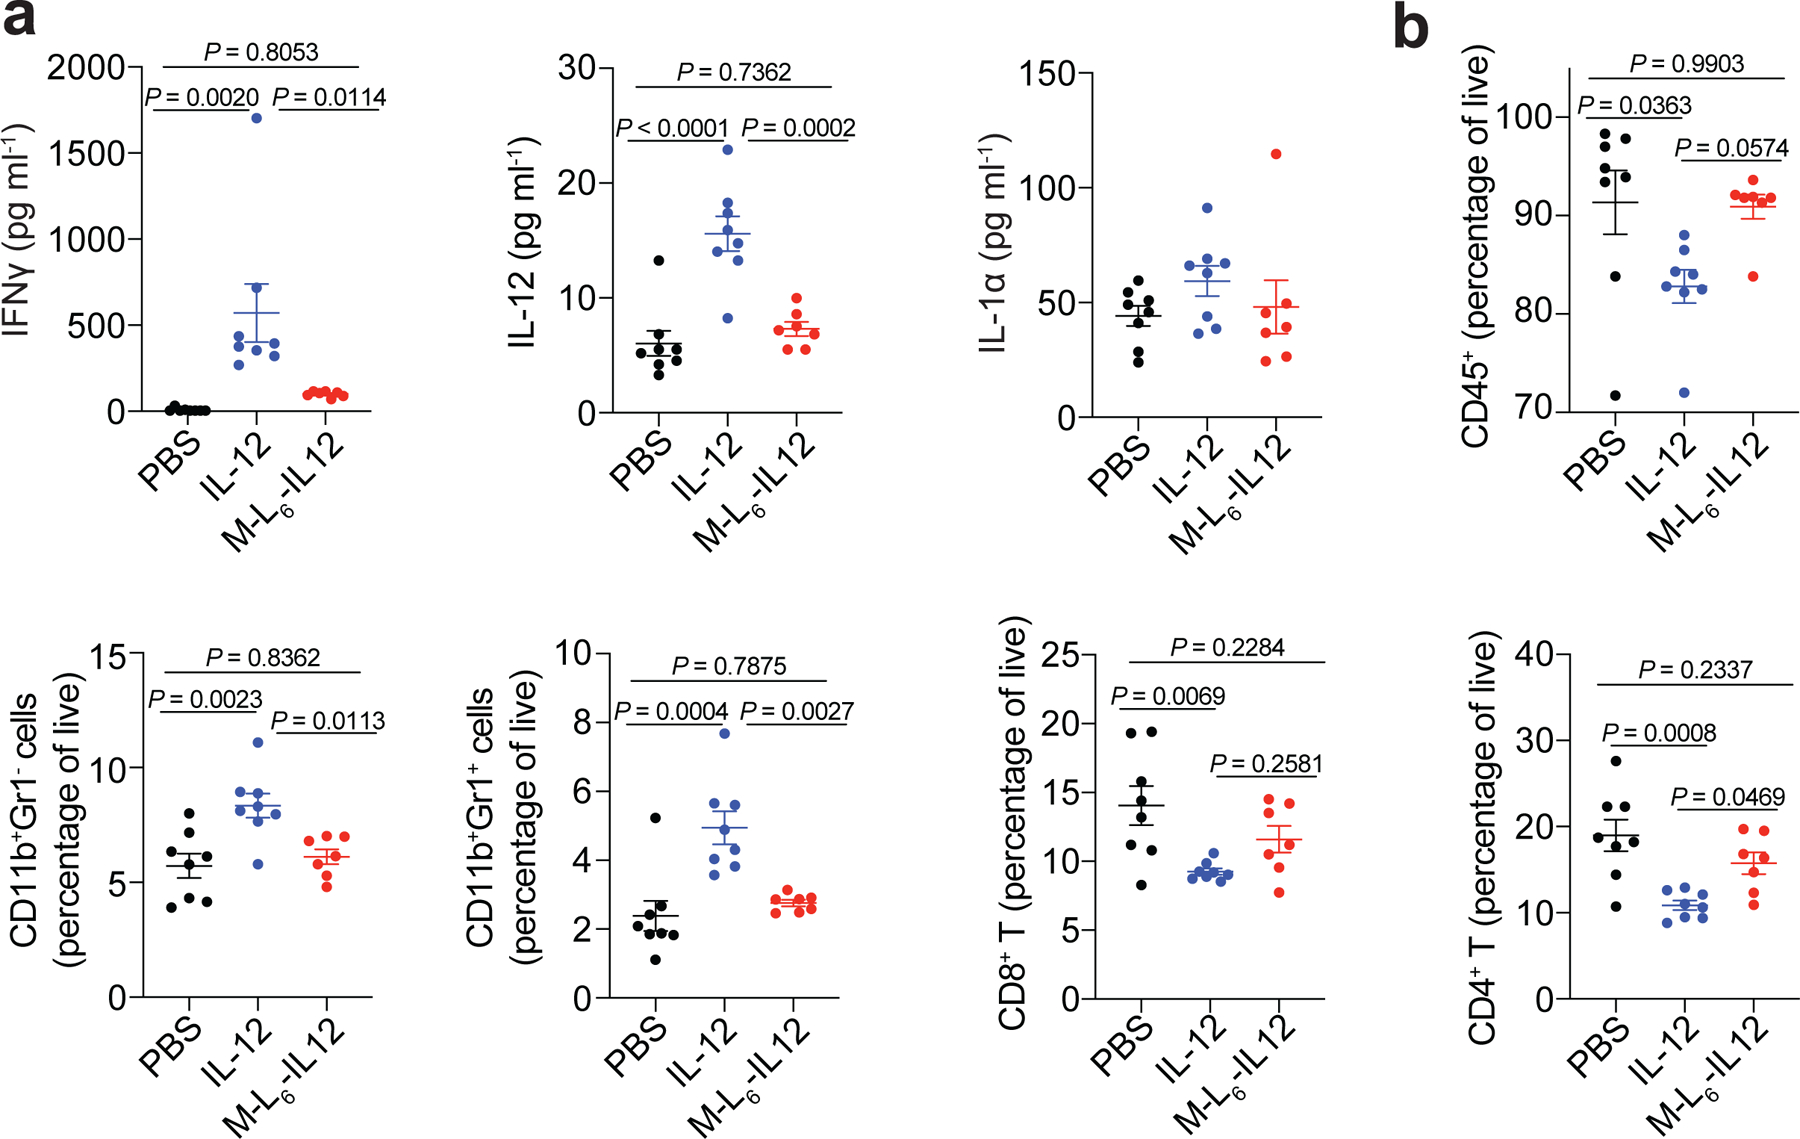
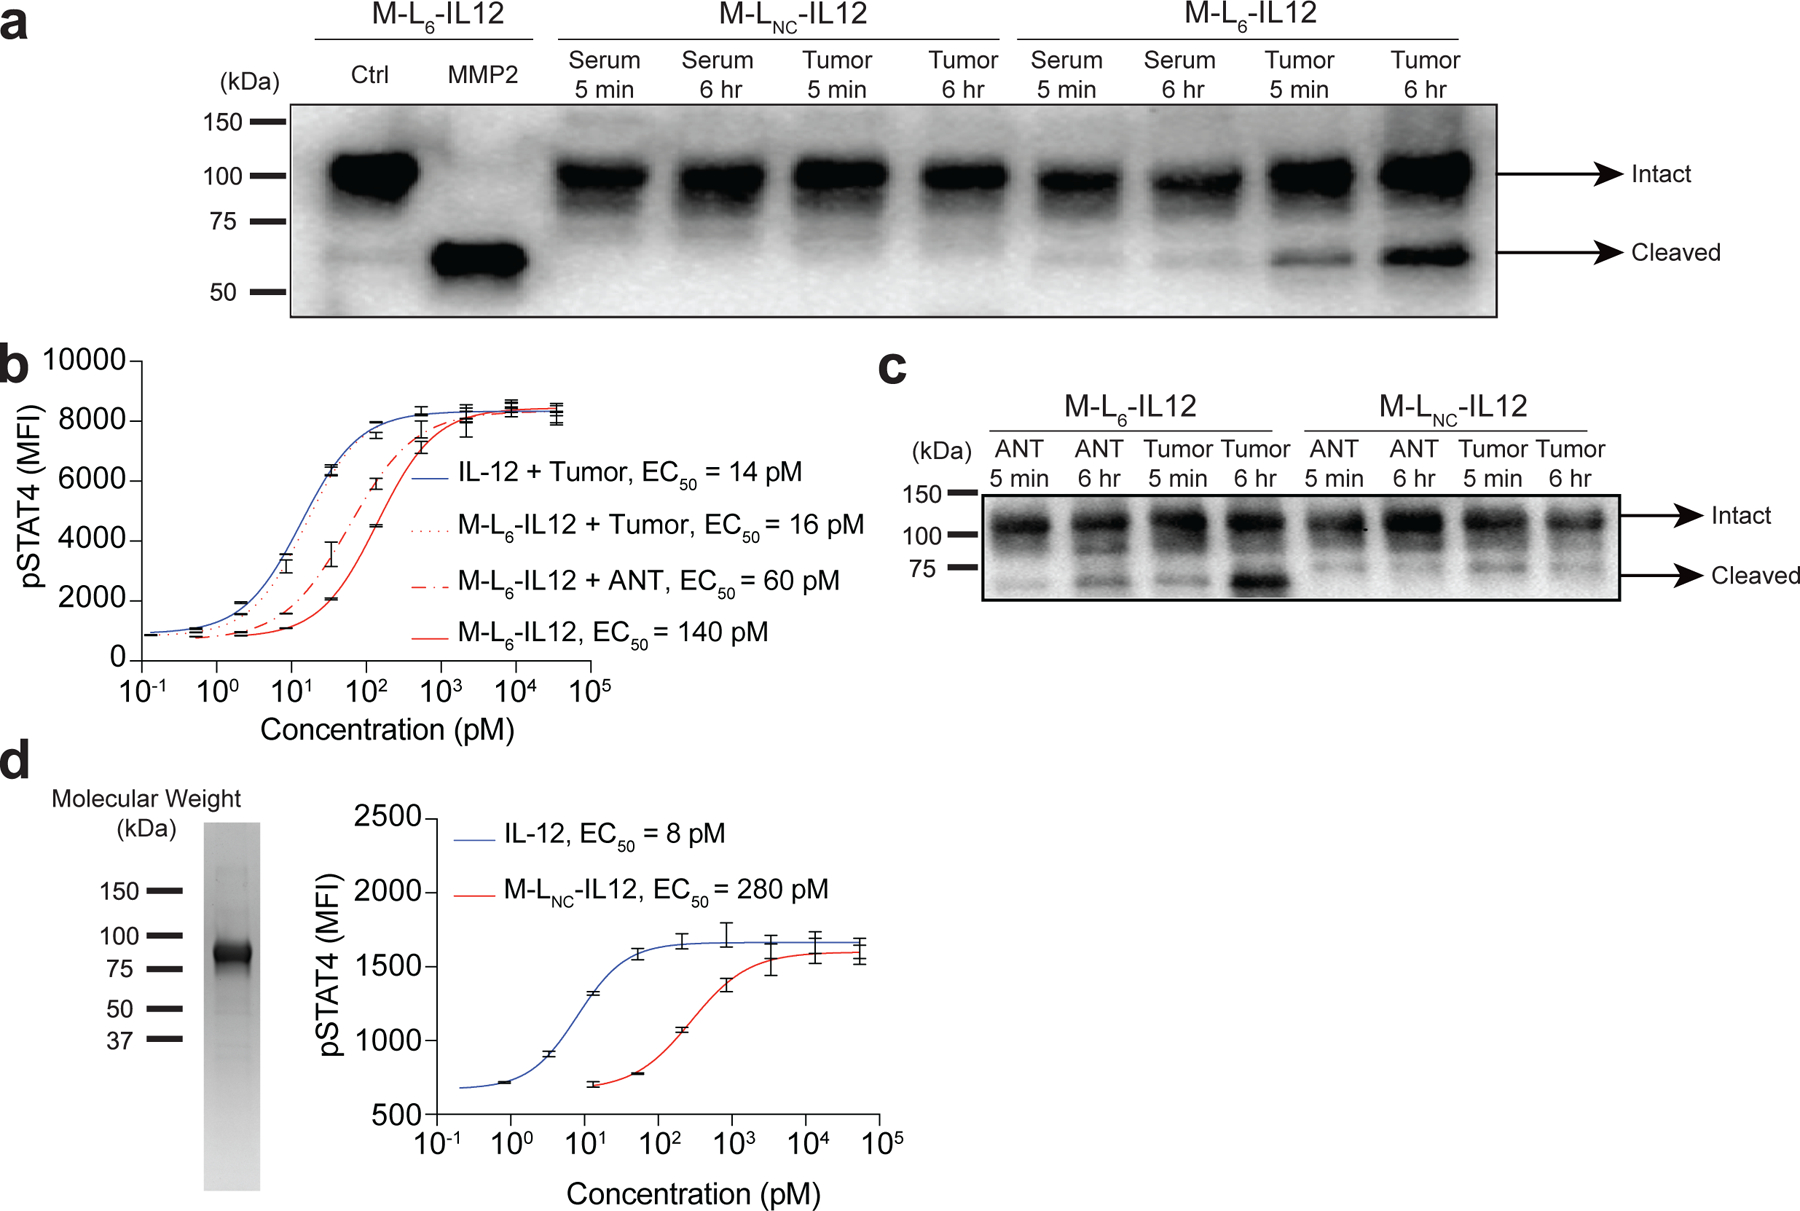
Immune-checkpoint inhibitors have shown modest efficacy against immunologically 'cold' tumours. Interleukin-12 (IL-12)-a cytokine that promotes the recruitment of immune cells into tumours as well as immune cell activation, also in cold tumours-can cause severe immune-related adverse events in patients. Here, by exploiting the preferential overexpression of proteases in tumours, we show that fusing a domain of the IL-12 receptor to IL-12 via a linker cleavable by tumour-associated proteases largely restricts the pro-inflammatory effects of IL-12 to tumour sites. In mouse models of subcutaneous adenocarcinoma and orthotopic melanoma, masked IL-12 delivered intravenously did not cause systemic IL-12 signalling and eliminated systemic immune-related adverse events, led to potent therapeutic effects via the remodelling of the immune-suppressive microenvironment, and rendered cold tumours responsive to immune-checkpoint inhibition. We also show that masked IL-12 is activated in tumour lysates from patients. Protease-sensitive masking of potent yet toxic cytokines may facilitate their clinical translation.


Conflict of interest statement

Competing interests

A.M., J.I., J.L.M., and J.A.H are inventors on a patent application filed by the University of Chicago covering the technology described in this work. They and M.A.S. hold equity in Arrow Immune, Inc., which is developing the technology, and J.A.H. is an officer of that company. The other authors declare no competing interests.

Figures

Extended Data Fig. 1
Extended Data Fig. 1. Antitumor efficacy of masked IL-12 is linker-dependent.
Mice were treated as described in Fig. 2a. Individual tumor growth curves (a) and survival (b) are shown. Statistical analysis in b was performed using log-rank (Mantel-Cox) test.
Extended Data Fig. 2
Extended Data Fig. 2. M-L6-IL12 is cleaved by mouse tumors ex vivo and in vivo.
a, Masked IL-12 variants containing linkers L2, L4, L6 and the non-cleavable LNC (0.83 μM) were incubated with EMT6 homogenate (2 mg/mL) for 6 hr at 37 °C. Samples were then diluted in media and applied to pre-activated mouse CD8+ T cells and pSTAT4 MFI was measured. b, M-L6-IL12 or non-cleavable M-LNC-IL12 were incubated in tumor-bearing serum or EMT6 homogenate for indicated times at 37 °C. Reaction mixture was analyzed via western blotting. MMP2-activated M-L6-IL12 is shown as positive control. c, B16F10-bearing mice were injected intratumorally with either M-L6-IL12 or M-LNC-IL12 (167 pmol). Tumors were collected 2 hr post injection and homogenized immediately in the presence of proteases inhibitors and EDTA to stop any further degradation and analyzed via western blotting. Experiments were performed twice with similar results.
Extended Data Fig. 3
Extended Data Fig. 3. M-L6-IL12 induces a dose-dependent antitumor efficacy in B16F10 melanoma and shows extended half-life.
a, Mice bearing B16F10 tumors were treated i.v. with either PBS (n = 5), 16.7 pmol M-L6-IL12 (n = 6), 83.3 pmol M-L6-IL12 (n = 7), 250 pmol M-L6-IL12 (n = 9), or 83.3 pmol IL-12 (n = 9) on days 7, 10 and 13 post tumor inoculation. Individual tumor growth curves (left) and survival curve (right) are shown. Statistics was performed using Mantel-Cox test. b, Healthy C57BL/6 mice were treated i.v. with 83.3 pmol of IL-12 or M-L6-IL12 (n = 3/group) and bled at the indicated time points. Plasma was analyzed for IL-12 concentration via ELISA. Experiments were performed twice with similar results.
Extended Data Fig. 4
Extended Data Fig. 4. M-L6-IL12 and unmodified IL-12 induce similar expression of proinflammatory markers and cell infiltration in B16F10 melanoma.
Mice were treated as described in Fig. 3. Intratumoral levels of CXCL-1 (a), CCL-11 (b), CCL-17 (c), IL-10 (d), IL-12 (e), IL-6 (f) were quantified using a LEGENDPlex assay and normalized by total tumor protein content. Frequency of CD3+CD4+Foxp3 T cells (g), CD11c+MHCII+dendritic cells (h), and CD11b+F4/80+ macrophages (i) as percentage of live cells are shown. PBS, n = 8; IL-12, n = 8; M-L6-IL12, n = 7. Data are mean ± s.e.m. Statistical analyses were performed using ordinary one-way ANOVA with Tukey’s multiple comparison test. Experiment was performed twice with similar results.
Extended Data Fig. 5
Extended Data Fig. 5. Masked IL-12 minimizes systemic inflammatory response in healthy mice.
Mice were treated and analyzed as described in Fig. 4b–h. Plasma levels of IL-12 (a), IL-10 (b), IL-1a (c), IL-1b (d), and IFNb (e) were quantified using a LEGENDPlex assay. Serum levels of albumin (f), blood urea nitrogen (g), and total protein (h) were quantified using a blood chemistry analyzer. PBS, n = 5; IL-12, n = 7; M-L6-IL12, n = 6. Data are mean ± s.e.m. Statistical analyses were performed using ordinary one-way ANOVA with Tukey’s multiple comparison test. Experiments were performed twice with similar results. L.O.D = limit of detection.
Extended Data Fig. 6
Extended Data Fig. 6. Masked IL-12 reduces organ damage in MC38-bearing mice.
Mice bearing day 7 MC38 tumors were treated i.v. with either PBS (n = 6), IL-12 (83.3 pmol, n = 7) or M-L6-IL12 (250 pmol, n = 6) on days 7, 10 and 13. Plasma was collected on day 16 and levels of ALT (a), AST (b), amylase (c) and total protein (d) were quantified using a blood chemistry analyzer. Data are mean ± s.e.m. Statistical analyses were performed using ordinary one-way ANOVA with Tukey’s multiple comparison test. Experiments were performed twice with similar results.
Fig. 1 |
Fig. 1 |. Masked IL-12 fully regains activity upon treatment with recombinant proteases.
a, Schematic of masked IL-12 in healthy tissues (no signalling) and in the tumour, with the mask being cleaved by various tumour-associated proteases. b, SDS-PAGE analysis of the cleavage of masked IL-12 variants by recombinant proteases. IL-12 (50 μg/ml; 0.84 μM), M-L3-IL12 (0.84 μM) or M-L2-IL12 (0.84 μM) were incubated with activated MMP2 (2 μg/ml), MMP9 (5 μg/ml) for 30 min at 37°C or with uPA (10 μg/ml) for 2.5 hr at 37°C. c,d, Dose-response relationship of phosphorylated STAT4 (pY693) with MMP2-treated M-L3-IL12 (c) and uPA-treated M-L2-IL12 (d) in preactivated primary mouse CD8+ T cells (n=2 per condition, technical duplicates). Data are mean ± s.e.m.; EC50, half-maximum effective concentration; MFI, mean fluorescence intensity. Experiments were performed at least twice, with similar results. Representative data are shown.
Fig. 2 |
Fig. 2 |. Masked IL-12 induces a strong antitumour response and potentiates CPI therapy.
a, B16F10 melanoma-bearing mice were treated with PBS (n=6), or 250 pmol of M-L2-IL12 (n=7), M-L4-IL12 (n=8), M-L6-IL12 (n=7) i.v. on days 7, 10 and 13 post tumour inoculation. Tumour growth curves are shown. b, Subcutaneous MC38 colon adenocarcinoma-bearing mice were treated with PBS (n=5), 5 μg (83.3 pmol) IL-12 (n=7) or 250 pmol of M-L6-IL12 (n=7) i.v. on days 7, 10 and 13 post tumour inoculation. Tumour growth curves (left) and survival (right) are shown. c, Orthotopic EMT6 mammary carcinoma-bearing mice were treated with PBS (n=9), αPD-1 (n=9, 100 μg, i.p.) or M-L6-IL12 (n=9, 250 pmol, i.v.) on days 10, 13 and 16 post tumour inoculation. Tumour growth curves (left) and survival (right) are shown. d, Orthotopic B16F10 melanoma-bearing mice were treated with PBS (n=9), αPD-1 (n=9, 100 μg, i.p.), M-L6-IL12 (n=15, 250 pmol, i.v.) or M-L6-IL12 + αPD-1 (n=12) on days 7, 10 and 13 post tumour inoculation. Survival curves are shown. Data are mean ± s.e.m. Arrowheads indicate times of treatment. Experiments in a,b,c were performed twice with similar results. Data in d were pooled from two independent experiments. Statistical analyses were performed using ordinary one-way ANOVA with Tukey’s multiple comparison tests. For survival plots, Mantel-Cox test was used.
Fig. 3 |
Fig. 3 |. Masked IL-12 therapy elicits a wide range of inflammatory responses and causes immune cell infiltration in melanoma.
Orthotopic B16F10 melanoma-bearing mice were treated with PBS (n=8), 5 μg (83.3 pmol) IL-12 (n=8) or 250 pmol of M-L6-IL12 (n=7) i.v. on days 6 and 9 post tumour inoculation. Tumours were excised on day 11 and were homogenised for intratumoural cytokine/chemokine analysis via LEGENDPlex (a) and processed for flow cytometric analysis (b). Intratumoural cytokines were measured and normalised by total tumour protein content. Data are mean ± s.e.m. Experiments were performed twice with similar results. Statistical analyses were performed using ordinary one-way ANOVA with Tukey’s multiple comparison tests.
Fig. 4 |
Fig. 4 |. Masked IL-12 eliminates side effects associated with IL-12 therapy in healthy animals.
a, Healthy C3H/HeJ mice were dosed daily (starting from day 0) with PBS (n=6), 0.5 μg (8.3 pmol) of IL-12 (n=8) or 25 pmol of M-L6-IL12 (n=8) s.c. 6 times. Body weight change (left) and day 5 comparison (right) are shown. b, Healthy C57BL/6 mice were treated with PBS (n=5), 5 μg (83.3 pmol) IL-12 (n=7) or 250 pmol M-L6-IL12 (n=6) i.v. on days 0, 3 and 6. Mice were bled on days 2, 3, 8 and 9 for plasma cytokine analysis using LEGENDPlex and blood chemistry analysis. c, Healthy C57BL/6 mice were treated with PBS (n=5), 5 μg (83.3 pmol) IL-12 (n=5) or 250 pmol M-L6-IL12 (n=5) i.v. and bled 4 days later for quantification of circulating blood cells using hematology analyzer. d, Healthy C57BL/6 mice were administered neutralising antibodies (400 μg, n=5 per group) on days 0 and 3. On day 4, mice were treated i.v. with 5 μg (83.3 pmol) IL-12 and bled on day 6 for plasma IFNg measurement. Data are mean ± s.e.m. Experiments were performed twice with similar results. Statistical analyses were performed using ordinary one-way ANOVA with Tukey’s multiple comparison tests.
Fig. 5 |
Fig. 5 |. Treatment of melanoma-bearing mice with masked IL-12 does not generate systemic irAEs.
Orthotopic B16F10 melanoma-bearing mice were treated with PBS (n=8), 5 μg (83.3 pmol) IL-12 (n=8) or 250 pmol M-L6-IL12 (n=7) i.v. on days 6 and 9 post tumour inoculation. On day 11, mice were bled for plasma cytokine quantification using LEGENDPlex (a) and spleens were excised for flow cytometric analysis (b). Data are mean ± s.e.m. Experiments were performed twice with similar results. Statistical analyses were performed using ordinary one-way ANOVA with Tukey’s multiple comparison tests.
Fig. 6 |
Fig. 6 |. Cleavage of the mask by human tumours and generation of human masked IL-12.
a, Western blot analysis of the cleavage of M-L6-IL12 by human melanoma and patient-matched serum. M-LNC-IL12 or M-L6-IL12 (0.84 μM) were incubated with either serum or melanoma homogenate (2 mg/mL) for indicated times at 37 °C. Untreated M-L6-IL12 and MMP2-treated M-L6-IL12 were loaded as controls. b, Cleavage of M-L6-IL12 by human breast tumour homogenate. IL-12 or M-L6-IL12 (at 0.84 μM) were mixed with either tumour homogenate or adjacent normal tissue (ANT) lysate (2 mg/mL) and incubated overnight at 37°C. Samples were then diluted and applied on pre-activated mouse CD8+ T cells and MFI of pSTAT4 was measured via flow cytometry (n=2 per condition, technical duplicates). c, Western blot analysis of the cleavage of M-L6-IL12 or M-LNC-IL12 by human breast cancer homogenate or ANT homogenate. Incubation was performed at 37°C for indicated duration. d, SDS-PAGE analysis (left) of purified human M-LNC-IL12 under nonreducing conditions and in vitro activity (right) of human M-LNC-IL12 as assessed by pSTAT4 MFI on preactivated human CD8+ T cells (n=2 per condition, technical duplicates). Data are mean ± s.e.m.; EC50, half-maximum effective concentration. ANT, adjacent normal tissue. Experiments were performed at least twice, with similar results. Representative data are shown.

References

    1. Zou W, Wolchok JD & Chen L PD-L1 (B7-H1) and PD-1 pathway blockade for cancer therapy: Mechanisms, response biomarkers, and combinations. Sci Transl Med 8, 328rv324, doi:10.1126/scitranslmed.aad7118 (2016). - DOI - PMC - PubMed
    1. Kalbasi A & Ribas A Tumour-intrinsic resistance to immune checkpoint blockade. Nature Reviews Immunology 20, 25–39, doi:10.1038/s41577-019-0218-4 (2020). - DOI - PMC - PubMed
    1. Vitale I, Shema E, Loi S & Galluzzi L Intratumoral heterogeneity in cancer progression and response to immunotherapy. Nature medicine 27, 212–224 (2021). - PubMed
    1. Gocher AM, Workman CJ & Vignali DAA Interferon-γ: teammate or opponent in the tumour microenvironment? Nature Reviews Immunology, doi:10.1038/s41577-021-00566-3 (2021). - DOI - PMC - PubMed
    1. Ayers M et al. IFN-γ-related mRNA profile predicts clinical response to PD-1 blockade. J Clin Invest 127, 2930–2940, doi:10.1172/jci91190 (2017). - DOI - PMC - PubMed

Publication types