. 2022 May;24(5):748-756.
doi: 10.1038/s41556-022-00897-w. Epub 2022 May 9.

Epigenetic, genetic and maternal effects enable stable centromere inheritance

Affiliations

Epigenetic, genetic and maternal effects enable stable centromere inheritance

Arunika Das et al. Nat Cell Biol. 2022 May.

Abstract

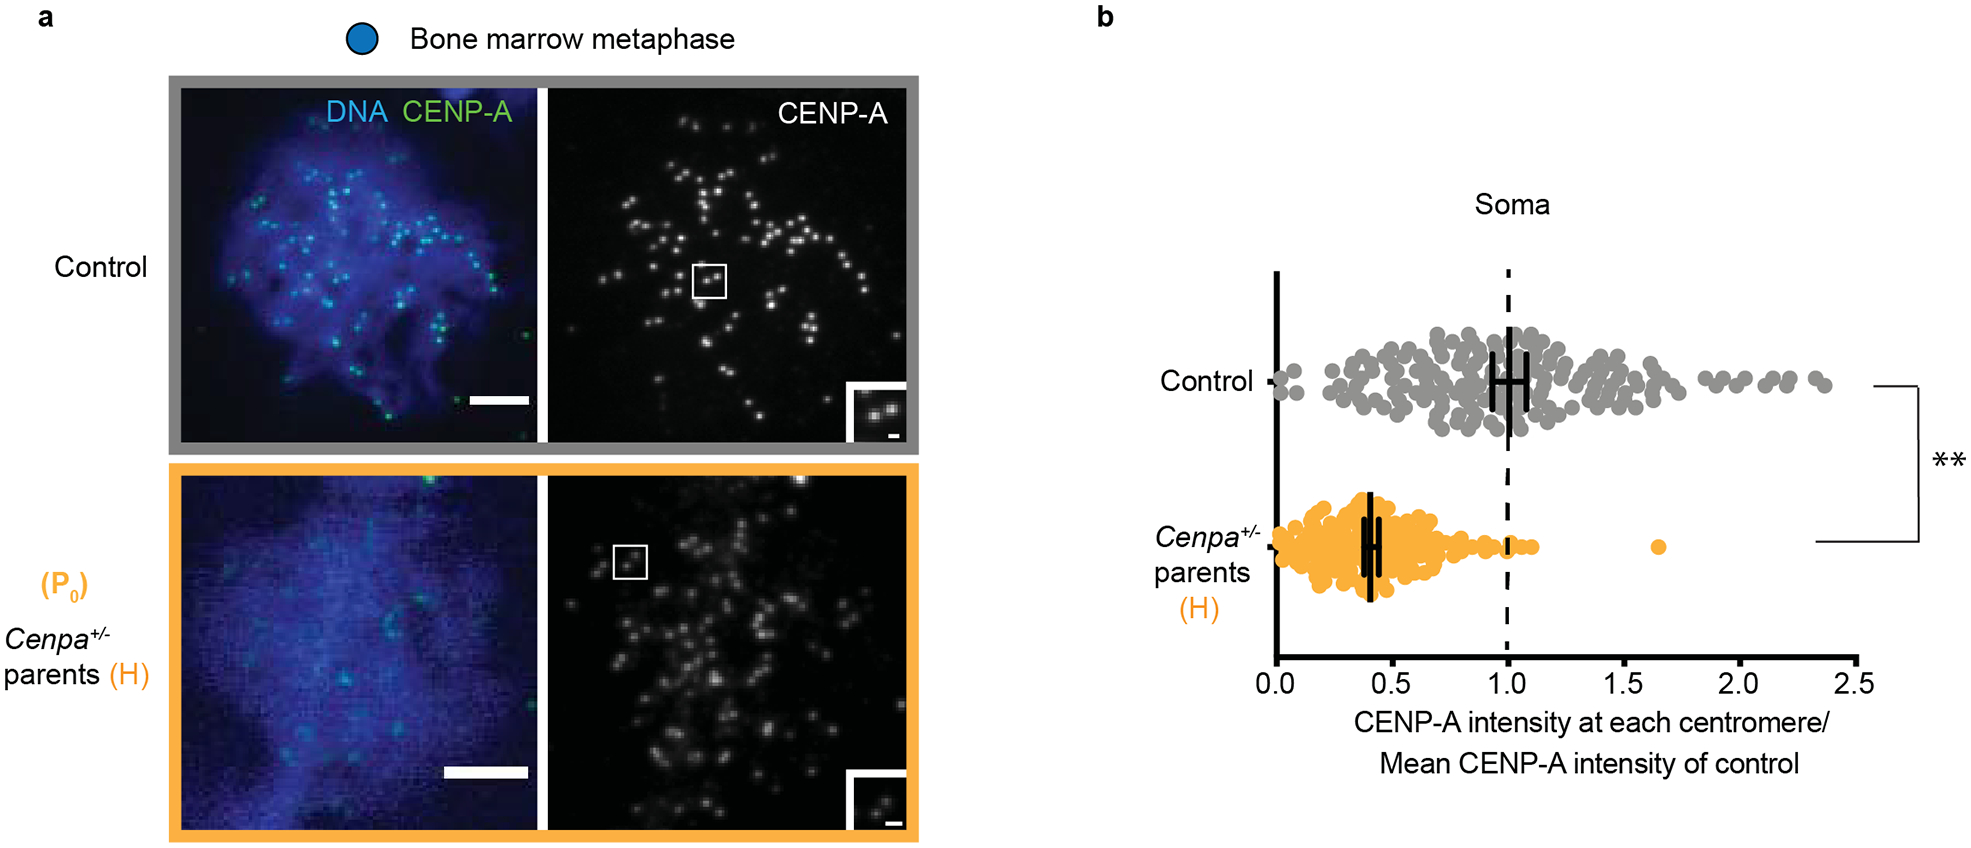
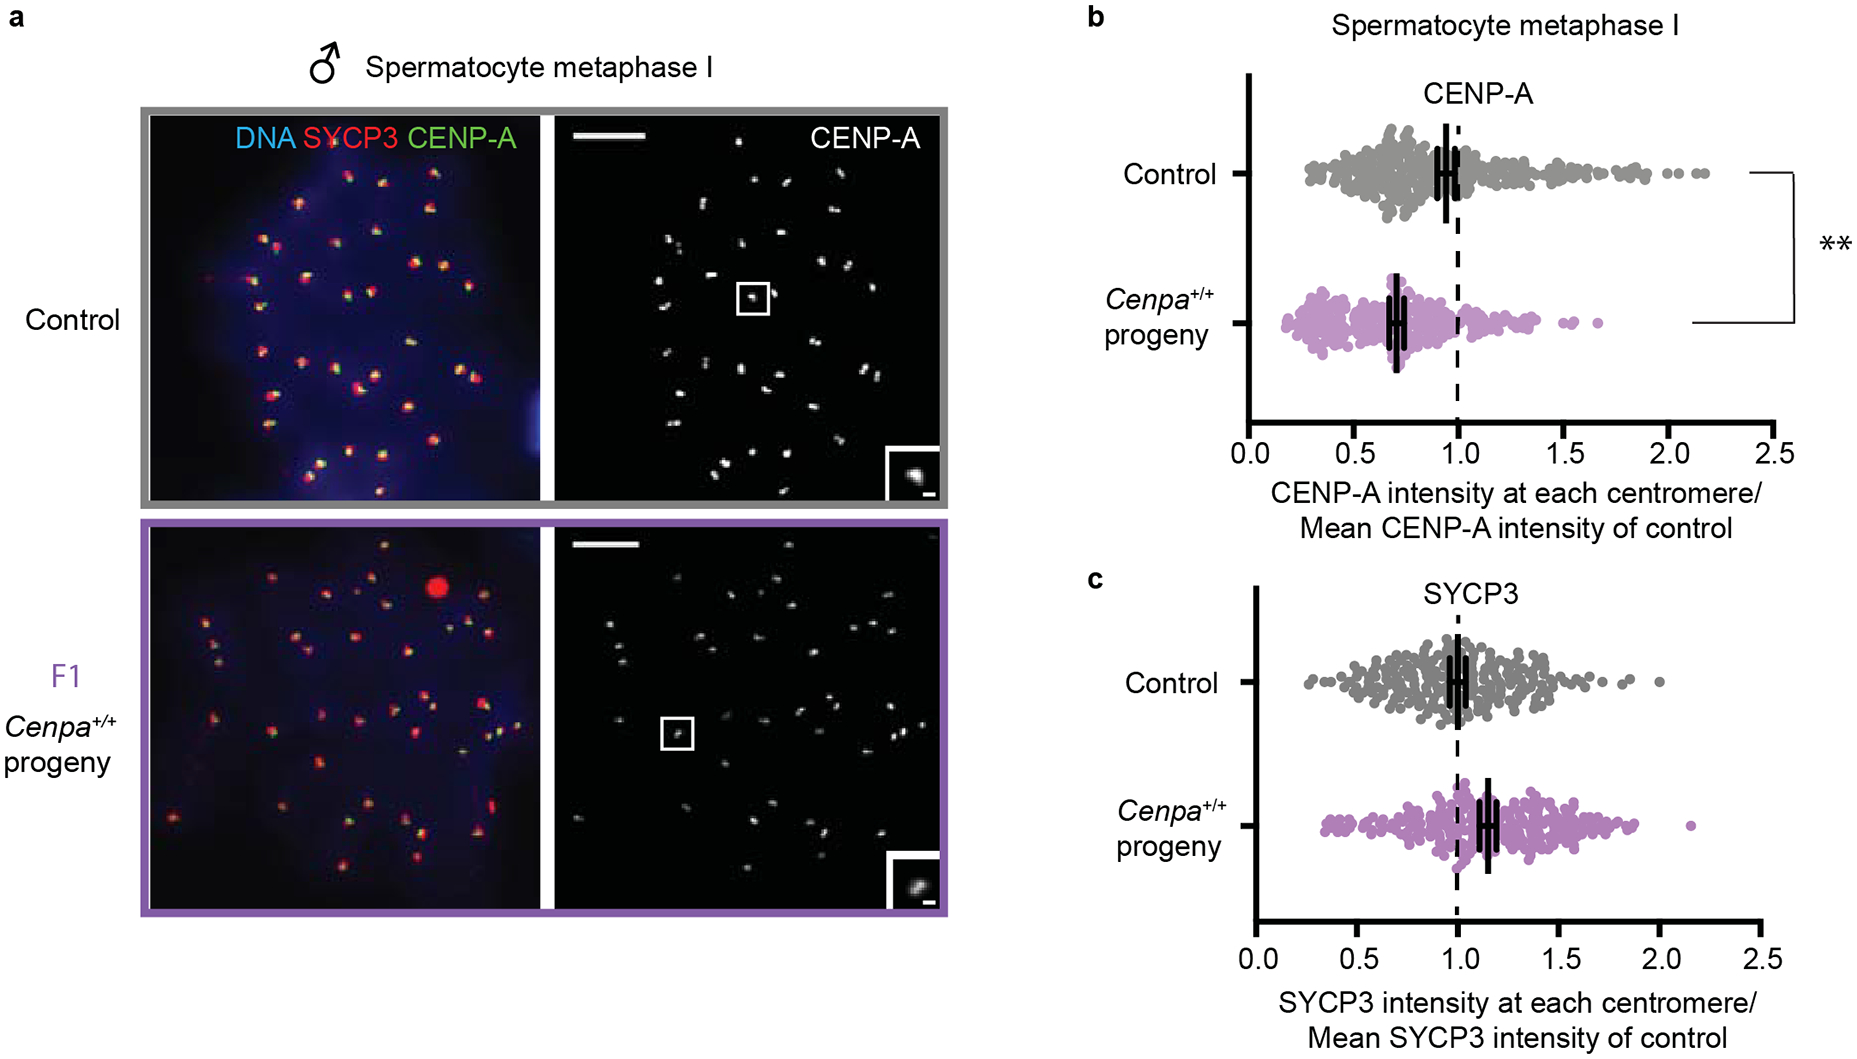
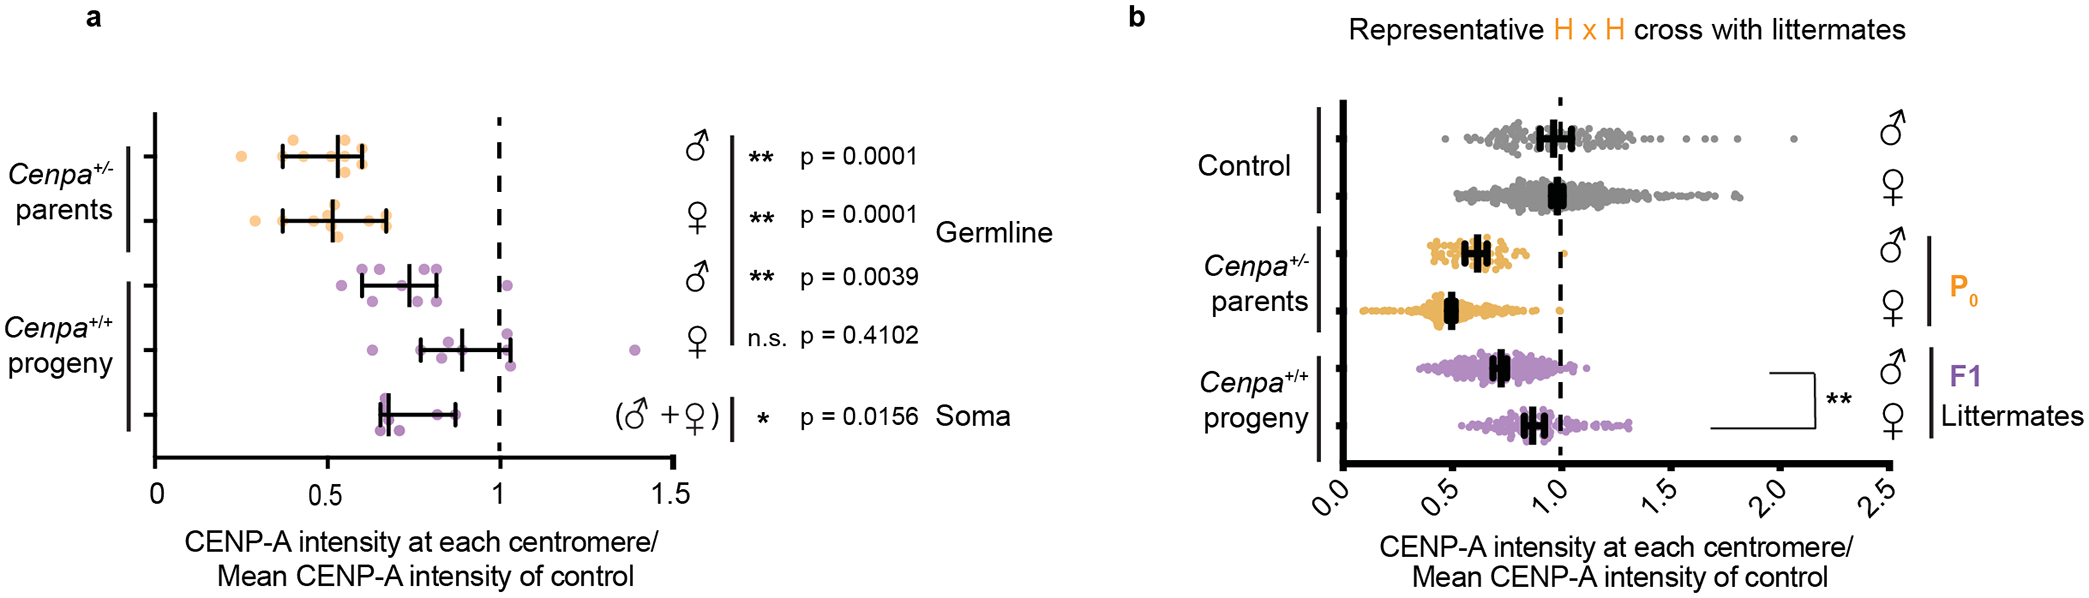
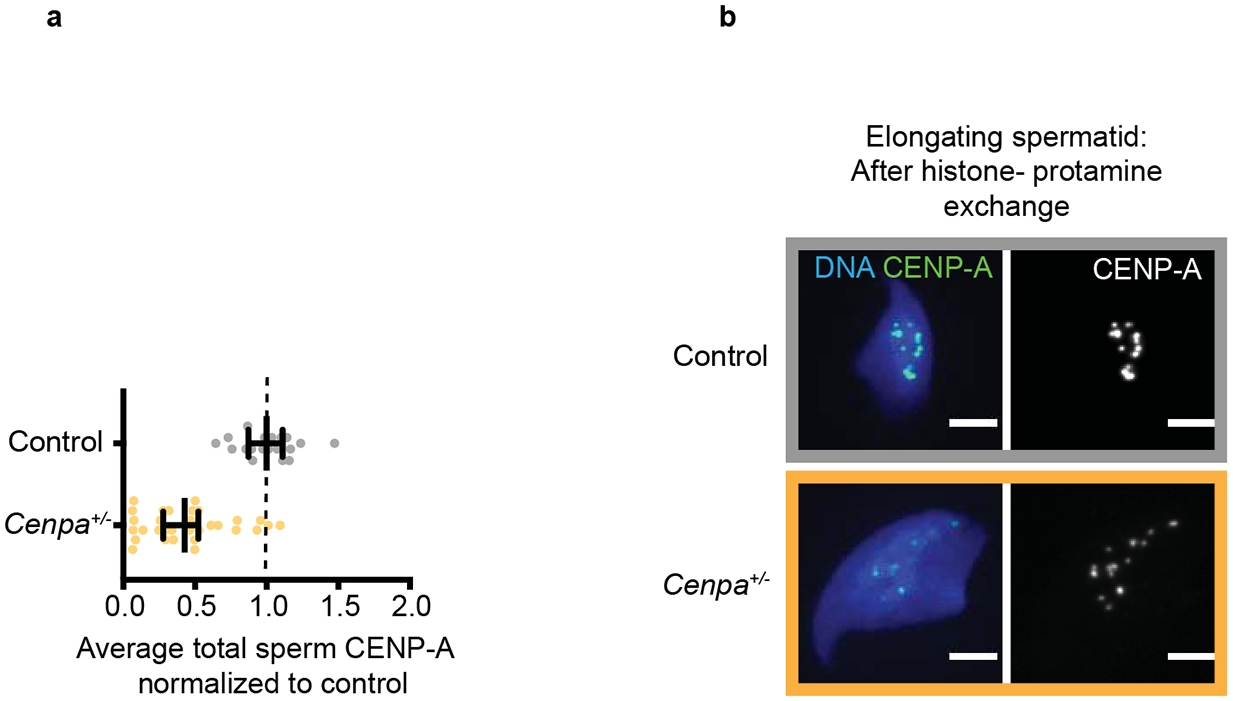
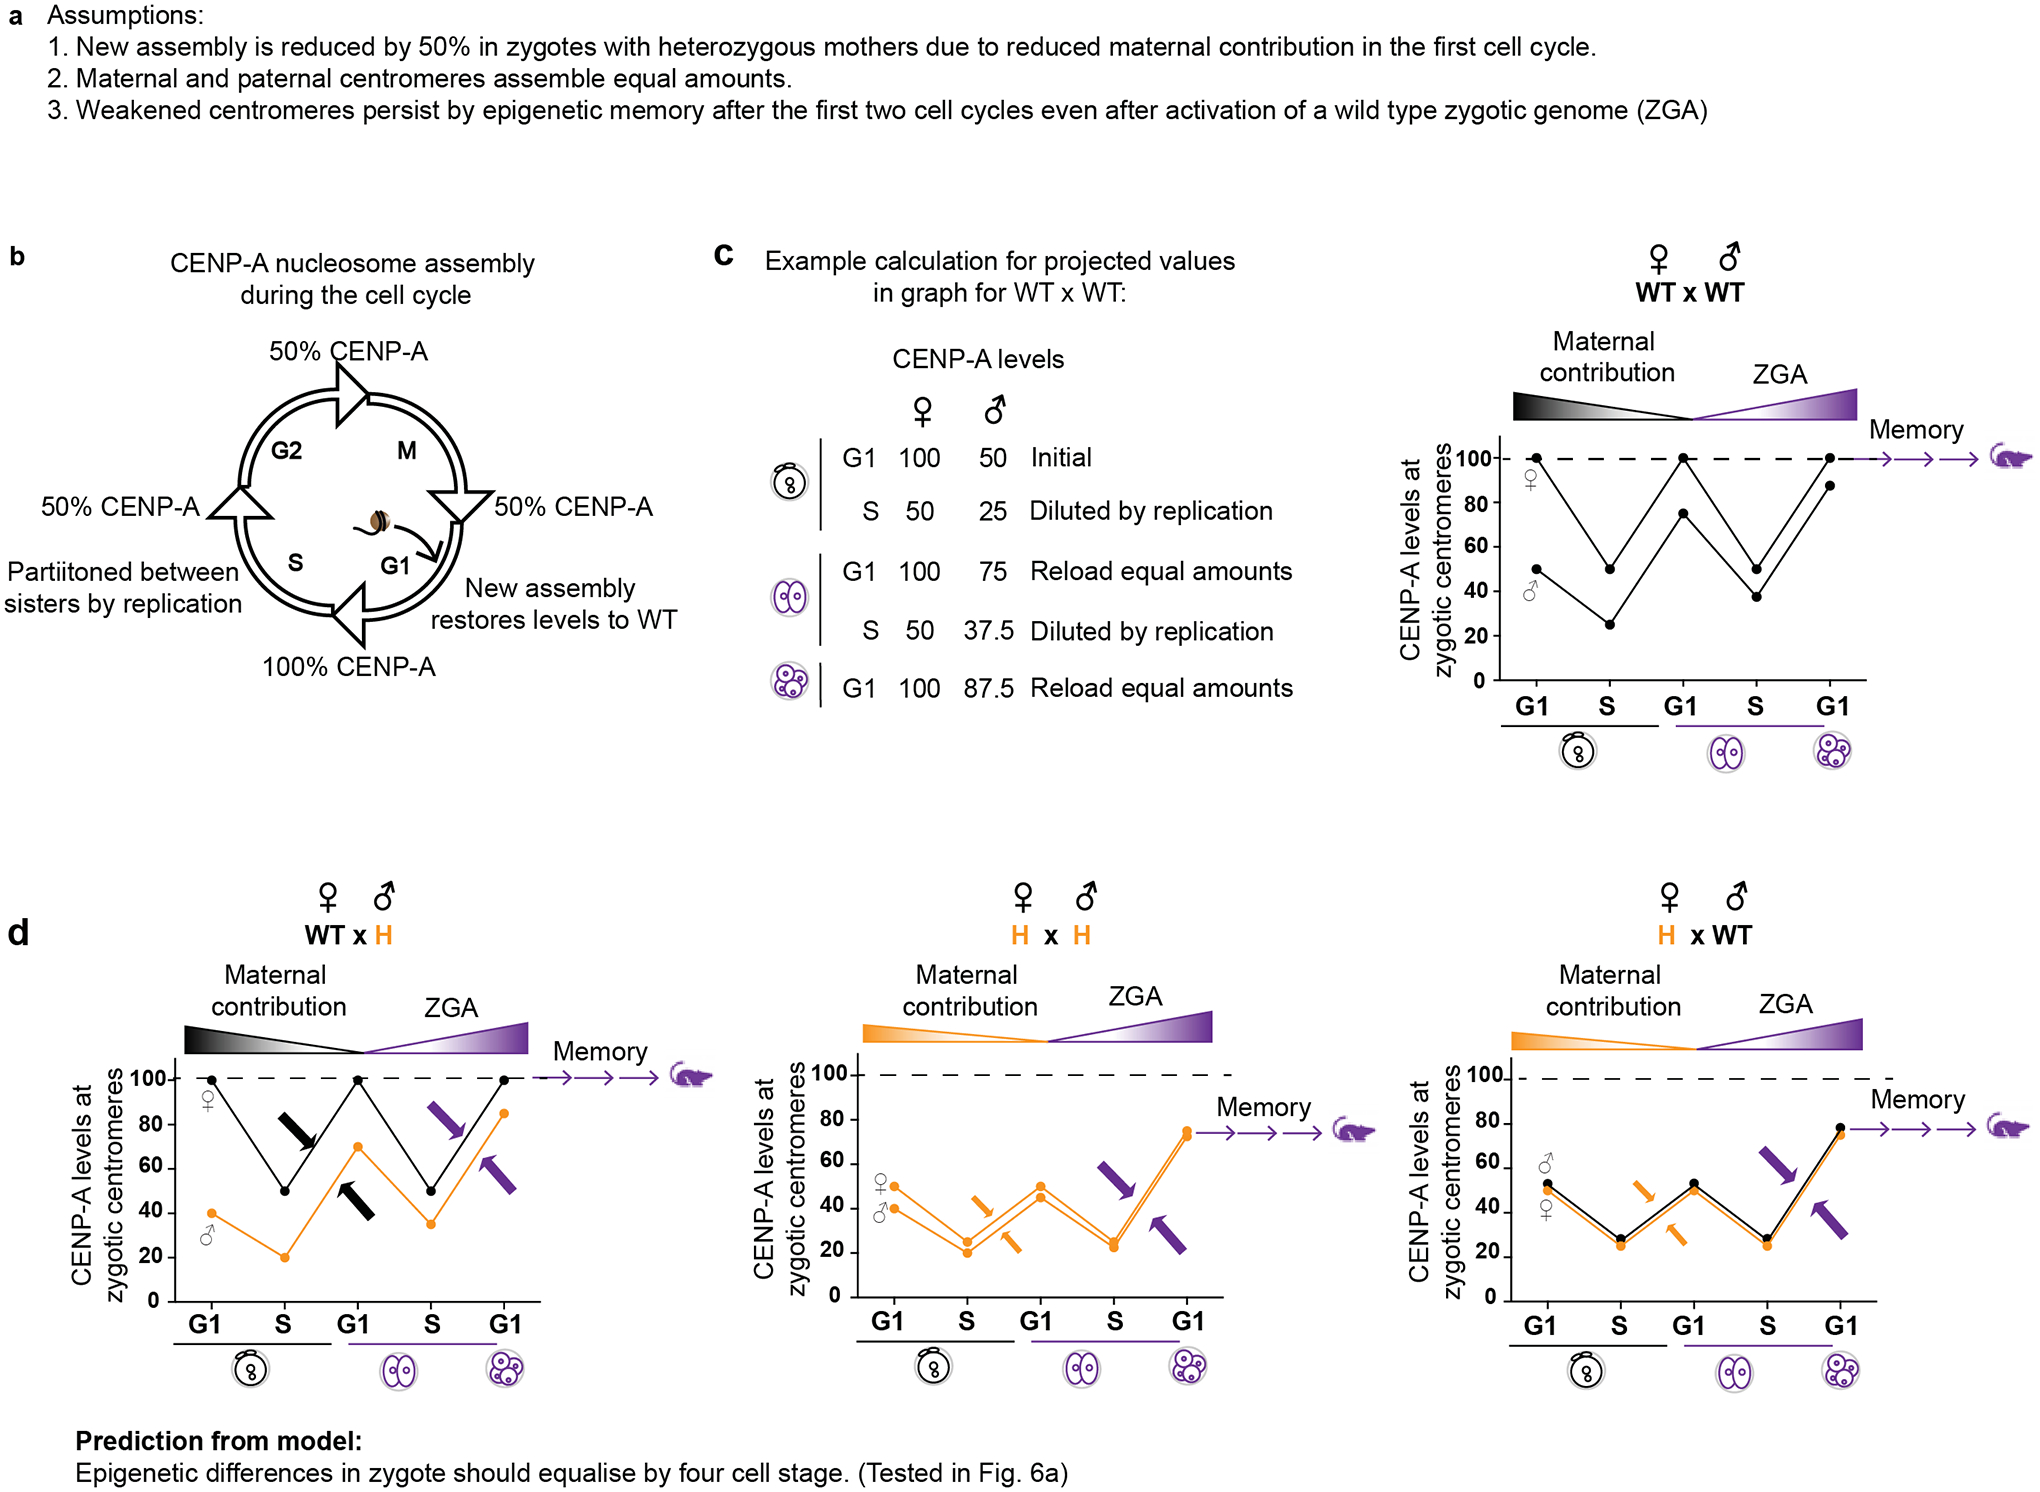
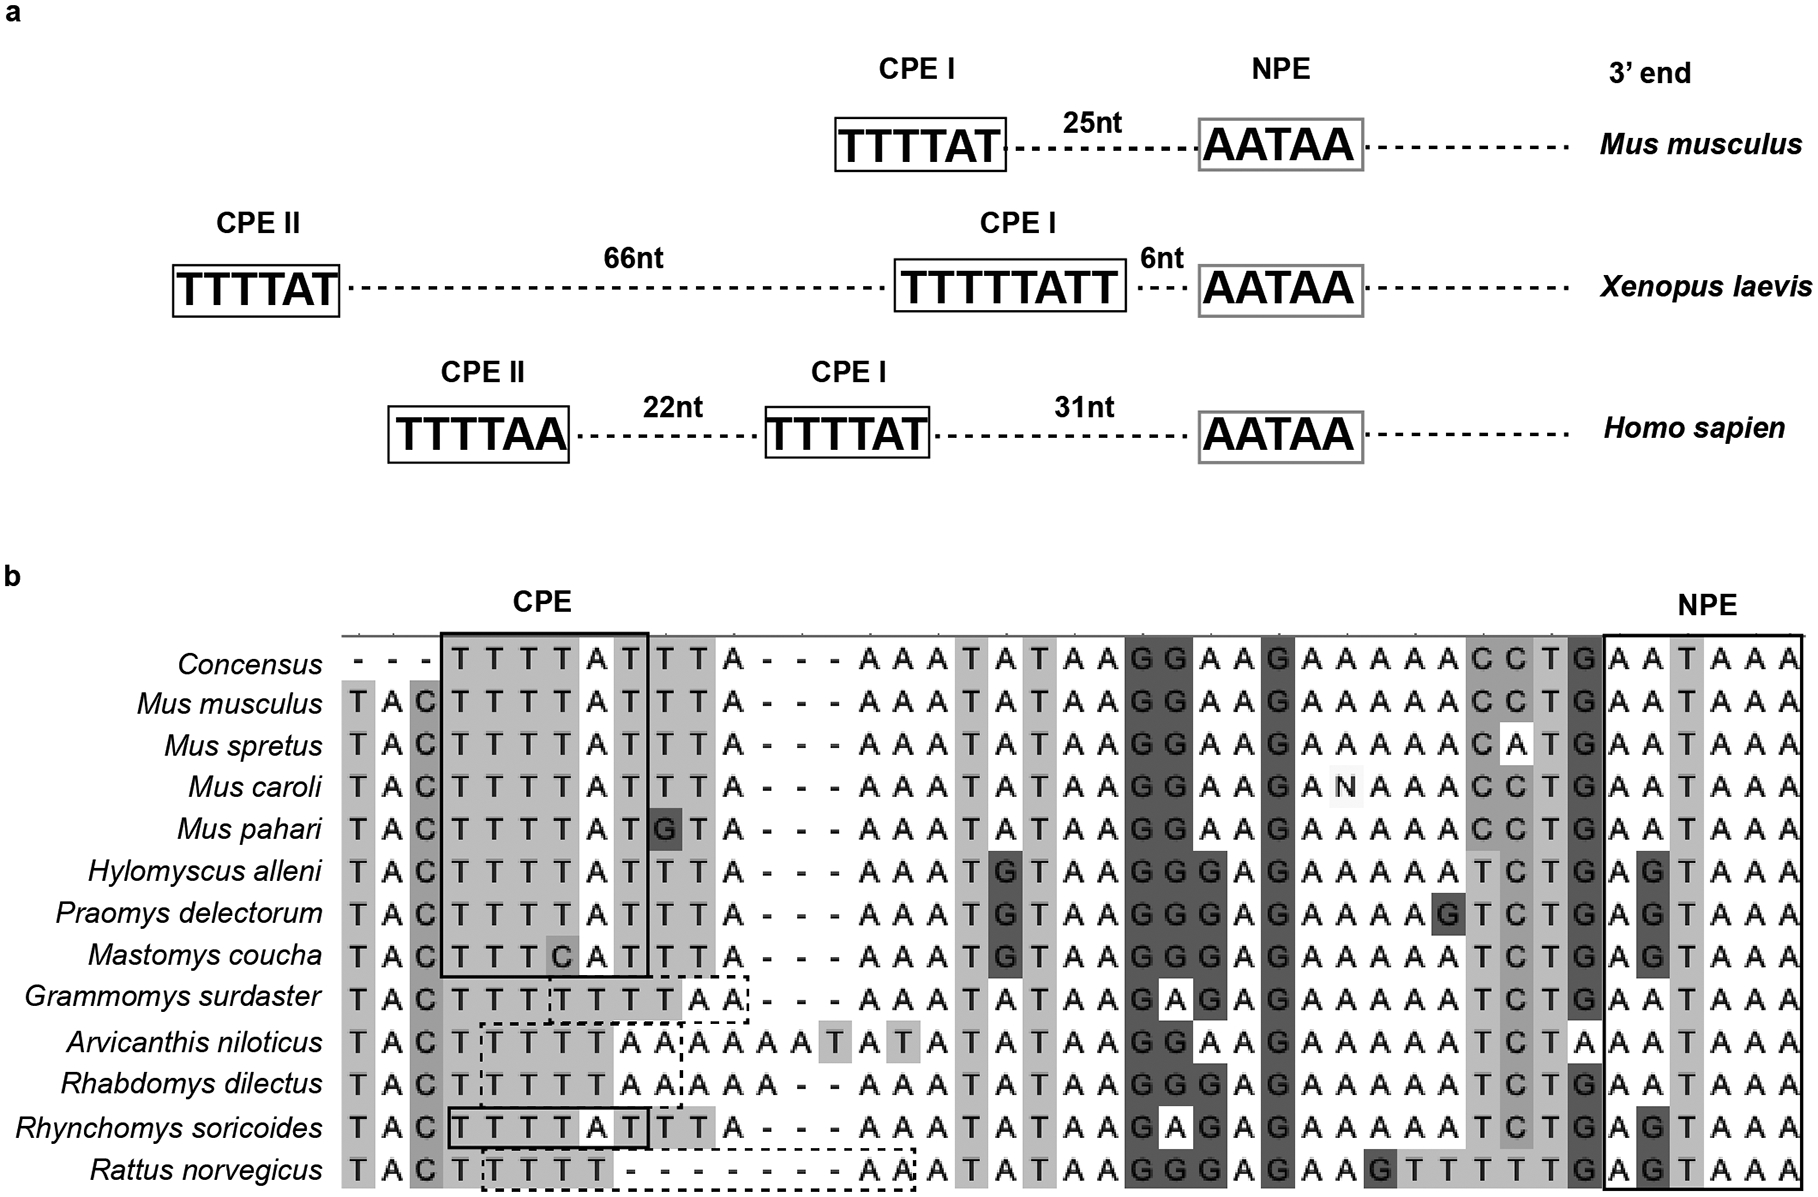
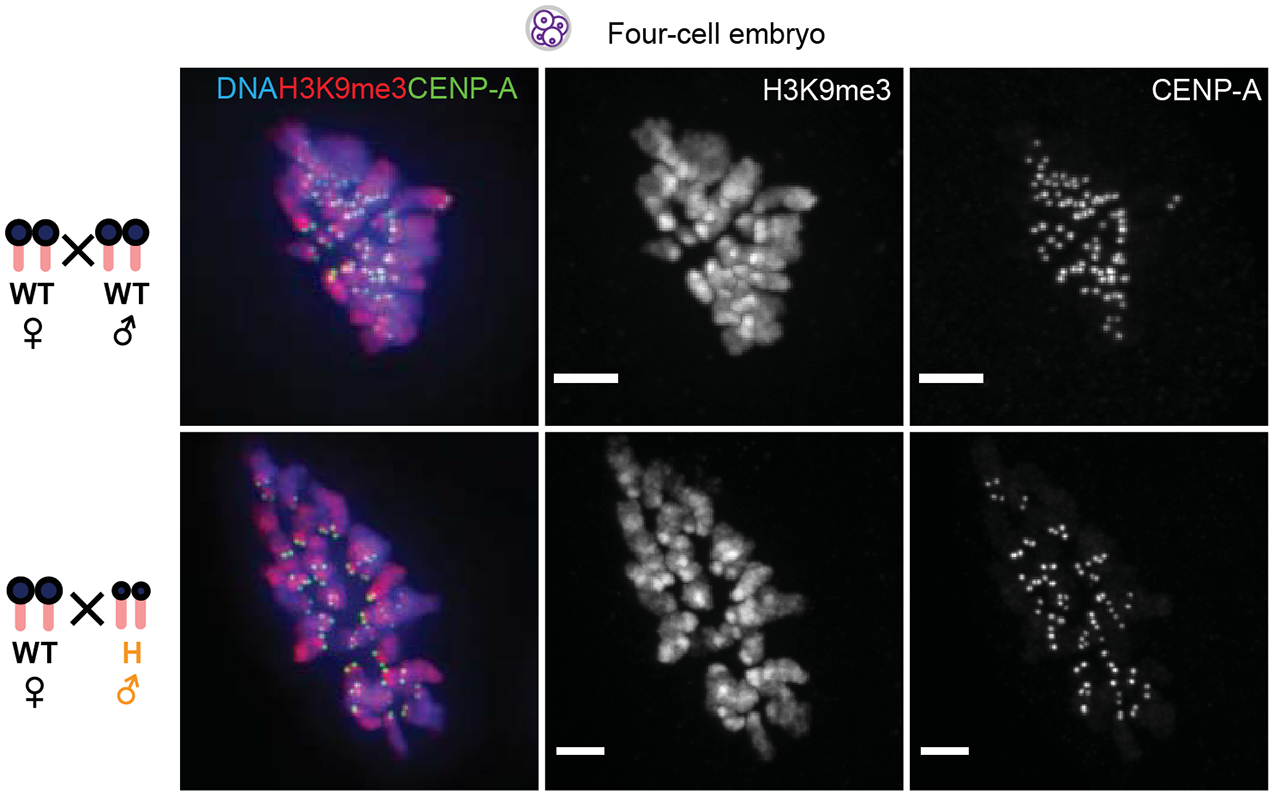
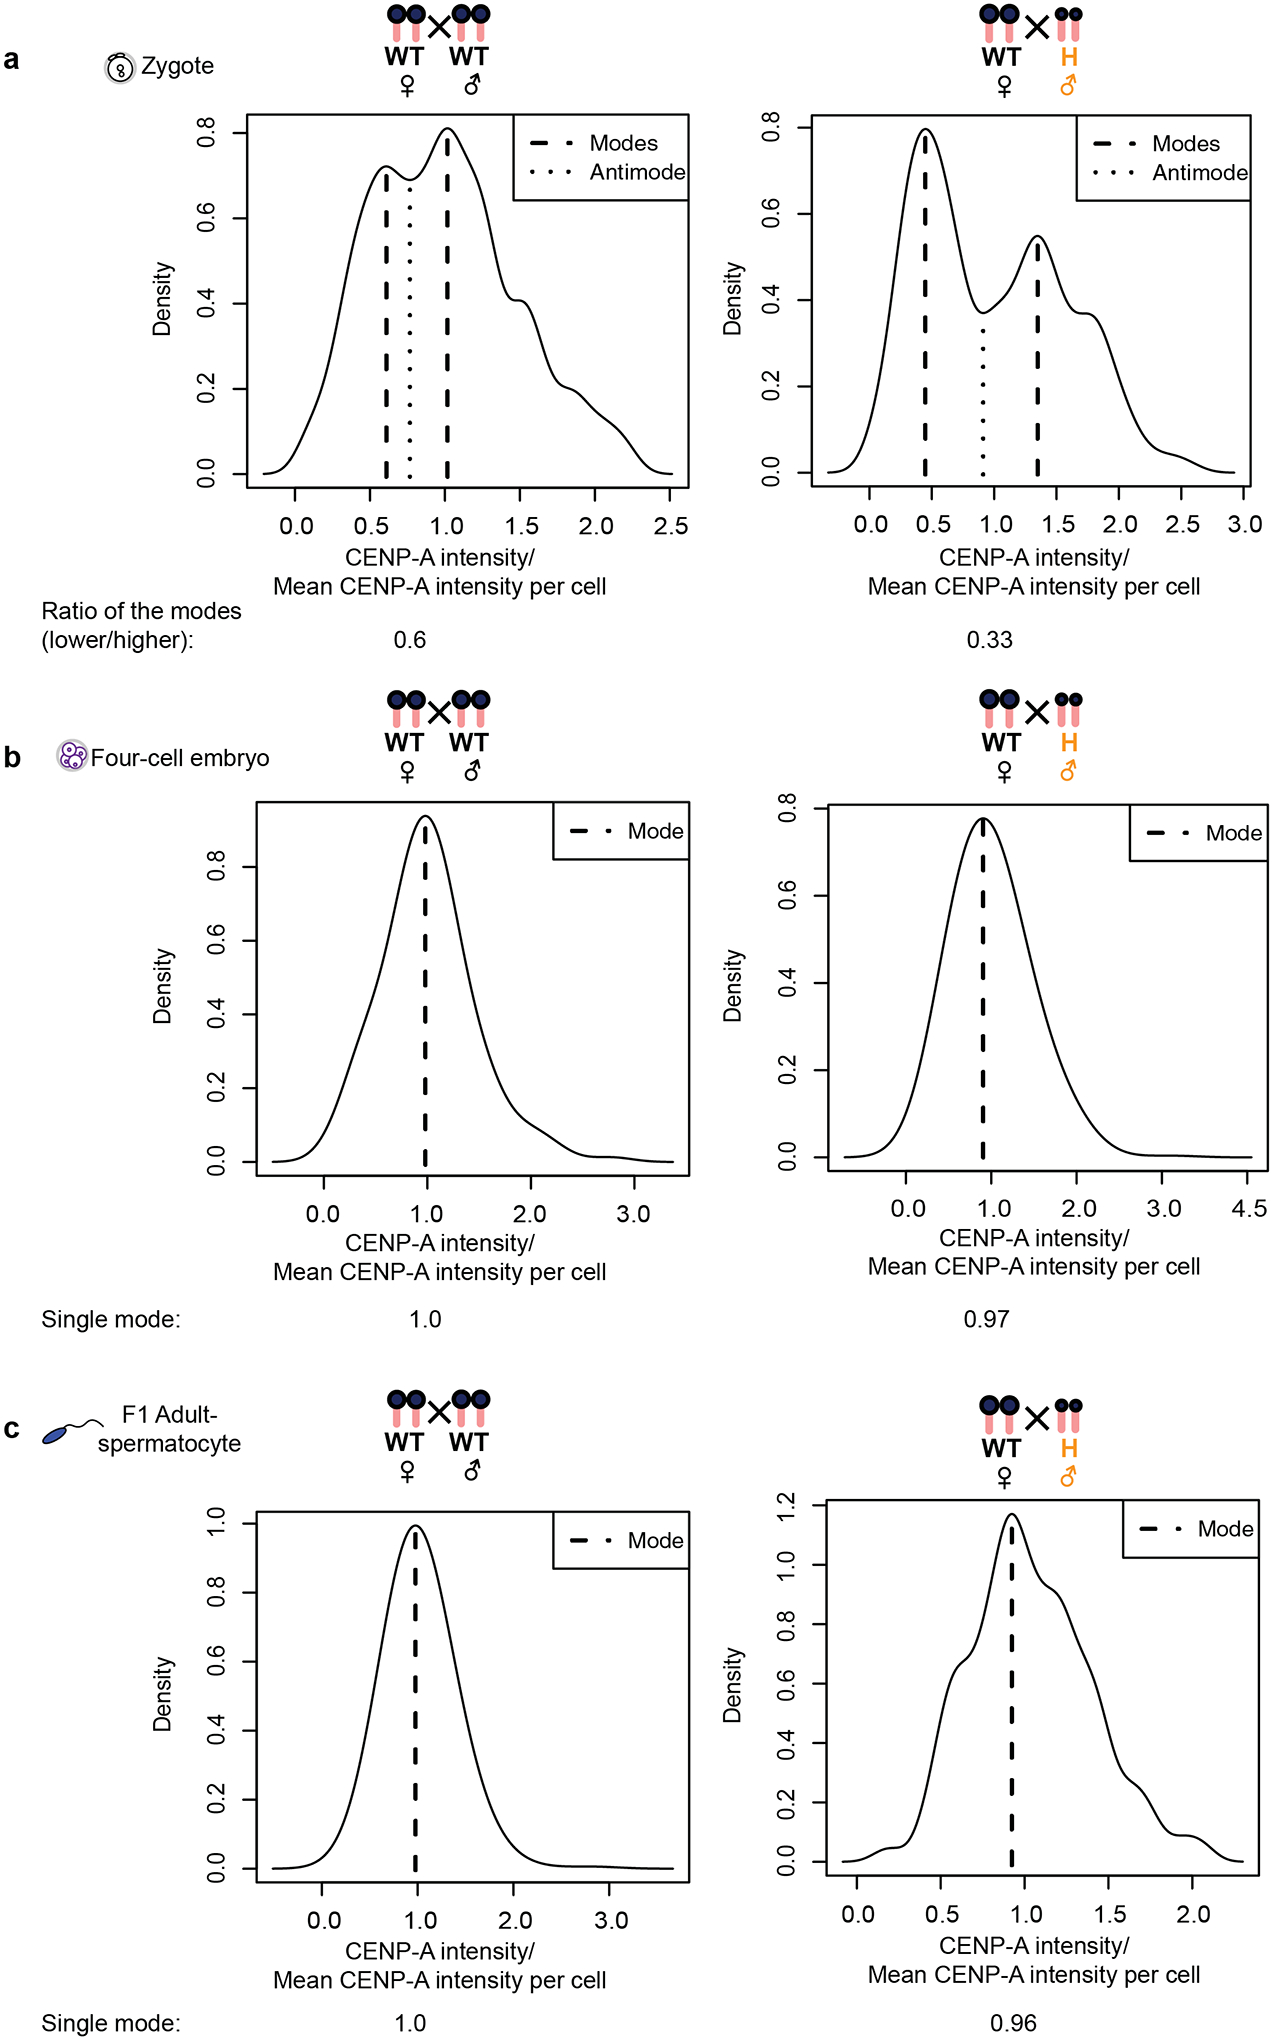
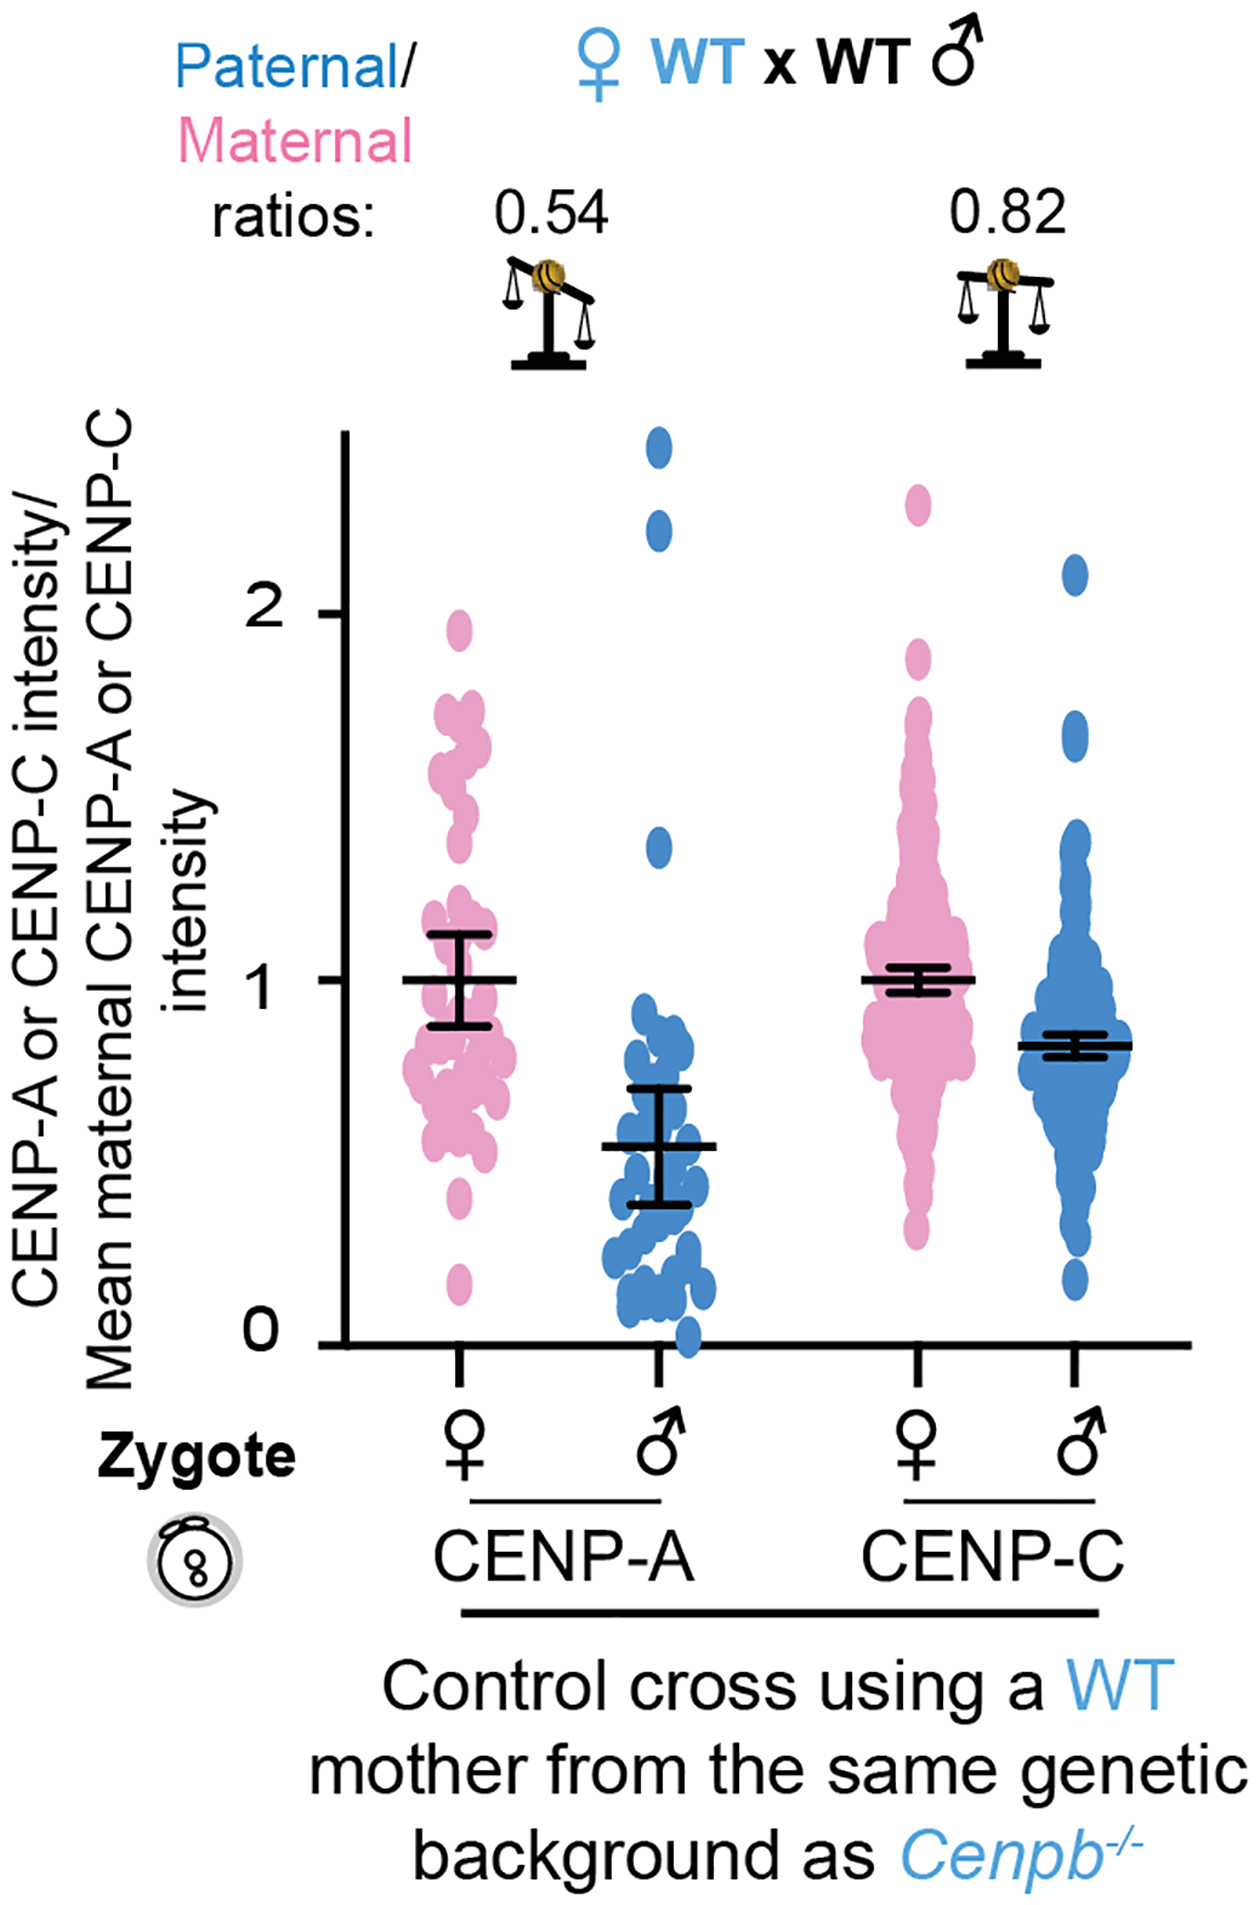
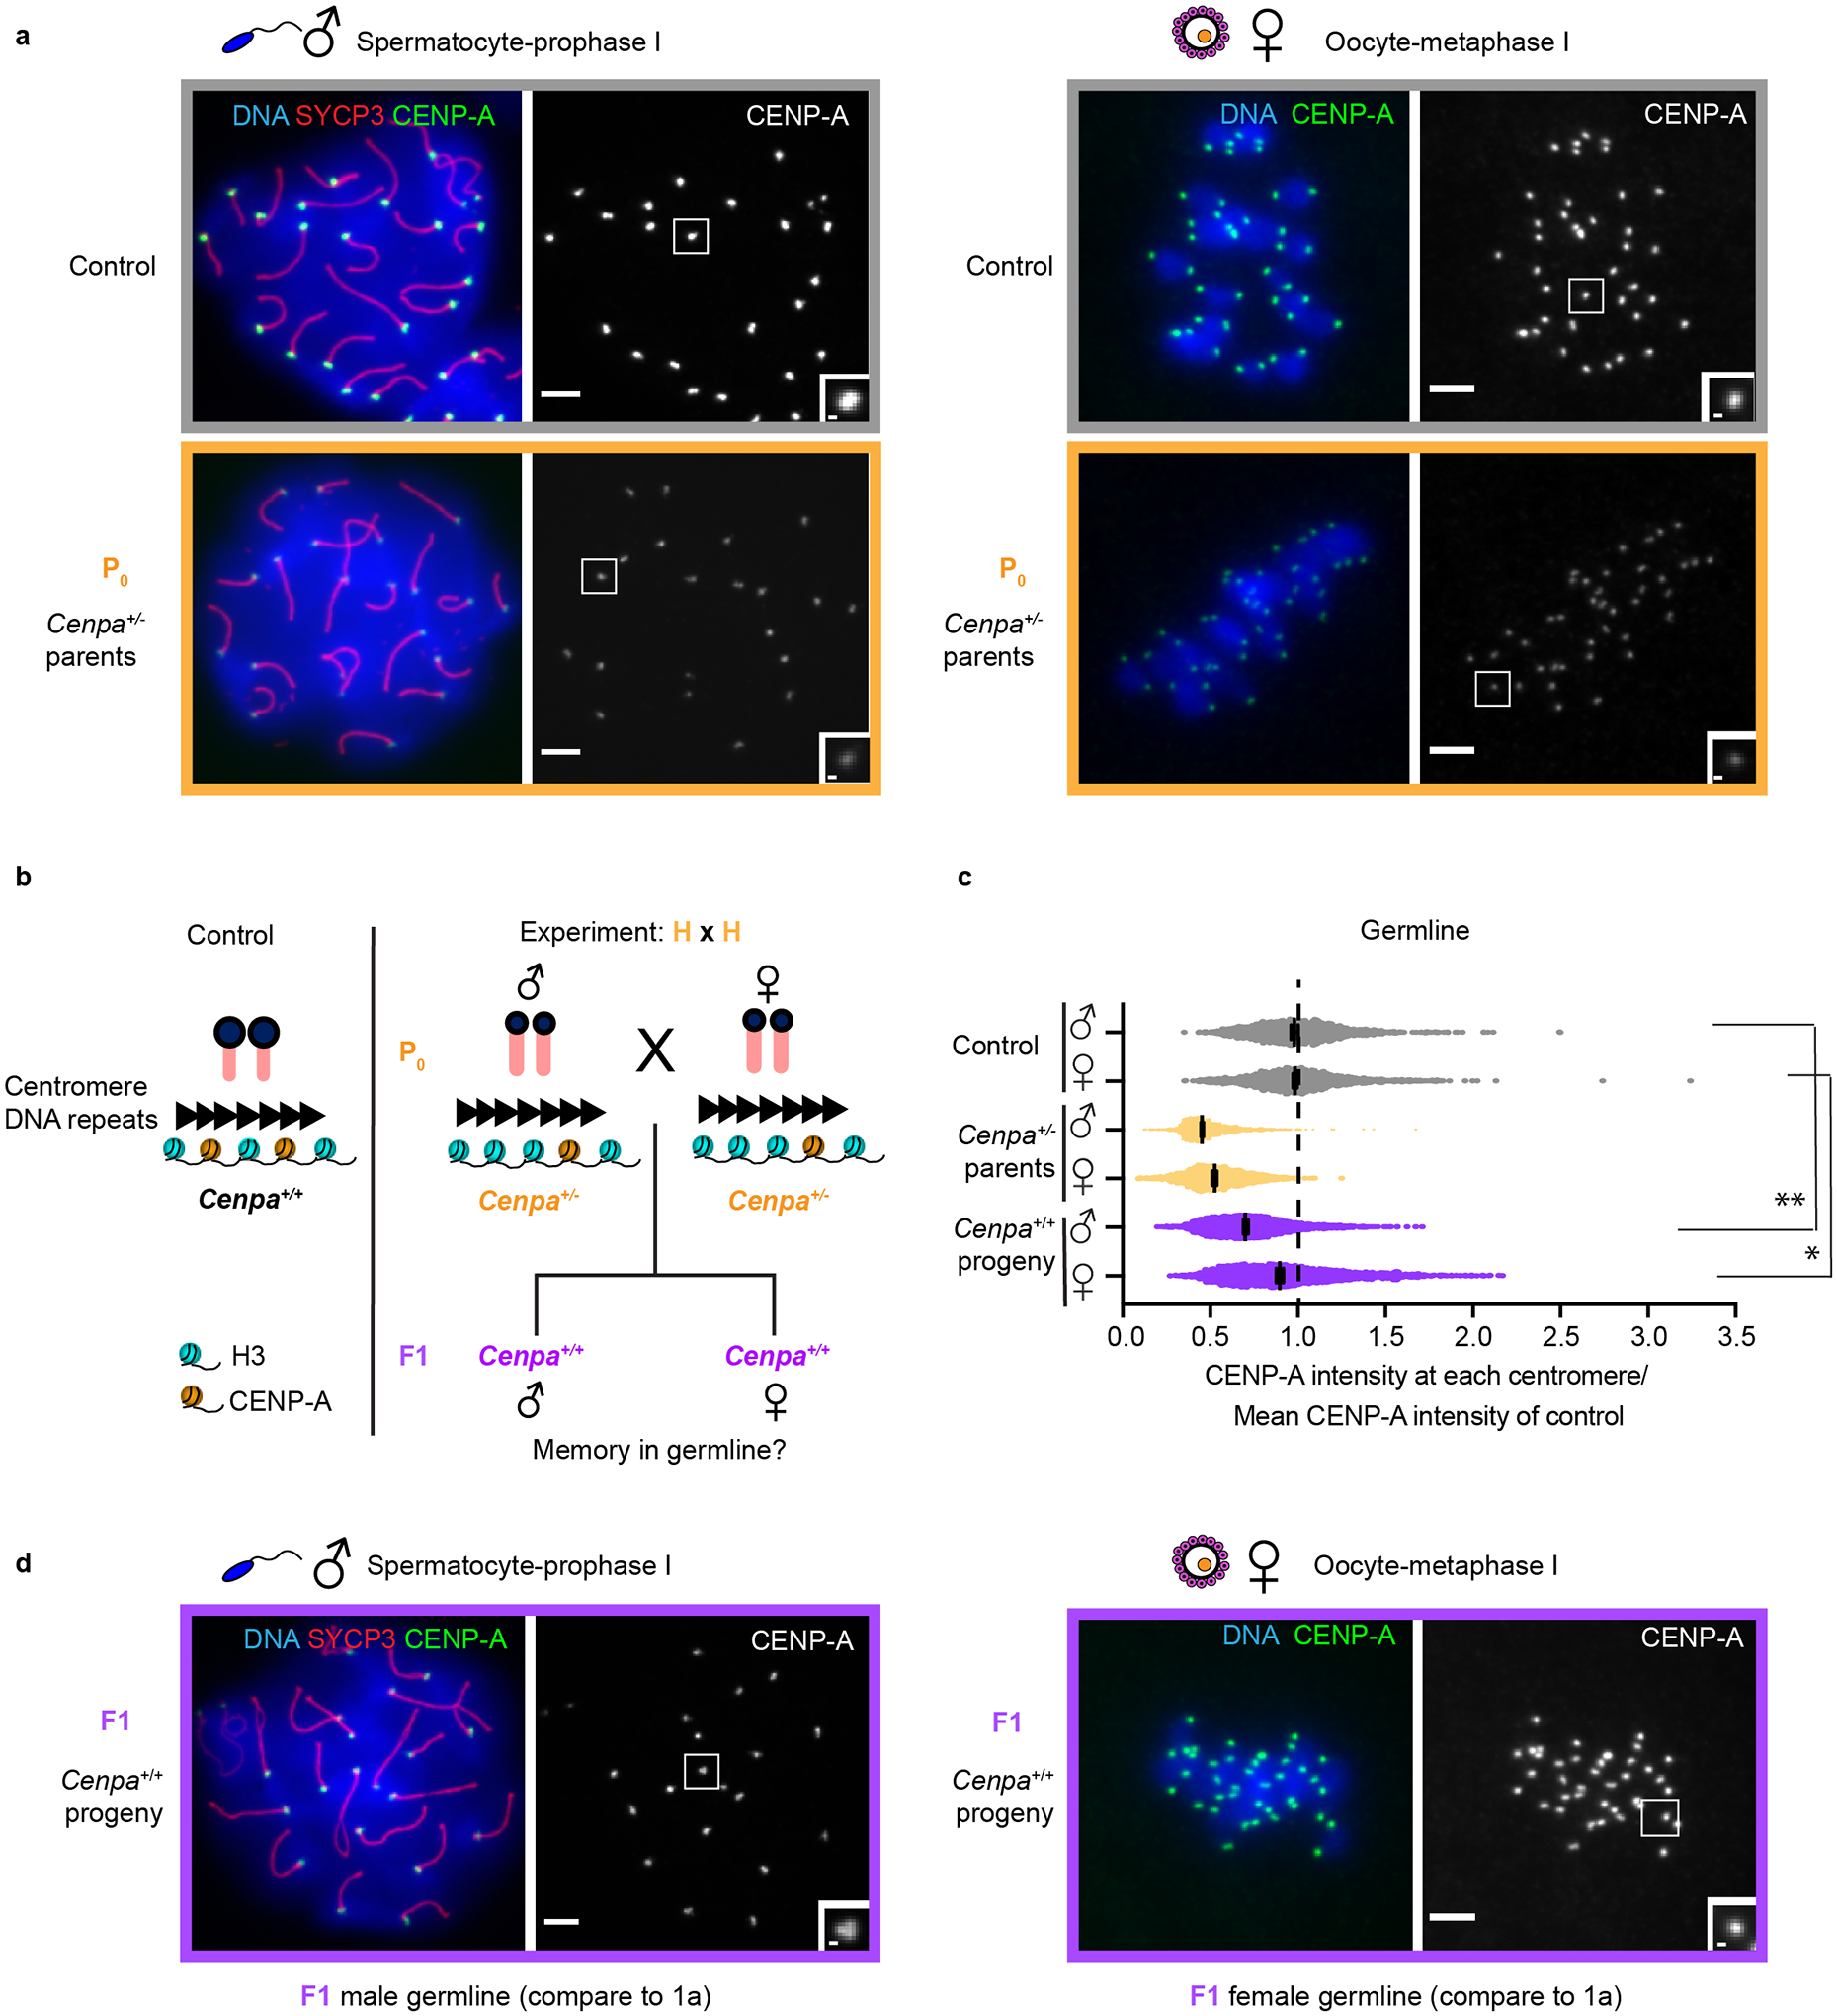
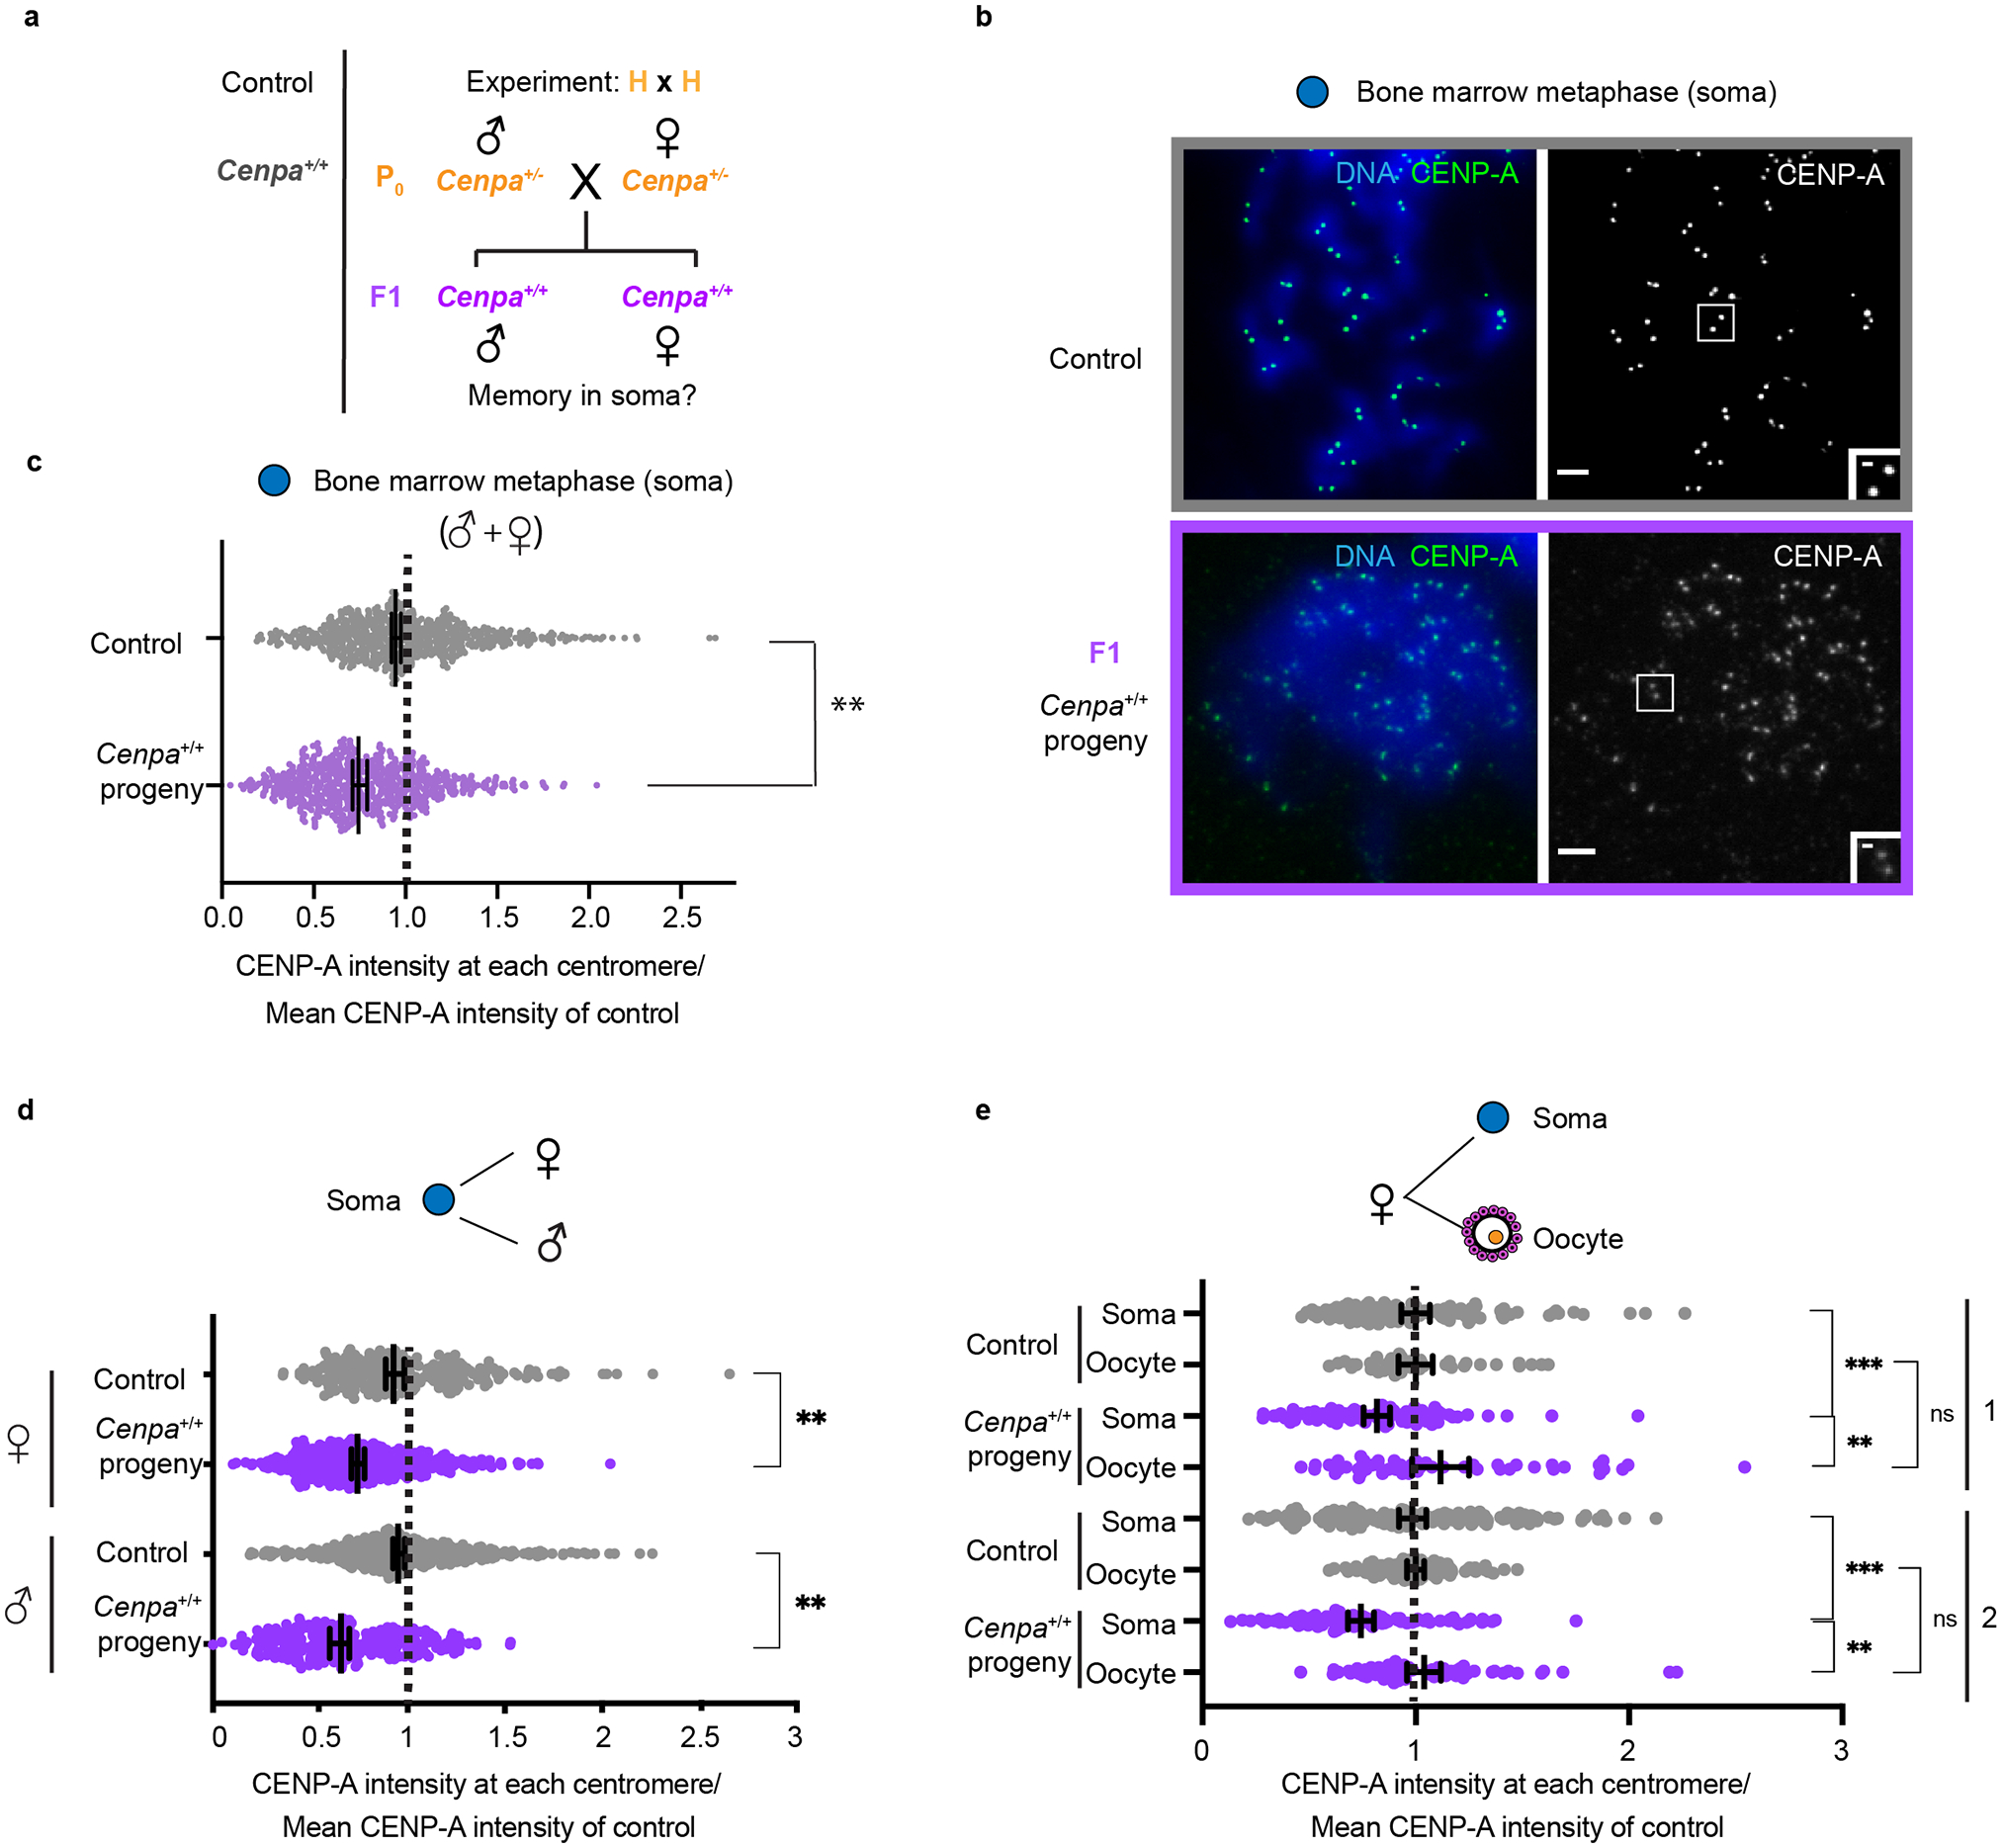
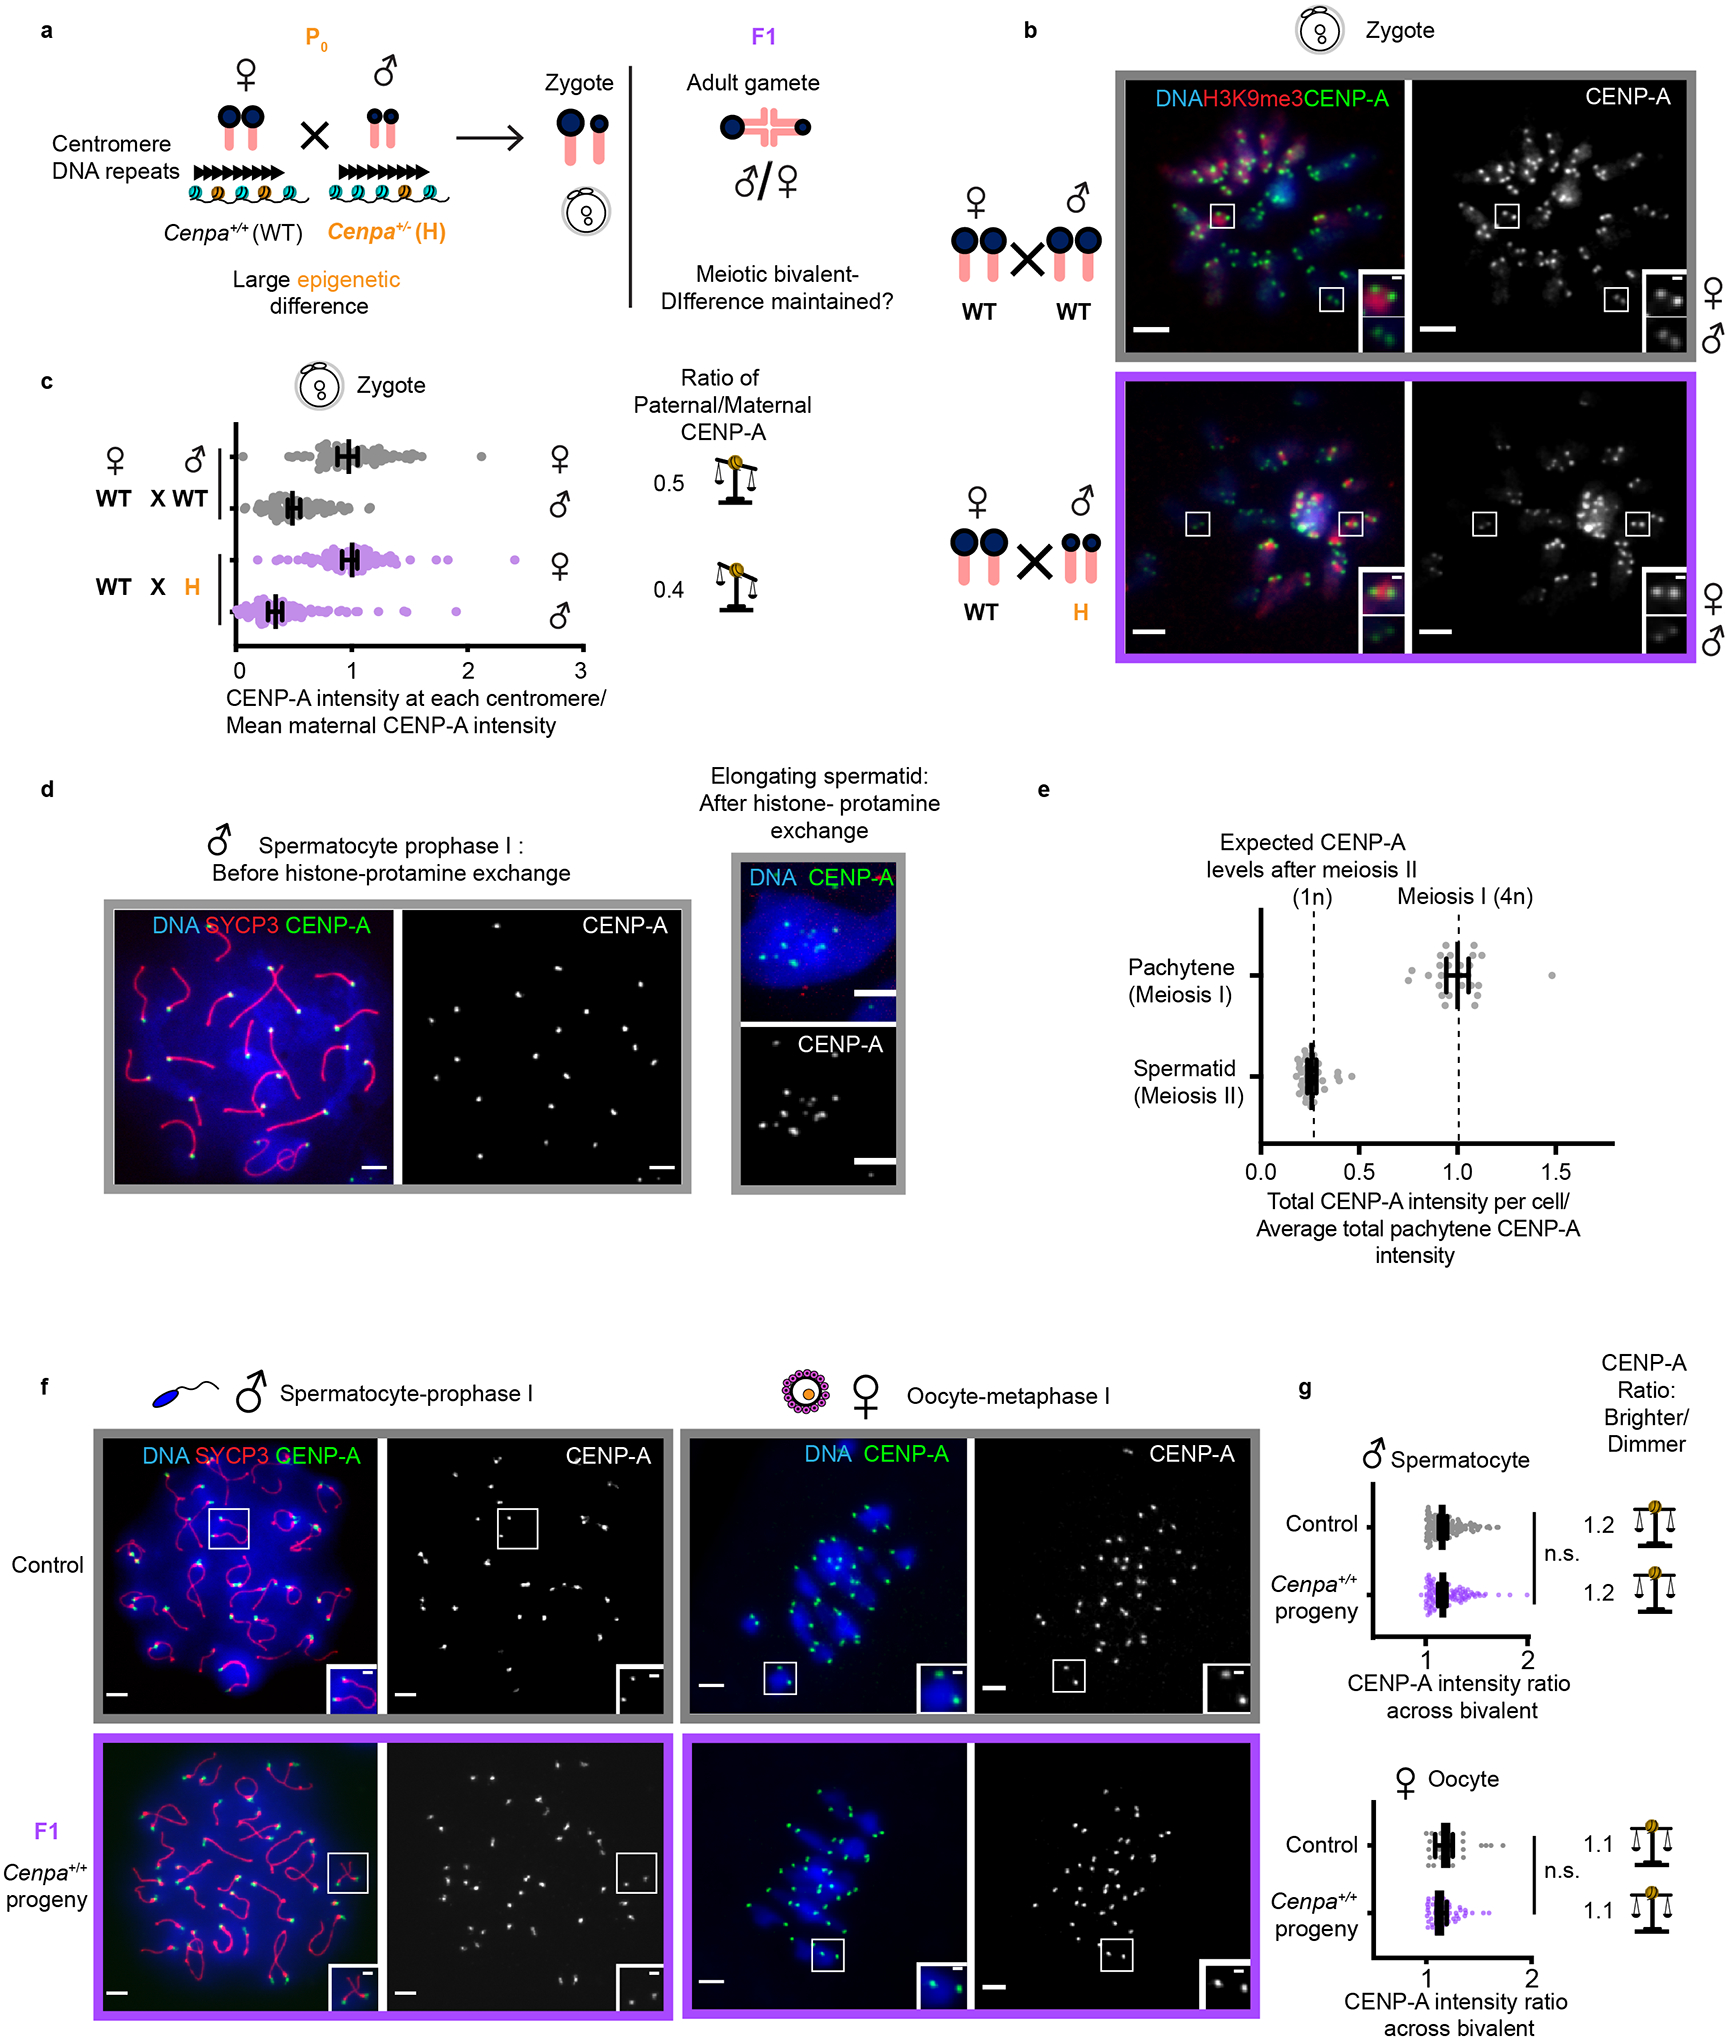
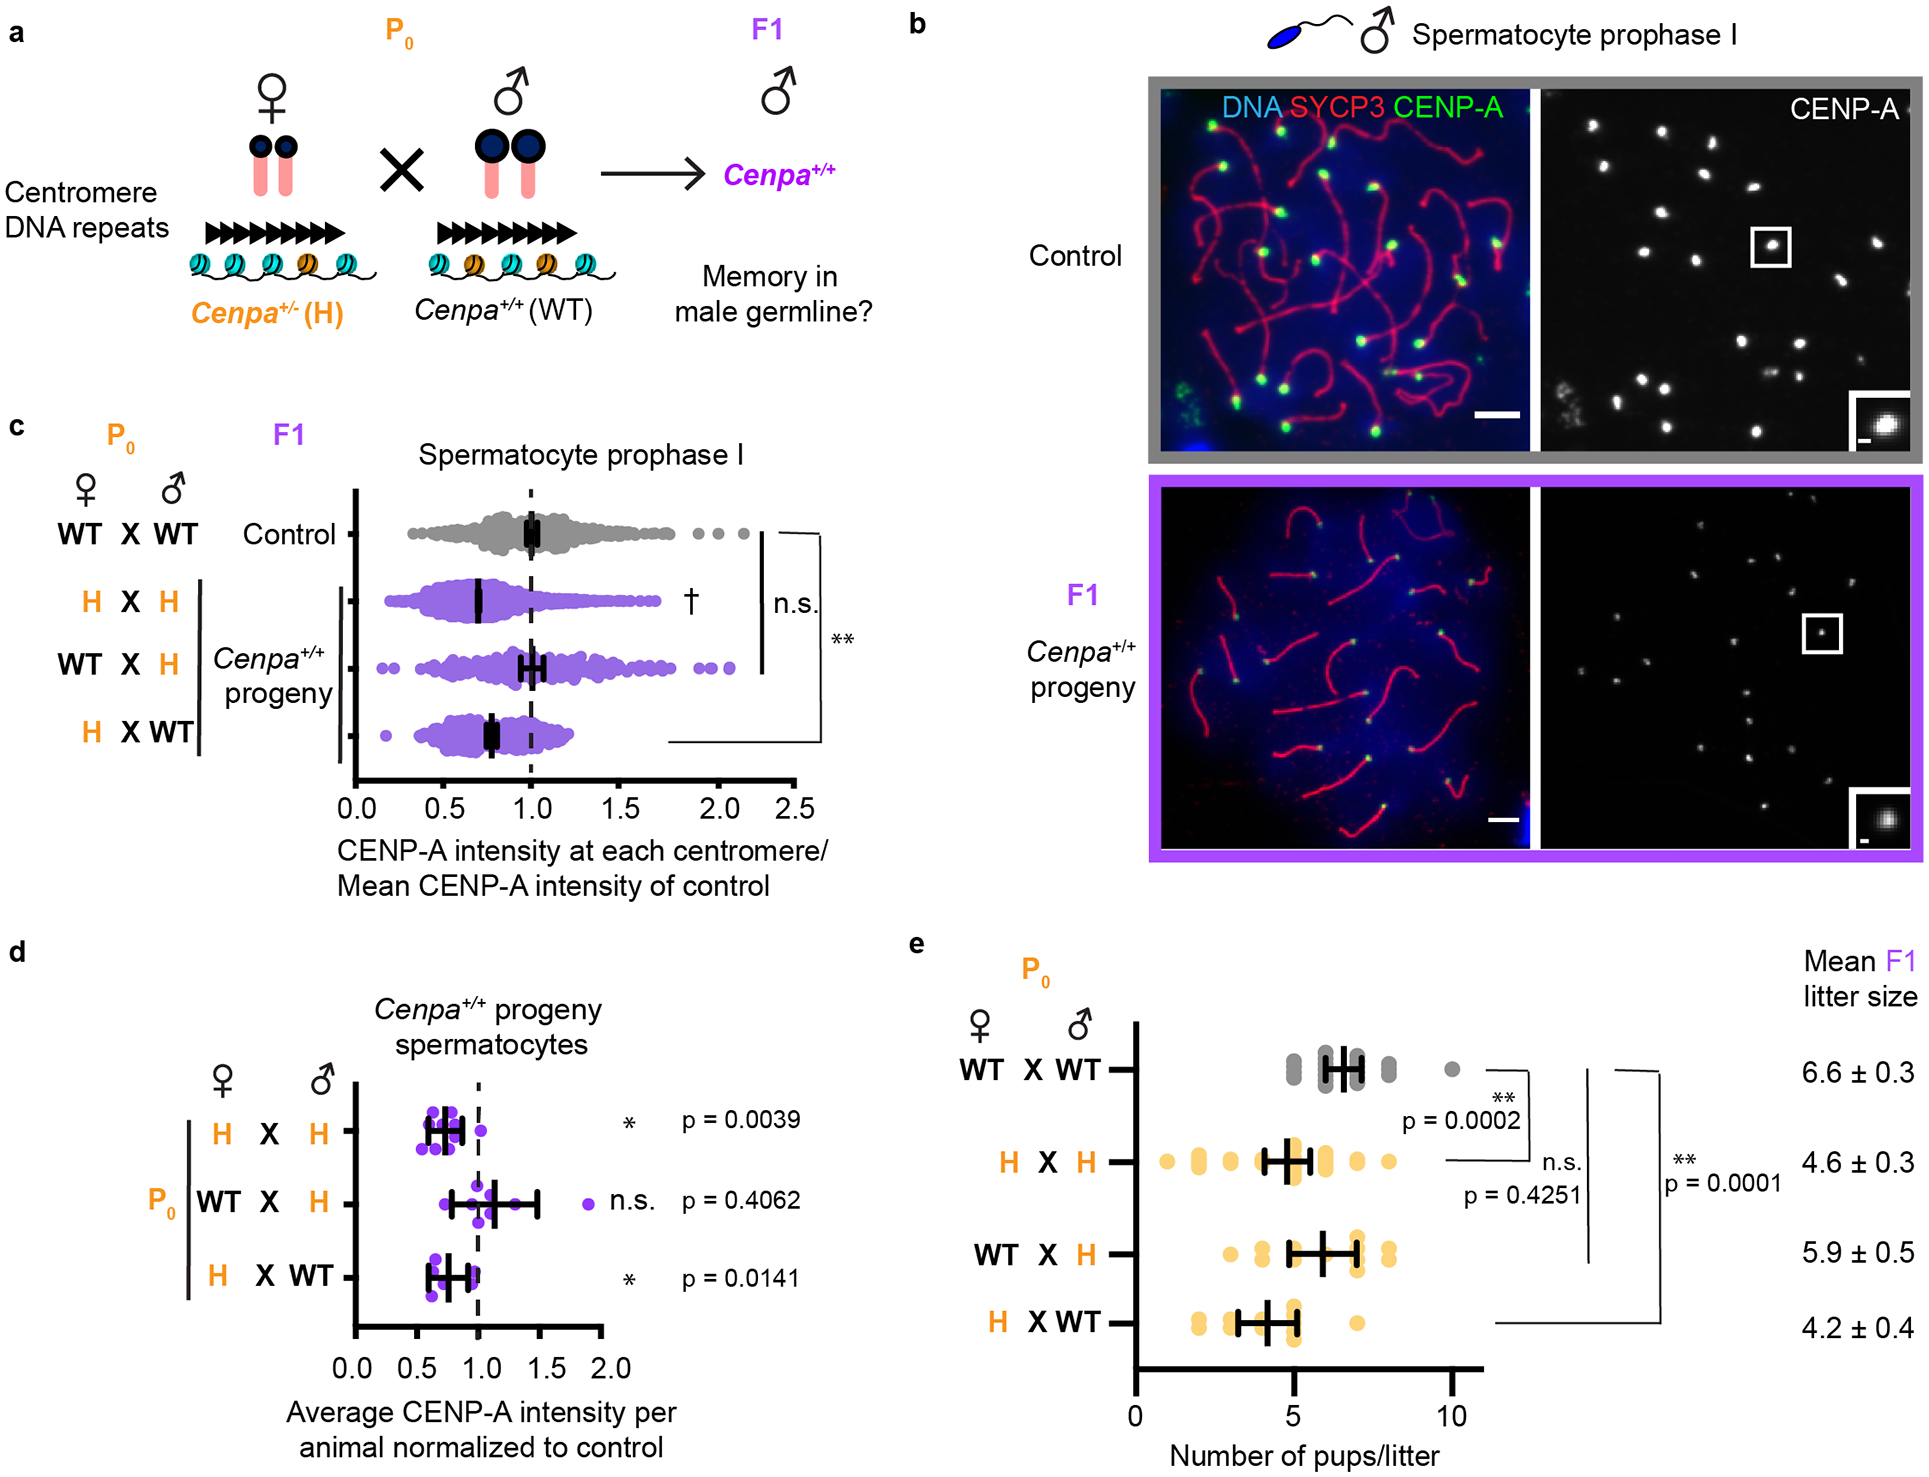
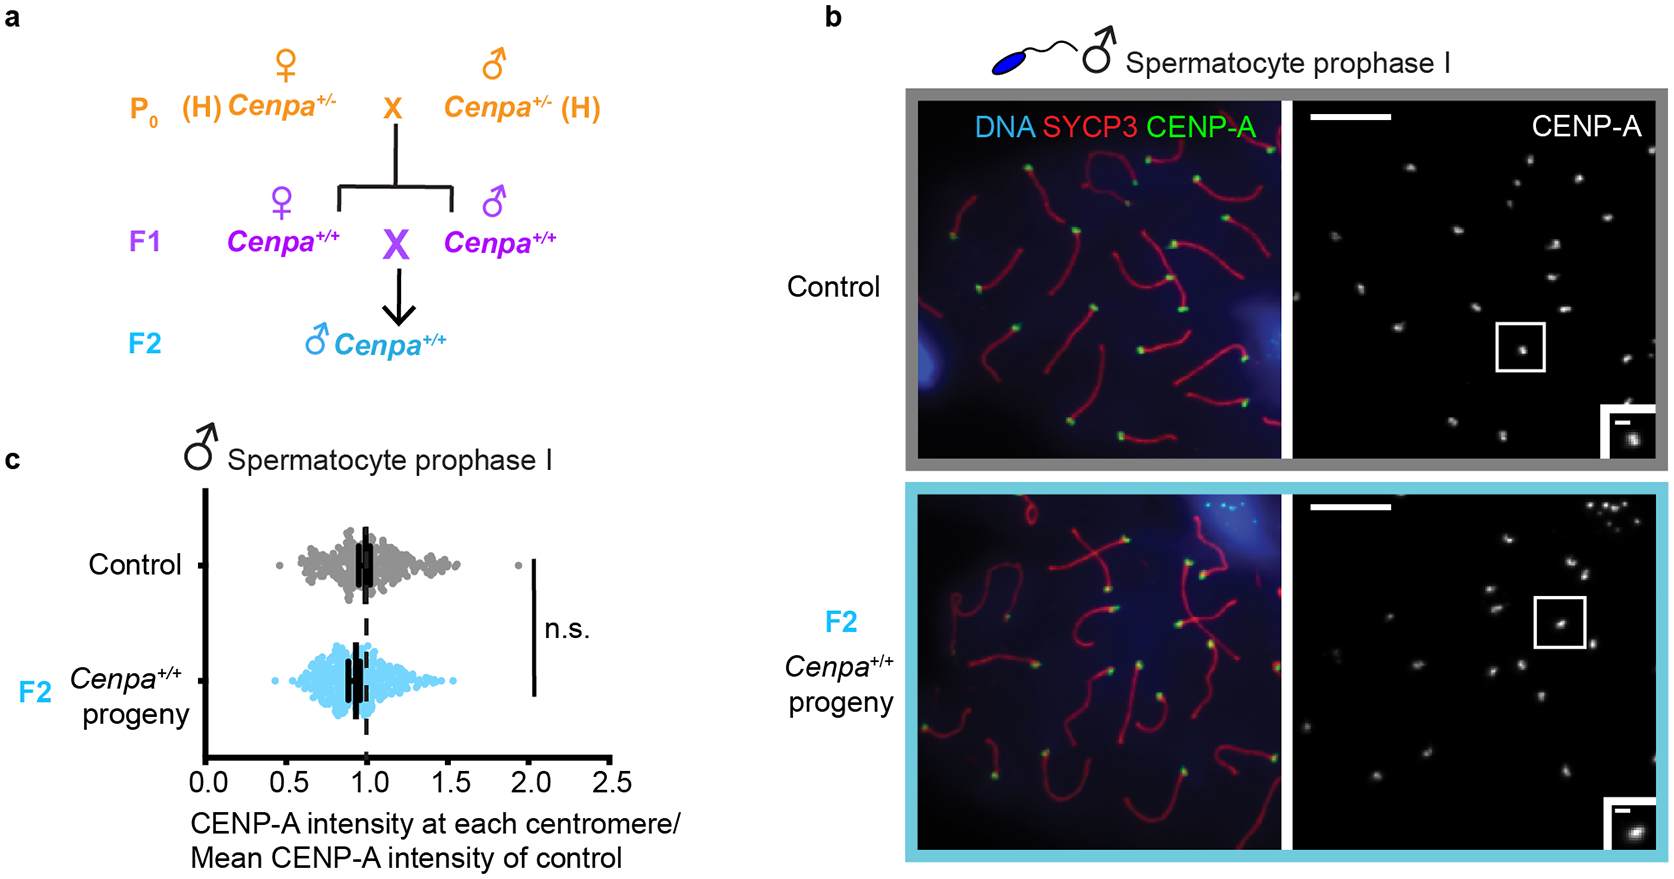
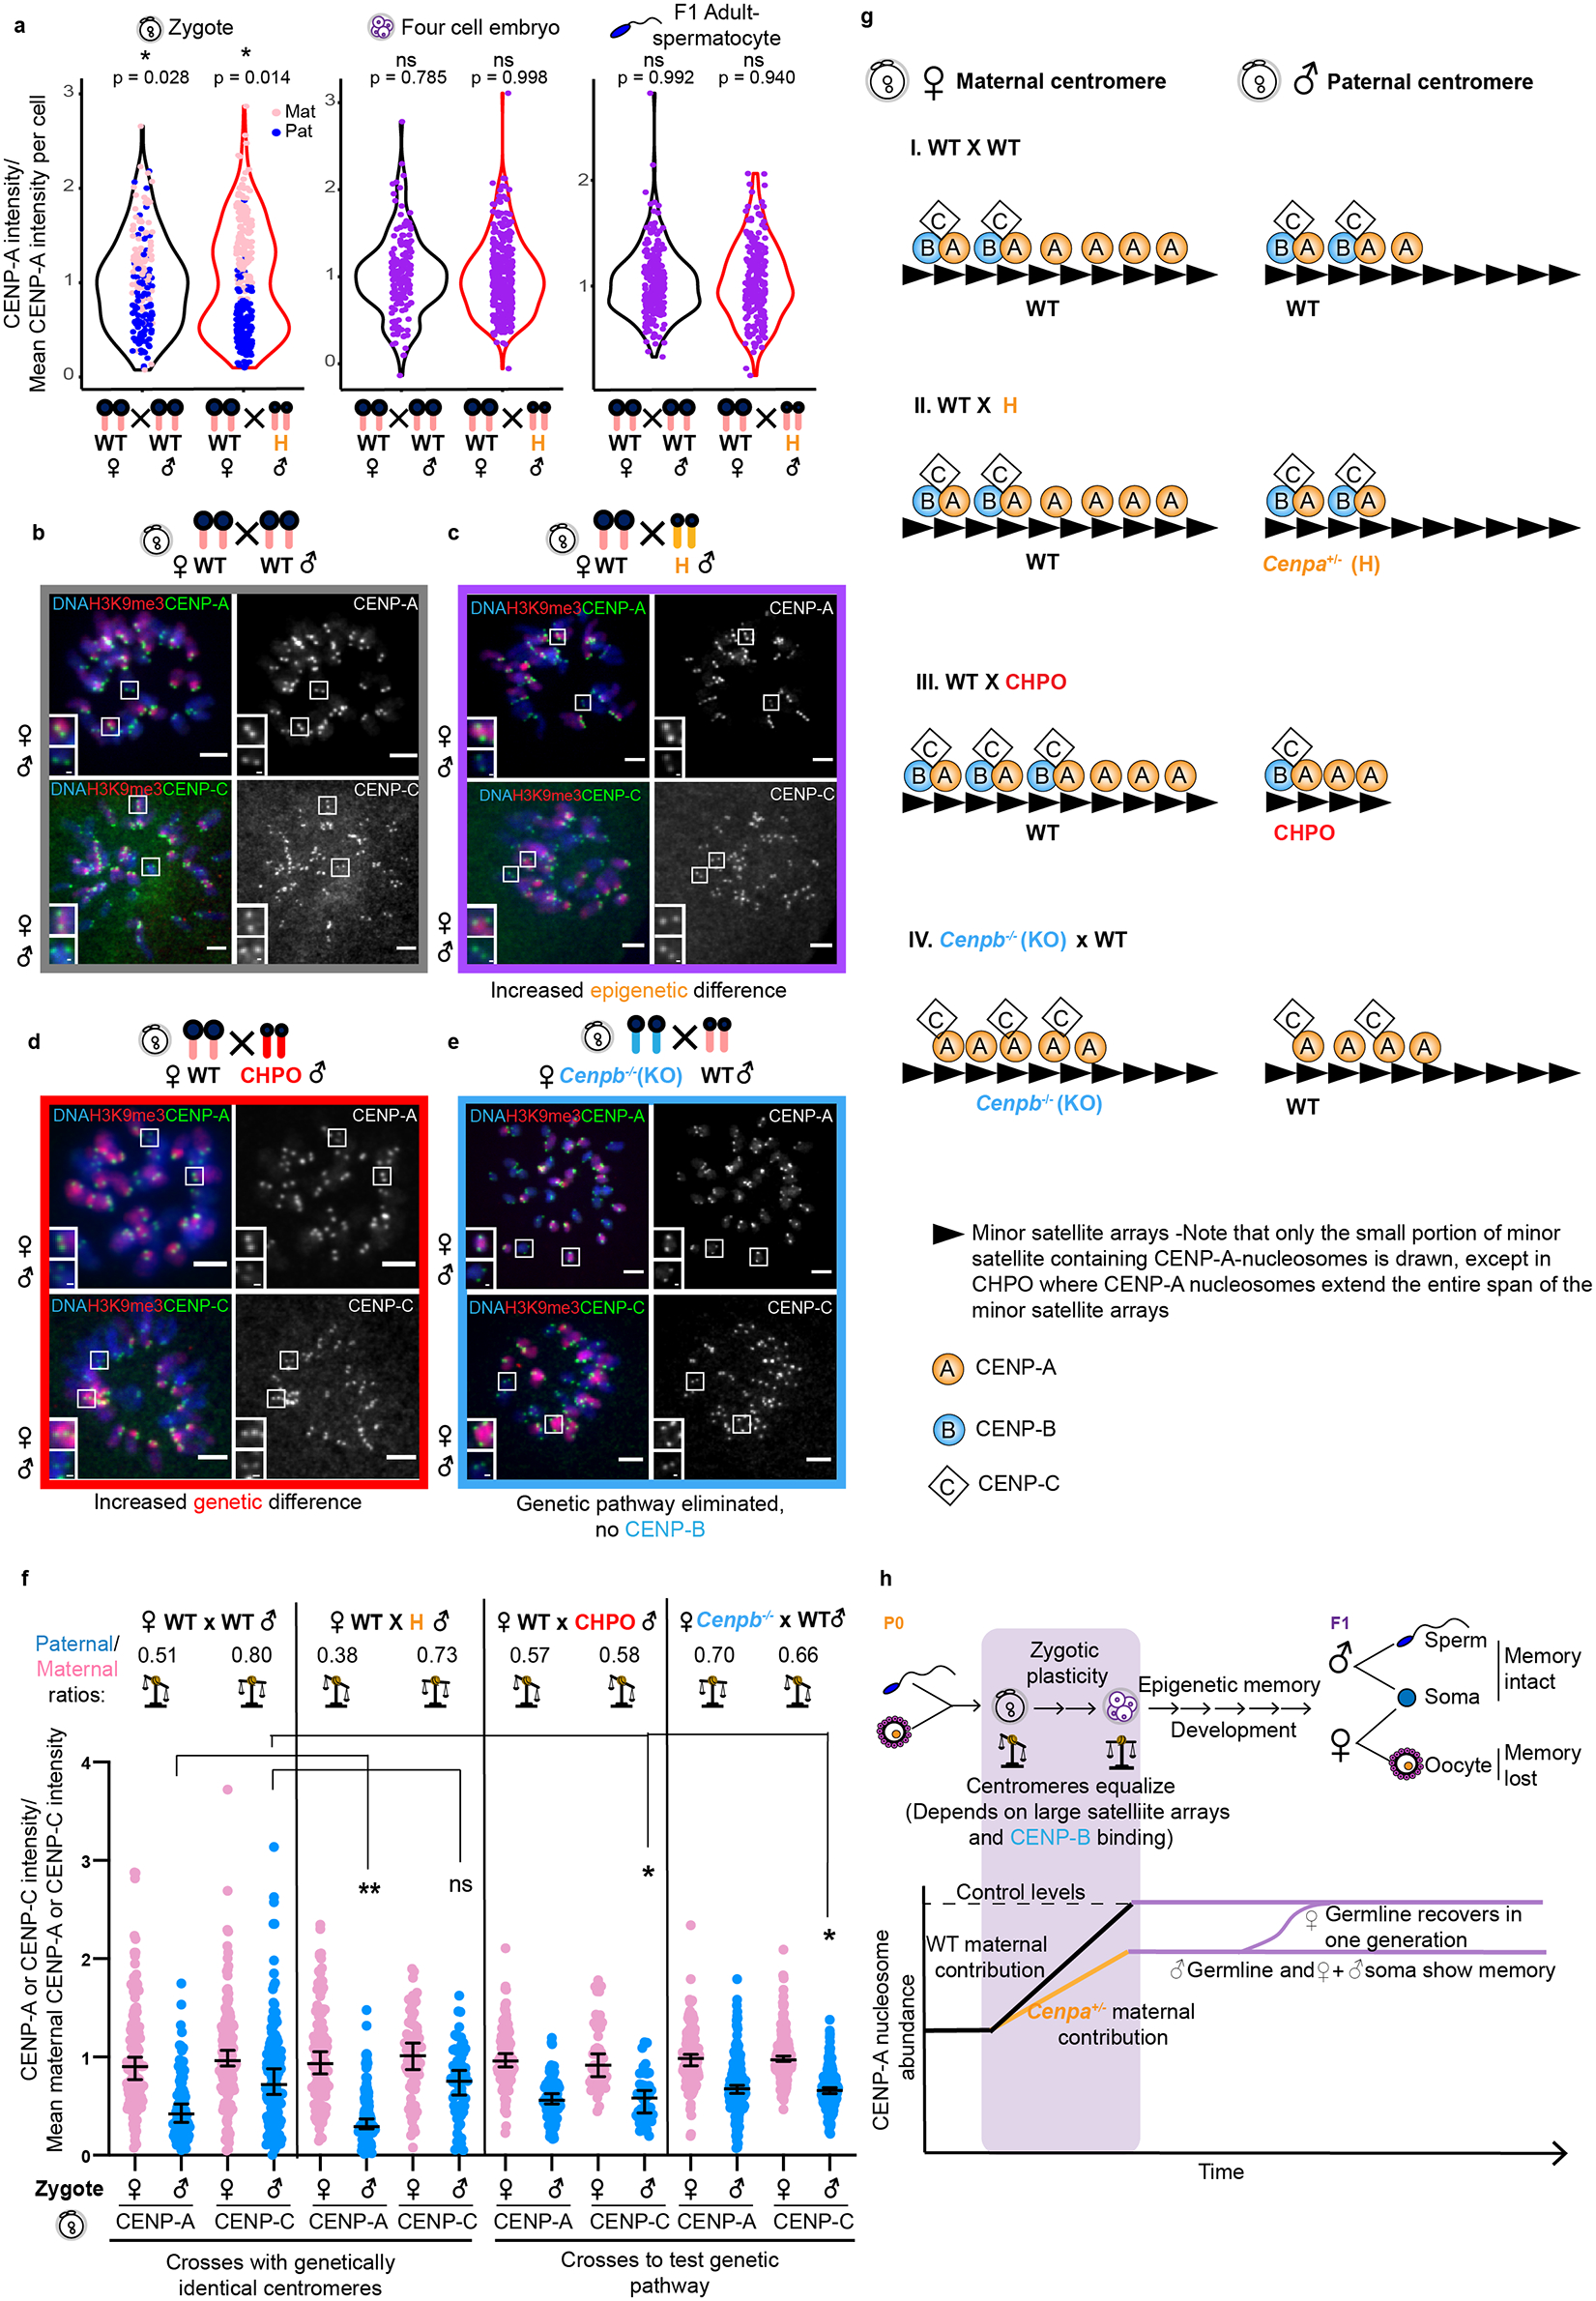
Centromeres are defined epigenetically by the histone H3 variant CENP-A. The propagation cycle by which pre-existing CENP-A nucleosomes serve as templates for nascent assembly predicts the epigenetic memory of weakened centromeres. Using a mouse model with reduced levels of CENP-A nucleosomes, we find that an embryonic plastic phase precedes epigenetic memory through development. During this phase, nascent CENP-A nucleosome assembly depends on the maternal Cenpa genotype rather than the pre-existing template. Weakened centromeres are thus limited to a single generation, and parental epigenetic differences are eliminated by equal assembly on maternal and paternal centromeres. These differences persist, however, when the underlying DNA of parental centromeres differs in repeat abundance, as assembly during the plastic phase also depends on sufficient repetitive centromere DNA. With contributions of centromere DNA and the Cenpa maternal effect, we propose that centromere inheritance naturally minimizes fitness costs associated with weakened centromeres or epigenetic differences between parents.


Conflict of interest statement

Competing interest declaration

The authors declare no competing interests.

Figures

Extended Data Fig. 1
Extended Data Fig. 1. CENP-A chromatin is reduced in the soma of Cenpa+/− heterozygous animals in the P0 generation
a, Bone marrow metaphase spreads: each pair of CENP-A foci represents sister centromeres in mitosis. Scale bars: 5 μm (main panel), 1μm (inset). b, Quantification of CENP-A foci intensities in control (grey) and P0 (yellow) generation in soma. N = 166, 170 centromeres (top to bottom). ** P<0.0001, Mann-Whitney U test (two tailed). Error bars: median ± 95% CI. Source numerical data are available in source data.
Extended Data Fig. 2
Extended Data Fig. 2. Weakened centromeres in the male germline are independent of meiotic stage
Because oocytes were analyzed at metaphase I and spermatocytes at prophase I (Fig. 1), we confirmed that F1 spermatocytes also show weakened centromeres at metaphase I. Images (a) and quantification (b) of F1 spermatocytes show CENP-A reduced to a similar level at metaphase I (70.54 ± 7.1% of control) as prophase I. Each of the CENP-A foci represents four centromeres (a pair of homologous chromosomes, each with two sisters). N = 330 (control), 284 (F1 progeny). Scale bars: 5 μm (main panel), 1μm (inset). Quantification of SYCP3 foci from the same cells (c) shows no decrease (114.90 ± 5.6% of control). N = 235 (control), 259 (F1 progeny). ** P<0.001, Mann-Whitney U Test (two tailed). Error bars: median ± 95% CI. Source numerical data are available in source data.
Extended Data Fig. 3
Extended Data Fig. 3. Littermate analysis showing that weakened centromeres persist in the male but not female germline
a, Data from Fig. 1c replotted as CENP-A levels per animal, averaged over all centromeres in each animal and normalized to controls (dashed line). N = 10,10,10, 9, 7 animals. The F1 male but not the female germline and the male and female soma are significantly lower than the controls **P<0.001, *P<0.05 n.s.: P>0.05, Wilcoxon signed sum rank test (two tailed). b, CENP-A quantifications in spermatocytes and oocytes from littermates from one set of parents. N = 121, 431, 60, 259, 246, 105 centromeres (top to bottom). Female germline levels are significantly elevated compared to littermate male germline levels. **P<0.0001, Mann-Whitney U Test (two tailed). Error bars: median ± 95% CI. Source numerical data are available in source data.
Extended Data Fig. 4
Extended Data Fig. 4. CENP-A nucleosomes are retained through the replacement of canonical nucleosomes with protamines during spermiogenesis
a, Quantification and b, images showing CENP-A levels are reduced to 42.7 ± 1.5% in spermatids from Cenpa+/− males compared to WT males, similar to the reduction measured in prophase spermatocytes (Fig. 1c). N = 20 (control), 32 (Cenpa+/−) spermatids. Error bars: median ± 95% CI. Scale bars: 5 μm (main panel), 1μm (inset). Source numerical data are available in source data.
Extended Data Fig. 5
Extended Data Fig. 5. Model to explain equalization of epigenetic differences and subsequent memory
a, Assumptions used for the modeling. b, Epigenetic inheritance of CENP-A as determined in cycling somatic cells in culture by replication coupled dilution and G1 reloading. c, Example calculation and graph for CENP-A assembly in the first two embryonic cell cycles for progeny of a WT × WT cross. For simplicity, initial CENP-A levels are set to 100 and 50 on the maternal and paternal centromeres, respectively, based on our measurements in zygotes (Fig. 3c). At each S-phase, CENP-A levels are diluted by half on each centromere, and we assume equal assembly on maternal and paternal centromeres in the following G1. Assembly in the first cell cycle depends on the maternal pool, set to 100 for a zygote from a WT female, giving an increase of 50 on both maternal and paternal centromeres. Assembly in the second cell cycle depends on the zygotic pool, which is set to 100 for a WT zygotic genotype. d, Graphs from similar calculations as b, for the designated crosses. Initial CENP-A levels are set to 50 for maternal centromeres from Cenpa+/− mothers and 40 for paternal centromeres from Cenpa+/− fathers, based on our measurements (Fig. 1c and Fig. 2c). Arrows indicate equal assembly on maternal and paternal centromeres. In the first cell cycle, assembly is from a maternal pool of 100 (black arrows) or 50 (yellow arrows) for WT or Cenpa+/− mothers, respectively. In the second cell cycle, assembly is from a zygotic pool of 100 (purple arrows), reflecting a WT zygotic genotype. Calculations show equalization by the four-cell stage in all crosses. Furthermore, crosses with reduced maternal contribution (H) equalize to a lower level, which is then remembered through development. Source numerical data are available in source data.
Extended Data Fig. 6
Extended Data Fig. 6. 3’ UTR of Cenpa message has hallmarks of dormant maternal mRNA
a, Polyadenylation (addition of a poly (A) tail) of mRNA is a mechanism to control gene expression. Nuclear polyadenylation is an essential part of post-transcriptional processing of most mRNAs, dictated by the ubiquitous cis-element 3’ UTR hexameric motif AATAAA (nuclear polyadenylation element, NPE). Dormant maternal mRNAs are deposited in the oocyte with short poly(A) tails and are translationally inactive. After fertilization, these maternal mRNAs undergo translation by elongation of the poly(A) tail, controlled by a cytoplasmic polyadenylation element (CPE) usually present within 100 nt upstream of the NPE. We find conserved CPEs in the mouse, human and frog Cenpa 3’ UTRs (CPE I = TTTTAT or CPE II = TTTTAA) upstream of the NPE as expected for dormant maternal mRNAs. b, Analysis of 12 sequenced rodent species reveals that CPEs (CPE I in bold boxes and CPE II in dashed boxes) are present upstream of the NPE in every species as expected for a maternal effect gene.
Extended Data Fig. 7
Extended Data Fig. 7. Symmetric distribution of H3K9me3 at the four-cell stage
Representative cell from four-cell embryos for each of the two denoted crosses with H3K9me3 (red), CENP-A (green) and DNA (blue). H3K9me3 is present on both maternal and paternal chromatin at this stage, in contrast to zygotes (Fig. 3b and Fig. 6b–e). Scale bars: 5 μm.
Extended Data Fig. 8
Extended Data Fig. 8. CENP-A intensity distribution changes from bimodal to unimodal in early embryogenesis
Graphs show locations of the modes in each distribution from Fig. 6a. a, The WT × WT and WT × H♂ zygote distributions contain two modes (dashed lines) on either side of a central antimode (dip, pointed lines) characteristic of bimodal distributions. The separation between the two modes is greater in the WT × H♂ cross as expected. In addition, the ratios of the values of the two modes (x-axis) denoted under each cross agree well with the ratios of paternal to maternal centromere intensities calculated in Figs. 3c and 6f. b,c, Similar plots of four-cell embryos (b) from the same crosses show a single central mode characteristic of a unimodal population, like the F1 adult spermatocytes (c), which represents a uniform centromere population. The ratio of the modes in bimodal or the value of the mode in unimodal distribution is indicated below the graphs. Source numerical data are available in source data.
Extended Data Fig. 9
Extended Data Fig. 9. Genetic pathway for centromere equalization
a, Quantifications of maternal (pink) and paternal (blue) CENP-A and CENP-C intensities in zygotes from a WT × WT control for the Cenpb−/− strain, with average paternal/maternal CENP-A or CENP-C ratios above; N = 46, 42, 237, 231 centromeres (left to right). Error bars: median ± 95% CI. Although these animals are in a CF-1/C57BL/6J/DBA/2J background, CENP-A and CENP-C ratios in WT zygotes using mothers from this background are consistent with those of C57BL/6J alone (Fig. 6e,f). Source numerical data are available in source data.
Fig. 1:
Fig. 1:. Evidence for epigenetic centromere memory through mouse reproduction.
a, Spermatocytes at prophase I and oocytes at metaphase I for the P0 generation compared to control. Each of the CENP-A foci represents four centromeres in spermatocytes (a pair of homologous chromosomes, each with two sisters) or two sister centromeres in oocytes. SYCP3, a synaptonemal complex element, marks prophase I spermatocytes. b, Mating scheme to test memory in the F1 generation. c, Quantification of CENP-A foci intensities in control (grey), P0 (yellow) and F1 (purple) generations in germline (a and d). N = 1576, 1608, 1722, 1412, 1836, 1473 centromeres (top to bottom). **/* P<0.0001/P< 0.05, Mann-Whitney U test (two-tailed). Error bars: median ± 95% CI. See also Supplementary Table 1. d, Spermatocyte and oocyte at prophase I and metaphase I, respectively (F1 generation). e, Bone marrow metaphase spreads (control and F1 generation) are representative of both male and females: each pair of CENP-A foci represents sister centromeres in mitosis. Scale bars: 5 μm (main panel), 1μm (inset). Source numerical data are available in source data.
Fig. 2:
Fig. 2:. Male and female soma show reduced CENP-A in contrast to oocytes.
a, Mating scheme to test memory in the soma in the F1 generation. b, Bone marrow metaphase spreads (control and F1 generation) are representative of both male and females: each pair of CENP-A foci represents sister centromeres in mitosis. c, Quantification of CENP-A foci intensities in control (grey) and F1 (purple) generations in male and female soma combined. N = 642, 684 centromeres (top to bottom). **/* P<0.0001/P< 0.05, Mann-Whitney U test (two-tailed). d, Pooled male and female CENP-A intensities from Fig. 2c, replotted with male and female separated to show that both contain weakened centromeres. N = 251, 433, 390, 251 centromeres (top to bottom). e, Quantification of CENP-A chromatin showing weakened centromeres in the soma compared to oocytes from the same female. Two independent experiments (1, 2) are shown, each comparing a single F1 animal (from H × H cross) to controls. N = 112, 44, 94, 51, 169, 89, 98, 68 centromeres (top to bottom). **/*= P<0.001/P<0.01, Mann-Whitney U test (two tailed). Error bars: median ± 95% CI. Scale bars: 5 μm (main panel), 1μm (inset). Source numerical data are available in source data.
Fig. 3:
Fig. 3:. Epigenetic differences between parental centromeres are not maintained.
a, Mating scheme to create epigenetic differences between maternal and paternal centromeres in F1. b, Zygotes (one-cell embryos) from WT × WT (control) and WT × H♂ crosses. Each pair of CENP-A foci represents sister centromeres in mitosis. Insets show 1.5x magnified maternal and paternal centromeres distinguished by H3K9me3. c, Quantification of maternal and paternal CENP-A intensities are shown in zygotes combined from two independent experiments with ratios designated for each cross; N = 89, 90, 145, 143 centromeres (top to bottom). The balance symbol indicates the extent of epigenetic differences between parental centromeres. d, Representative images of spermatocyte pachytene (prophase of meiosis I, 4n) and an elongating spermatid (after completing meiosis II and histone-protamine exchange,, 1n) from control (Cenpa+/+) animals. e, Quantification of total CENP-A levels per cell; N = 26 spermatocytes or 35 spermatids. The observed reduction to 25% in spermatids (1n) compared to prophase I spermatocytes (4n) is expected if there is no loss during the histone-protamine exchange. f, Diplotene spermatocyte spreads and metaphase I oocytes in F1. During diplotene, centromeres of paired homologous chromosomes (marked with SYCP3 in red) can be resolved. Each inset shows a pair of homologous chromosomes (bivalent), and each of the CENP-A foci represents two sister centromeres. g, Quantification of the ratio of CENP-A foci intensities across a meiotic bivalent (brighter/dimmer) in male and female gametes from d, N = 122, 124, 30, 56 bivalents (top to bottom). n.s.: P>0.05, Mann Whitney U test (two tailed). Error bars: median ± 95% CI. Scale bars: 5 μm (main panel), 1μm (inset). Source numerical data are available in source data.
Fig. 4:
Fig. 4:. Centromere strength depends on maternally inherited CENP-A.
a, Mating scheme to test Cenpa maternal contribution. b, Prophase I spermatocytes from control and F1 progeny of H × WT♂ cross. Each of the CENP-A foci represents four centromeres from a pair of homologous chromosomes. Scale bars: 5 μm (main panel), 1μm (inset). c, Quantifications of CENP-A foci intensities in F1 spermatocytes from the indicated crosses. Representative images shown in Fig. 1d (H × H, data replotted for comparison from Fig. 1c), Fig. 3f (WT × H♂), and Fig. 4b (H × WT♂). N = 536, 1836, 267, 604 centromeres (top to bottom). d, Data from Fig. 4c replotted by averaging over all centromeres from spermatocytes in each animal, normalized to controls (dashed line). N = 10, 8, 6 animals (top to bottom). e, Litter sizes from the indicated crosses. N = 21, 26, 12, 12 litters (top to bottom). Mean ± S.E.M. for each cross is shown next to the graph. *P<0.05, n.s.: P>0.05, Wilcoxon signed sum rank test (two tailed). ** P<0.0001, n.s. P>0.05, Mann-Whitney U test (two tailed). Error bars: median ± 95% CI. Source numerical data are available in source data.
Fig. 5:
Fig. 5:. CENP-A chromatin recovers in adult male F2 progeny from Cenpa+/+ WT F1 parents.
a, Mating scheme to generate F2 generation from F1 with epigenetically weakened centromeres and wild type genotype. b, Prophase I spermatocytes from control and F2 males. Each of the CENP-A foci represents four centromeres from a pair of homologous chromosomes. Scale bars: 5 μm (main panel), 1μm (inset). c, Quantification of CENP-A foci intensities. N = 276 (control), 328 (F2) centromeres. n.s. P>0.05, Mann-Whitney U test (two tailed). Error bars: median ± 95% CI. Source numerical data are available in source data.
Fig. 6:
Fig. 6:. Genetic contributions to centromere equalization in early embryogenesis.
a, Combined violin and dot plots for zygotes, four cell embryos and adult spermatocytes showing the distributions of CENP-A intensities. Data for zygotes and spermatocytes are replotted from Fig. 3c and 1c, respectively. N = 192, 271, 164, 322, 240, 214 centromeres (left to right). Dot plots are colored for zygotes, where parental origin can be determined. *=‘modetest’ for unimodality (two tailed). b-c, Images of CENP-A or CENP-C staining in zygotes with either moderate (WT × WT) or enhanced (WT × H♂) epigenetic differences between maternal and paternal centromeres, distinguished by H3K9me3. Each pair of CENP-A or CENP-C foci represents sister centromeres in mitosis. d-e, Images of CENP-A or CENP-C staining in zygotes from the indicated crosses manipulating the genetic pathway. Scale bars: 5 μm (main panel), 1μm (inset). f, Quantifications of maternal (pink) and paternal (blue) CENP-A and CENP-C intensities in zygotes from the designated crosses, with average paternal/maternal CENP-A or CENP-C ratios above; N = 132, 90, 162, 157, 123, 112, 76, 66, 120, 116, 54, 45, 164, 172, 218, 217 centromeres (left to right). **/* P<0.0001/P< 0.05, Mann-Whitney U test (two tailed). Error bars: median ± 95% CI. g, Model for epigenetic and genetic contributions to CENP-C binding via CENP-A and CENP-B in zygotes. I. WT × WT cross: maternal centromeres have more CENP-A nucleosomes than paternal centromeres (Fig. 3c), but CENP-B is equally distributed between genetically identical maternal and paternal centromeres. We propose that CENP-B does not occupy all CENP-B boxes, and that CENP-C is limited relative to CENP-A and preferentially binds to CENP-A nucleosomes that are associated with CENP-B, thereby equalizing maternal and paternal centromeres. Note that only the small portion of minor satellite containing CENP-A-nucleosomes is drawn. II. WT × H cross: CENP-A nucleosomes are reduced on the paternal chromatin but still enough to recruit CENP-B/C. CENP-A asymmetry increases, but CENP-C remains symmetric. III. WT × CHPO cross: paternal CHPO centromeres have fewer minor satellite repeats and fewer CENP-B boxes. Most CENP-B therefore associates with maternal centromeres, providing more binding sites for CENP-C and increasing its asymmetry. IV. Cenpb−/− × WT: CENP-C binds to any available CENP-A nucleosomes, leading to CENP-C asymmetry matching CENP-A asymmetry. h, Summary of changes in centromeric chromatin at weakened paternal centromeres with WT zygotic genotype and either WT or reduced maternal contribution. See discussion. Note that weakened maternal centromeres would presumably lead to similar outcomes but are difficult to experimentally manipulate without also reducing the maternal contribution. Source numerical data are available in source data.

Similar articles

Cited by

References

    1. Kixmoeller K, Allu PK & Black BE The centromere comes into focus: from CENP-A nucleosomes to kinetochore connections with the spindle. Open Biol 10, 200051 (2020). - PMC - PubMed
    1. Dumont M & Fachinetti D DNA Sequences in Centromere Formation and Function. Prog Mol Subcell Biol 56 305–336 (2017). - PubMed
    1. Chmátal L, Schultz RM, Black BE & Lampson MA Cell Biology of Cheating-Transmission of Centromeres and Other Selfish Elements Through Asymmetric Meiosis. Prog Mol Subcell Biol 56 377–396 (2017). - PubMed
    1. Iwata-Otsubo A et al. Expanded Satellite Repeats Amplify a Discrete CENP-A Nucleosome Assembly Site on Chromosomes that Drive in Female Meiosis. Curr. Biol 27, 2365–2373.e8 (2017). - PMC - PubMed
    1. Akera T, Trimm E & Lampson MA Molecular Strategies of Meiotic Cheating by Selfish Centromeres. Cell 178, 1132–1144.e10 (2019). - PMC - PubMed

Publication types

MeSH terms

LinkOut - more resources