

Precision size and refractive index analysis of weakly scattering nanoparticles in polydispersions
- PMID: 35534632
- PMCID: PMC9119850
- DOI: 10.1038/s41592-022-01460-z
Precision size and refractive index analysis of weakly scattering nanoparticles in polydispersions
Abstract
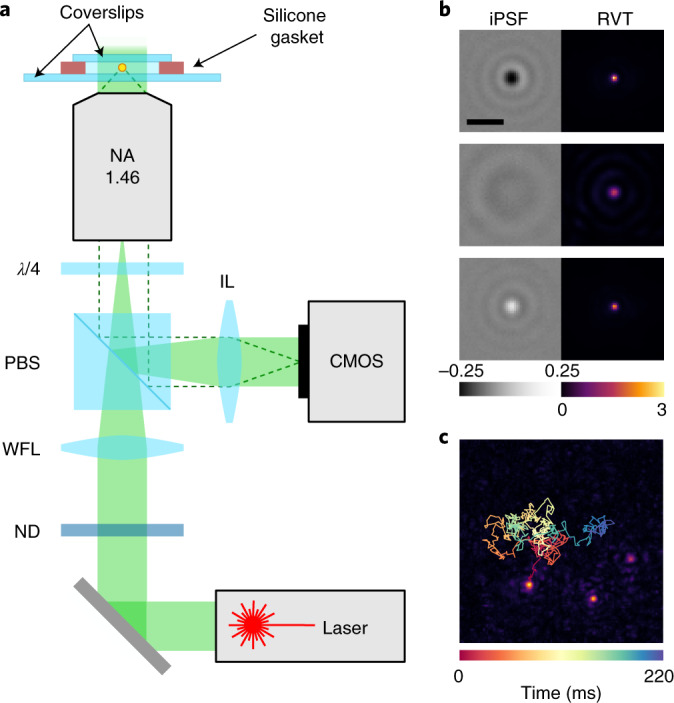
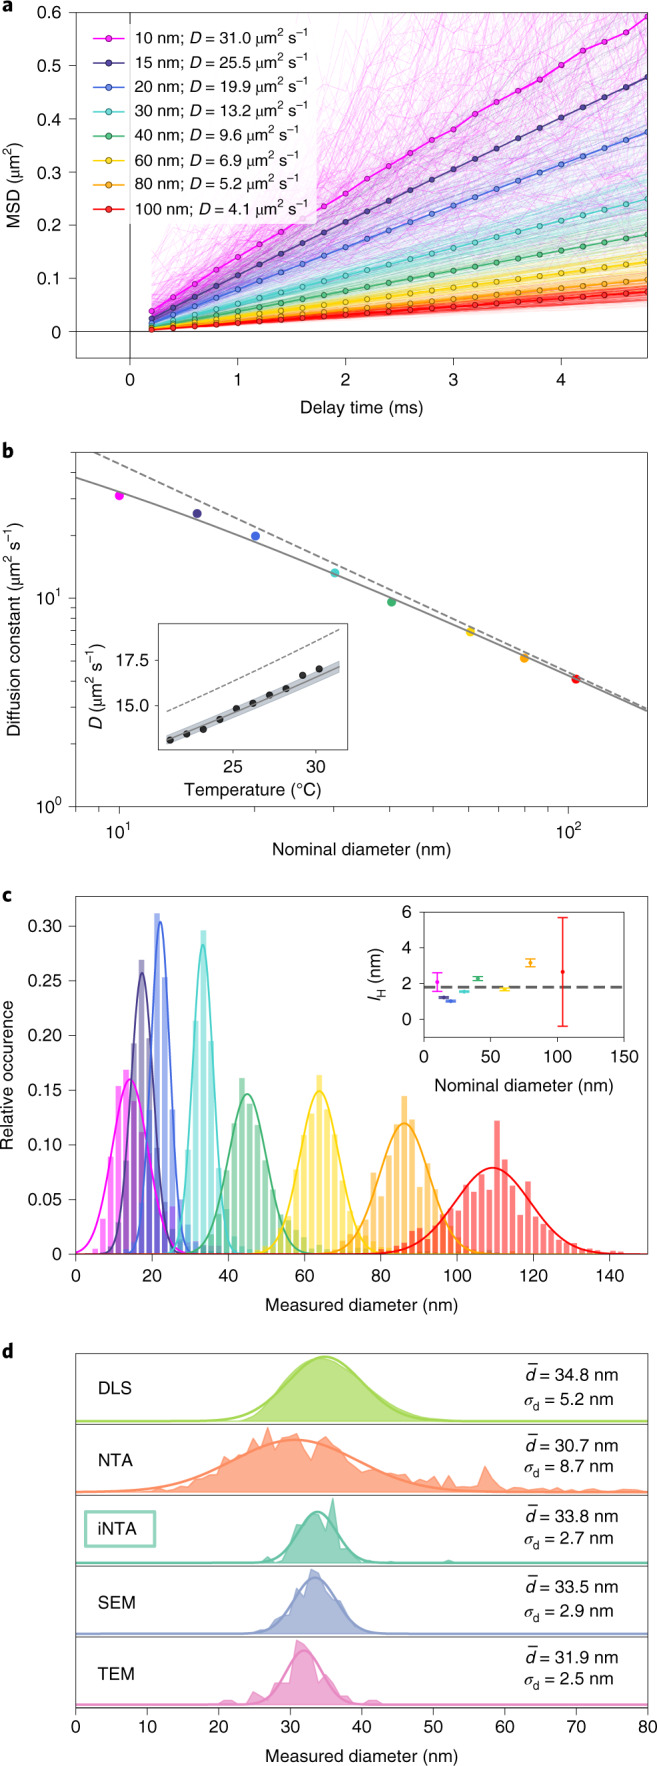
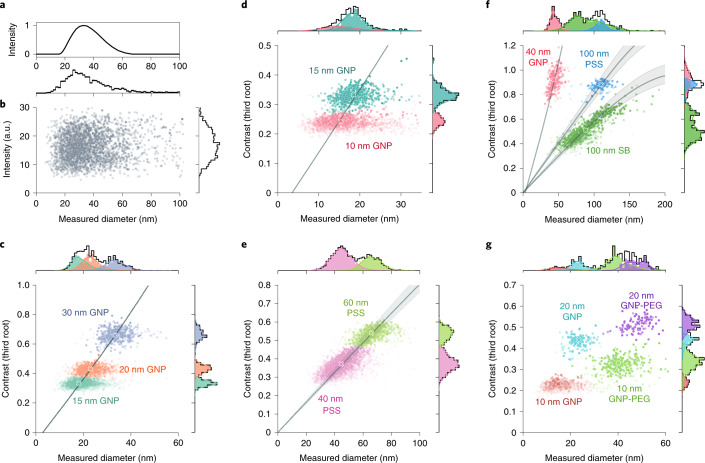
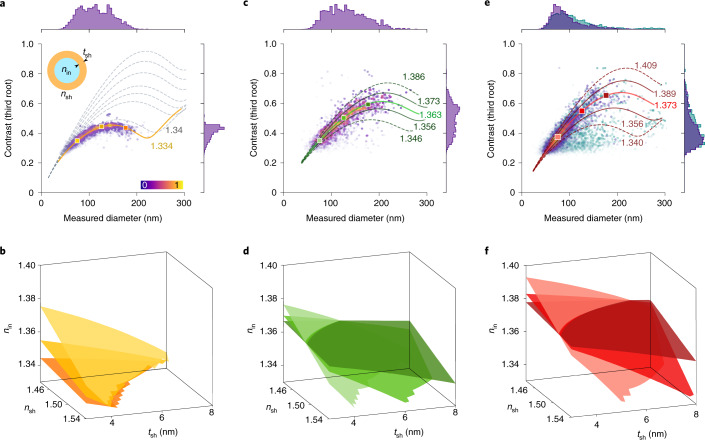
Characterization of the size and material properties of particles in liquid suspensions is in very high demand, for example, in the analysis of colloidal samples or of bodily fluids such as urine or blood plasma. However, existing methods are limited in their ability to decipher the constituents of realistic samples. Here we introduce iNTA as a new method that combines interferometric detection of scattering with nanoparticle tracking analysis to reach unprecedented sensitivity and precision in determining the size and refractive index distributions of nanoparticles in suspensions. After benchmarking iNTA with samples of colloidal gold, we present its remarkable ability to resolve the constituents of various multicomponent and polydisperse samples of known origin. Furthermore, we showcase the method by elucidating the refractive index and size distributions of extracellular vesicles from Leishmania parasites and human urine. The current performance of iNTA already enables advances in several important applications, but we also discuss possible improvements.
© 2022. The Author(s).
Conflict of interest statement
A.D.K., M.B., A.G. and V.S. have filed an International Patent Application (PCT) based on this work in the name of the Max Planck Gesellschaft zur Förderung der Wissenschaften e.V. D.S. declares no competing interests.
Figures
Similar articles
-
Measuring Concentration of Nanoparticles in Polydisperse Mixtures Using Interferometric Nanoparticle Tracking Analysis.ACS Nano. 2024 Jul 23;18(29):19161-19168. doi: 10.1021/acsnano.4c04396. Epub 2024 Jul 9. ACS Nano. 2024. PMID: 38981021 Free PMC article.
-
Label-free discrimination of extracellular vesicles from large lipoproteins.J Extracell Vesicles. 2023 Aug;12(8):e12348. doi: 10.1002/jev2.12348. J Extracell Vesicles. 2023. PMID: 37489102 Free PMC article.
-
Simultaneous Sizing and Refractive Index Analysis of Heterogeneous Nanoparticle Suspensions.ACS Nano. 2023 Jan 10;17(1):221-229. doi: 10.1021/acsnano.2c06883. Epub 2022 Dec 16. ACS Nano. 2023. PMID: 36525614 Free PMC article.
-
Assessment of the characterization of nonabsorbing nanoparticles in suspension from effective optical properties.Appl Opt. 2015 Nov 1;54(31):9082-92. doi: 10.1364/AO.54.009082. Appl Opt. 2015. PMID: 26560559
-
Single particle analysis: Methods for detection of platelet extracellular vesicles in suspension (excluding flow cytometry).Platelets. 2017 May;28(3):249-255. doi: 10.1080/09537104.2016.1260704. Epub 2016 Dec 29. Platelets. 2017. PMID: 28033028 Review.
Cited by
-
Exosomal Non-coding RNAs: A New Approach to Melanoma Diagnosis and Therapeutic Strategy.Curr Med Chem. 2024;31(37):6084-6109. doi: 10.2174/0109298673267553231017053329. Curr Med Chem. 2024. PMID: 37877505 Review.
-
Complex Refractive Index Spectrum of CsPbBr3 Nanocrystals via the Effective Medium Approximation.Nanomaterials (Basel). 2025 Jan 24;15(3):181. doi: 10.3390/nano15030181. Nanomaterials (Basel). 2025. PMID: 39940157 Free PMC article.
-
Learning from Metal Nanocrystal Heterogeneity: A Need for Information-Rich and High-Throughput Single-Nanocrystal Measurements.ACS Nanosci Au. 2025 Jul 16;5(4):219-239. doi: 10.1021/acsnanoscienceau.5c00033. eCollection 2025 Aug 20. ACS Nanosci Au. 2025. PMID: 40862071 Free PMC article. Review.
-
International Society for Extracellular Vesicles Workshop. QuantitatEVs: multiscale analyses, from bulk to single extracellular vesicle.J Extracell Biol. 2024 Jan;3(1):e137. doi: 10.1002/jex2.137. Epub 2024 Jan 24. J Extracell Biol. 2024. PMID: 38405579 Free PMC article.
-
One-dimensional photonic crystal enhancing spin-to-orbital angular momentum conversion for single-particle tracking.Light Sci Appl. 2024 Sep 26;13(1):268. doi: 10.1038/s41377-024-01623-x. Light Sci Appl. 2024. PMID: 39327427 Free PMC article.
References
Publication types
MeSH terms
Substances
LinkOut - more resources
Full Text Sources
Other Literature Sources
