

Optimized single-step optical clearing solution for 3D volume imaging of biological structures
- PMID: 35534680
- PMCID: PMC9085829
- DOI: 10.1038/s42003-022-03388-8
Optimized single-step optical clearing solution for 3D volume imaging of biological structures
Abstract
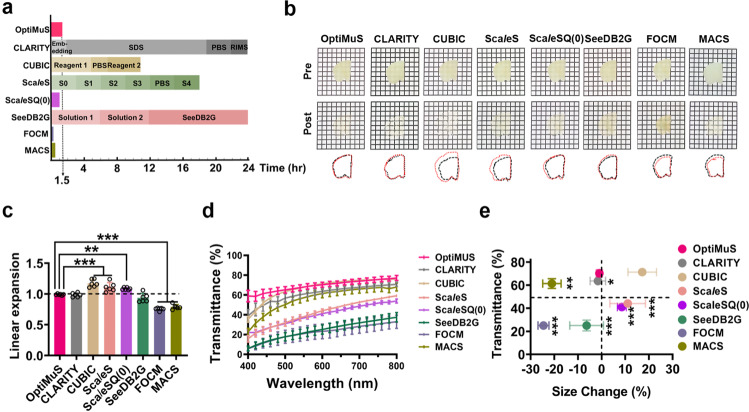
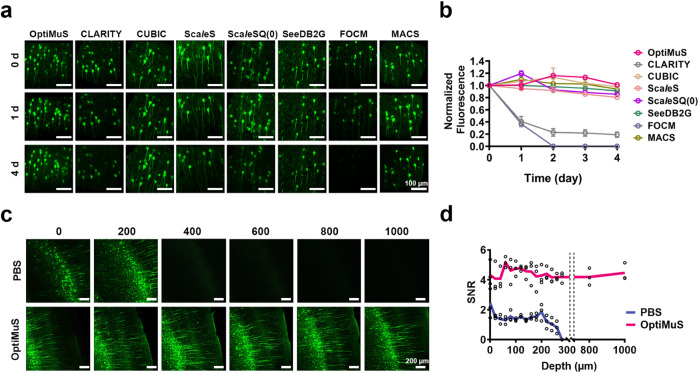
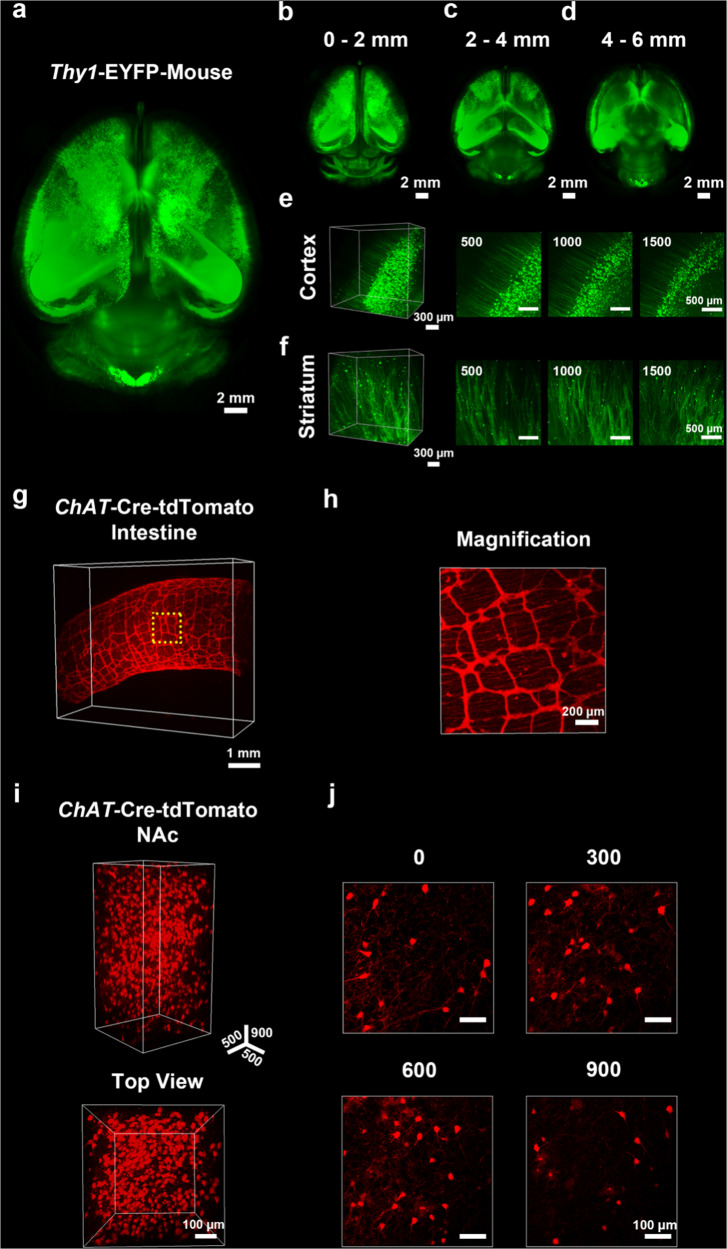
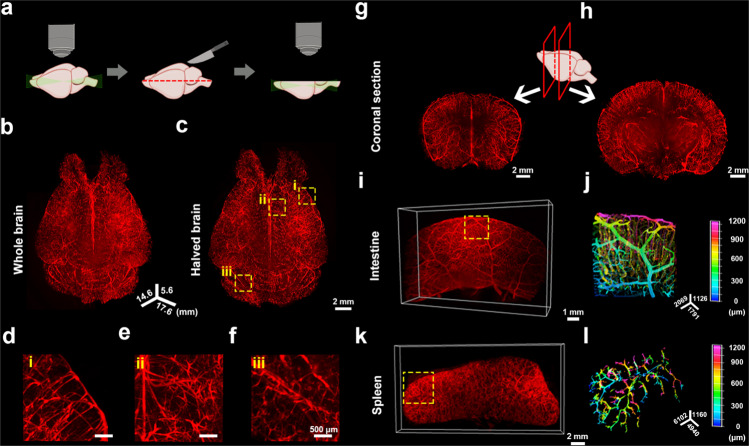
Various optical clearing approaches have been introduced to meet the growing demand for 3D volume imaging of biological structures. Each has its own strengths but still suffers from low transparency, long incubation time, processing complexity, tissue deformation, or fluorescence quenching, and a single solution that best satisfies all aspects has yet been developed. Here, we develop OptiMuS, an optimized single-step solution that overcomes the shortcomings of the existing aqueous-based clearing methods and that provides the best performance in terms of transparency, clearing rate, and size retention. OptiMuS achieves rapid and high transparency of brain tissues and other intact organs while preserving the size and fluorescent signal of the tissues. Moreover, OptiMuS is compatible with the use of lipophilic dyes, revealing DiI-labeled vascular structures of the whole brain, kidney, spleen, and intestine, and is also applied to 3D quantitative and comparative analysis of DiI-labeled vascular structures of glomeruli turfs in normal and diseased kidneys. Together, OptiMuS provides a single-step solution for simple, fast, and versatile optical clearing method to obtain high tissue transparency with minimum structural changes and is widely applicable for 3D imaging of various whole biological structures.
© 2022. The Author(s).
Conflict of interest statement
S.C. is the founder of and a shareholder in Crayon Technologies, Inc, South Korea. The remaining authors declare no competing interests.
Figures

Similar articles
-
MACS: Rapid Aqueous Clearing System for 3D Mapping of Intact Organs.Adv Sci (Weinh). 2020 Feb 25;7(8):1903185. doi: 10.1002/advs.201903185. eCollection 2020 Apr. Adv Sci (Weinh). 2020. PMID: 32328422 Free PMC article.
-
A method for ultrafast tissue clearing that preserves fluorescence for multimodal and longitudinal brain imaging.BMC Biol. 2022 Mar 29;20(1):77. doi: 10.1186/s12915-022-01275-6. BMC Biol. 2022. PMID: 35351101 Free PMC article.
-
Single-Step Fast Tissue Clearing of Thick Mouse Brain Tissue for Multi-Dimensional High-Resolution Imaging.Int J Mol Sci. 2022 Jun 19;23(12):6826. doi: 10.3390/ijms23126826. Int J Mol Sci. 2022. PMID: 35743267 Free PMC article.
-
Optical clearing for multiscale biological tissues.J Biophotonics. 2018 Feb;11(2). doi: 10.1002/jbio.201700187. Epub 2017 Dec 12. J Biophotonics. 2018. PMID: 29024450 Review.
-
Recent progress in optical clearing of eye tissues.Exp Eye Res. 2021 Nov;212:108796. doi: 10.1016/j.exer.2021.108796. Epub 2021 Oct 15. Exp Eye Res. 2021. PMID: 34662543 Review.
Cited by
-
Spatio-Temporal Dynamics of Diffusion-Associated Deformations of Biological Tissues and Polyacrylamide Gels Observed with Optical Coherence Elastography.Materials (Basel). 2023 Mar 1;16(5):2036. doi: 10.3390/ma16052036. Materials (Basel). 2023. PMID: 36903151 Free PMC article.
-
3D Histology visualizing hypoxia-induced upregulation of N-terminal cysteine using de novo fluorophore generation.Redox Biol. 2025 Apr;81:103577. doi: 10.1016/j.redox.2025.103577. Epub 2025 Mar 3. Redox Biol. 2025. PMID: 40054059 Free PMC article.
-
Retrograde dye perfusion of the proximal aorta - A postmortem technical study.Heliyon. 2022 Dec 21;8(12):e12475. doi: 10.1016/j.heliyon.2022.e12475. eCollection 2022 Dec. Heliyon. 2022. PMID: 36636207 Free PMC article.
-
Application of HEMA-AAm copolymer to achieve faster optical tissue transparency for 2D/3D fluorescence imaging.Sci Rep. 2025 Apr 3;15(1):11406. doi: 10.1038/s41598-025-94479-z. Sci Rep. 2025. PMID: 40181114 Free PMC article.
-
Comparison of Light-Sheet Fluorescence Microscopy and Fast-Confocal Microscopy for Three-Dimensional Imaging of Cleared Mouse Brain.Methods Protoc. 2023 Nov 10;6(6):108. doi: 10.3390/mps6060108. Methods Protoc. 2023. PMID: 37987355 Free PMC article.
References
Publication types
MeSH terms
Substances
LinkOut - more resources
Full Text Sources
