. 2022 May;8(5):500-512.
doi: 10.1038/s41477-022-01146-6. Epub 2022 May 9.

The flying spider-monkey tree fern genome provides insights into fern evolution and arborescence

Affiliations

The flying spider-monkey tree fern genome provides insights into fern evolution and arborescence

Xiong Huang et al. Nat Plants. 2022 May.

Erratum in

Abstract

To date, little is known about the evolution of fern genomes, with only two small genomes published from the heterosporous Salviniales. Here we assembled the genome of Alsophila spinulosa, known as the flying spider-monkey tree fern, onto 69 pseudochromosomes. The remarkable preservation of synteny, despite resulting from an ancient whole-genome duplication over 100 million years ago, is unprecedented in plants and probably speaks to the uniqueness of tree ferns. Our detailed investigations into stem anatomy and lignin biosynthesis shed new light on the evolution of stem formation in tree ferns. We identified a phenolic compound, alsophilin, that is abundant in xylem, and we provided the molecular basis for its biosynthesis. Finally, analysis of demographic history revealed two genetic bottlenecks, resulting in rapid demographic declines of A. spinulosa. The A. spinulosa genome fills a crucial gap in the plant genomic landscape and helps elucidate many unique aspects of tree fern biology.


Conflict of interest statement

The authors declare no competing interests.

Figures

Fig. 1
Fig. 1. The A. spinulosa genome.
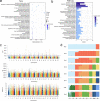
a, A. spinulosa’s arborescent habit. b, DNA methylation levels of three contexts (CG, CHG and CHH) in the genome, gene body and TE (Gypsy, Copia and EnSpm) space. TSS, transcription start site; TTS, transcription termination site. c, Gene family expansion and contraction among 12 plant species, including 3 bryophytes, 3 ferns, 1 lycophyte and 4 seed plants, and 1 outgroup species, Chara braunii. The tree was constructed using 134 single-copy orthologous genes. The red and blue numbers above the branches represent expansion and contraction events, respectively. The number at each node represents divergence time. d, WGD analysis. The cladogram shows the relative phylogenetic positions of two ancient WGDs in A. spinulosa with Ks plots for each species in Cyatheales displayed along the right edge and a summary of experimental and simulated MAPS analyses below. The shaded area in the MAPS summary shows the standard deviation for the gene tree simulations. Pj, Plagiogyria japonica; Da, Dicksonia antarctica; Sl, Sphaeropteris lepifera; As, A. spinulosa; Gp, Gymnosphaera podophylla; Gg, Gymnosphaera gigantea. e, Intragenomic synteny among 69 chromosomes in the A. spinulosa genome. Source data
Fig. 2
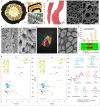
Fig. 2. Vascular bundle structure and lignin biosynthesis in A. spinulosa.
a, A stem cross-section and mature sori (So) underneath the leaf. A wavy structure is enlarged to show the xylem (Xy), phloem (Ph) and sclerenchymatic belt (Sb) in the vascular bundle. Pi, pith. b, Segregated xylem cells showing scalariform thickening. c,d, Scanning electron micrographs of xylem for cross-section (c) and longitudinal section (d). e, microCT shows the three-dimensional arrangement of tracheids. f, Transmission electron microscopy (TEM) image of Sb. The microscopic observations in bd,f are more than ×6. g, The histogram (top) shows the content of acid-soluble lignin and acid-insoluble lignin in Ph, Sb, Xy and spores (Sp), calculated as percentage of cell wall residue (CWR). The heat map (bottom) shows the content of lignin aromatic units (G, S and H) from the three canonical monolignols in Ph, Sb, Xy and Sp. The values are the mean ± s.d. of two independent experiments. h, Heteronuclear single-quantum coherence NMR spectra, showing that guaiacyl units are major components of lignins in Xy and Sp. Relative quantification was performed using the correlation peak volume integration (uncorrected). Side chain units are on the basis A + B + C = 100%; aromatics are on the basis S + G = 100% as H peaks overlap. pCA, p-coumarate; FA, ferulate; Phe and Tyr are phenylalanine and tyrosine units (in protein). Source data
Fig. 3
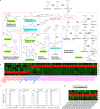
Fig. 3. Biosynthesis of phenylpropanoid-based metabolites in A. spinulosa.
a, Biosynthetic pathways of lignin, flavonoids, stilbene, styrylpyrone and alsophilin. The metabolites shaded in green are identified in our metabolomic characterizations. The metabolites shaded in blue are products in the enzyme assays. PAL, phenylalanine ammonia-lyase; C4H, cinnamate-4-hydroxylase; 4CL, 4-coumarate:coenzyme A ligase; HCT, p-hydroxycinnamoyl-CoA:quinate shikimate p-hydroxycinnamoyltransferase; CCR, cinnamoyl CoA reductase; C3H, 4-coumarate 3-hydroxylase, CAD, cinnamyl alcohol dehydrogenase; CSE, caffeoyl shikimate esterase; COMT, caffeic acid/5-hydroxyconiferaldehyde O-methyltransferase; CCoAOMT, caffeoyl-CoA O-methyltransferase. b, Heat map showing gene expression profiles of monolignol biosynthetic pathway genes in xylem, phloem, sclerenchymatic belt, pith, sorus stage 1 and leaf stage 1. Genes highlighted in red and pink are significantly upregulated in xylem and sorus, respectively, and genes highlighted in blue are significantly upregulated in both xylem and sorus. c, Relative content of alsophilin, piceatannol, hispidin and resveratrol in leaf, xylem, phloem, pith and sclerenchymatic belt of A. spinulosa, determined by ultra performance liquid chromatography-mass spectrometry (UPLC–MS). The asterisks indicate the significance (***P < 0.001, two-sided Student’s t-test) of alsophilin content in Xy compared with the other four tissues. The values are the means ± s.d. of three independent experiments. d, Heat map showing the gene profiles of 17 oxidase genes upregulated in xylem. The FPKM values were normalized using the Z-score method. So1, sorus stage 1; Le1, leaf stage 1. Source data
Fig. 4
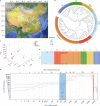
Fig. 4. Phylogenetic relationships and structure of A. spinulosa populations.
a, Geographic distribution of 107 A. spinulosa individuals in nine locations, including Yunnan (YN), Nepal, Xizang (XZ), Fujian (FJ), Taiwan (TW), Hainan (HN), Guangxi (GX), Sichuan (SC) and Guizhou (GZ), with A. costularis in YN as an outgroup (Out). b, A phylogenetic tree of 107 accessions constructed using the whole-genome SNPs. All accessions were clustered into six groups: YN, XZ, Nepal, FJ/TW, HN and GX/SC/GZ. The sizes of the dots on the nodes are proportional to bootstrap support values. c, PCA, with the proportion of the variance explained being 85.8% for PC1, 13.2% for PC2 and 12.4% for PC3. The dots are coloured corresponding to the colours in b. d, Cross-validation error shows that K = 6 is the optimal population clustering group. The structures are coloured corresponding to the colours used in b. e, Demographic history of A. spinulosa. The stairway plot shows the historical effective population size Ne (y axis) with a generation time of 100 years. The blue and red shadows represent two bottlenecks. The red line represents median of effective population size based on a subset of 200 inferences. Dark gray and light gray lines represent 75% and 95% confidence intervals, respectively.
Extended Data Fig. 1
Extended Data Fig. 1. Genome assembly and annotation of A. spinulosa.
(a) Estimation of genome size and heterozygosity based on 23-mer frequency distribution analysis using the GenomeScope software. The genome of A. spinulosa was estimated as 6.23 Gb with the heterozygosity of 0.28%. (b) Assembly strategy of A. spinulosa genome. PacBio long reads were assembled into contigs by the Smartdenovo software. Illumina short reads were used to correct contigs. Hi-C-based scaffolding was generated using 3D-DNA pipeline, and 69 pseudo-chromosomes were obtained. The final chromosome-level assembled genome size was 6.23 Gb with scaffold N50 size of 92.48 Mb. (c) Genome-wide interaction heat map of Hi-C links among chromosome groups (69 chromosomes). Each chromosome has higher intensity of interactions with itself than any other chromosomes (Darker red color means stronger interactions).
Extended Data Fig. 2
Extended Data Fig. 2. Self-self synteny in A. spinulosa.
Synteny was assessed using the MCSCANX program to identify collinear blocks of syntenic gene pairs. The resulting syntenic blocks were filtered by median Ks using a custom Python script to select collinear gene pairs that were the result of a specific duplication event. Blocks of syntenic genes show conservation of genes order following WGD. Synteny regions are color coded by Ks value.
Extended Data Fig. 3
Extended Data Fig. 3. WGD analysis and gene functional prediction of A. spinulosa.
(a) Summary of second MAPS analysis focusing on the WGD event common to all Cyatheales. Shaded area shows the standard deviation for gene tree simulations. The dark lines in the center of the shaded regions represent the average values for null and positive gene tree simulations. (b) GO enrichment of syntenic homoeologs. The first histogram shows GO enrichment of all syntenic pairs from the most recent WGD event (0.2<Ks<0.5) compared to genomic background. The second histogram shows GO enrichment of differentially expressed genes relative to a background of all syntenic gene pairs from the most recent WGD event. P-values were obtained using an one-sided hypergeometric test. (c) Gene pairs plotted according to log2 fold change (L2F) as calculated for gene 1 (x-axis) and gene 2 (y-axis) in DESeq2. Each point represents one gene pair with pairs colored according to the difference in L2F values (diffL2F = |L2F_1 - L2F_2|) to visualize the arbitrary cutoffs of diffL2F = 2 and diffL2F = 4. Blue dashed lines represent zero difference expression between homoeologs. St: stem; So: sorus; Le: leaf; Ga: gametophyte. (d) Upset plot showing overlap in the number of homoeologous gene pairs that are differentially expressed between various comparisons. Source data
Extended Data Fig. 4
Extended Data Fig. 4. Genome-wide deceleration of nucleotide substitution rate in Cyatheales ferns.
(a) Phylogenetic tree generated by OrthoFinder depicts the relationships of 14 species from eight orders, including Cyatheales, Polypodiales, Salviniales, Schizeales, Gleicheniales, Hymenophyllales, Osmundales and Marattiales. The branch lengths within Cyatheales are shorter than those in other orders, suggesting deceleration of substitution rate in Cyatheales. (b) Genome-wide substitution rate variation in Cyatheales (N is the number of nuclear protein-coding genes). Among the 941 single-copy nuclear genes from Cyatheales, a majority (92%) showed reduced substitution rates, and the reduction in 30% genes was statistically significant (p <0.005). By contrast, <1% of genes had significant elevated rates. Upper bound of each box (Q3) represents the 75th percentile, lower bound of each box (Q1) represents the 25th percentile, the midline of each box is the median, and each whisker represents the highest or lowest point within Q3 + 1.5*IQR or Q1 - 1.5*IQR, respectively (IQR = Q3 - Q1). P-values were calculated using an one-sided likelihood-ratio test. Source data
Extended Data Fig. 5
Extended Data Fig. 5. Expression patterns of monolignol biosynthetic genes in different tissues of A. spinulosa.
(a) The first heat map shows FPKM values of 17 monolignol biosynthetic genes in pith (Pi), sclerenchymatic belt (Sb), xylem (Xy), and phloem (Ph) by RNA-seq analysis and their transcript abundance by qRT-PCR analysis. The second heat map shows FPKM values of 17 monolignol biosynthetic genes in St1 (stem stage 1), So1 (sorus stage 1), Le1 (leaf stage 1) by RNA-seq analysis and their transcript abundance by qRT-PCR analysis. Transcript abundance and FPKM values were normalized using the Z-score method. (b) Heat map shows FPKM values of five CAld5H genes in different tissues of A. spinulosa. Pi1/2/3 (pith stage 1/2/3), SPX1/2/3 (wavy structure stage 1/2/3), So1/2/3 (sorus stage 1/2/3), St1/2/3 (stem stage 1/2/3), Le1/2/3 (leaf stage 1/2/3), Ga (gametophyte). All gene accession numbers are shown in Supplementary Data 3. Source data
Extended Data Fig. 6
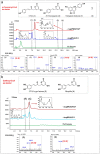
Extended Data Fig. 6. HPLC analysis and ECD calculation for the enantiomers (±)-alsophilin.
(a) HPLC analysis of (±)-alsophilin, (−)-alsophilin, and (+)-alsophilin on a C18 OSAKA SODA CAPCELL PAK column (150 × 4.6 mm I.D., 5 µm) using water (solvent A) and acetonitrile (solvent B) as gradient eluent (0-30 min, 10%-50% B; 30-35 min, 50%-100% B), flow rate 1 ml/min, at 382 nm. (b) HPLC analysis of (±)-alsophilin, (−)-alsophilin, and (+)-alsophilin on a chiral column Daicel Chiralpak IC column (250 × 4.6 mm I.D., 5 µm) using isopropyl and hexane as eluent (60:40) at a flow rate of 1 ml/min. (c) Circular dichroism (CD) spectra of (±)-alsophilin, (−)-alsophilin, and (+)-alsophilin in MeOH, measured using JASCO J-815 CD spectro polarimeters. (d) Comparison of the calculated ECD spectra for (7′S,8′S)-alsophilin and (7′R,8′R)-alsophilin with the experimental spectra of (−)-alsophilin and (+)-alsophilin in MeOH. Energies of the conformers of (+)-alsophilin at B3LYP/6-311g (d,p) in MeOH are shown in Supplementary Table 20.
Extended Data Fig. 7
Extended Data Fig. 7. In vitro enzyme activity assays of seven PKS III proteins, including AspiPKS1/2/3/4/5/6/7.
(a) Assays were conducted using p-coumaroyl-CoA and malony-CoA as substrates, and products were analyzed using LC-MS extracted ion chromatograms (XICs). Naringenin chalcone and coumaroyltriacetic acid lactone (CTAL) (271.20 m/z) and bis-noryangonin (229.20 m/z) are products for AspiPKS1, 2 and 3. Bis-noryangonin (229.20 m/z) and peak 4 (471.20 m/z) are products for AspiPKS4, 5, 6 and 7. (b) Assays were conducted using caffeoyl-CoA and malony-CoA as substrates. CTAL-type lactone (287.15 m/z) and hispidin (245.20 m/z) are products for AspiPKS1, 2, and 3. Hispidin is the product for AspiPKS4, 5, 6, and 7.
Extended Data Fig. 8
Extended Data Fig. 8. Resequencing of 107 A. spinulosa accessions.
(a) GO enrichment of the protein-coding genes that undergo nature selection. (b) KEGG enrichment of the protein-coding genes that undergo nature selection. (c) Genome-wide distribution of CLR, θπ, and Tajima’s D values of 107 populations along 69 chromosomes in A. spinulosa genome. The blue dashed line represents the threshold of the top 5% CLR, the bottom 5% θπ, and the bottom 2.5% Tajima’s D, the red dashed line represents the threshold of the top 2.5% Tajima’s D. (d) The different ancestral population structures are estimated from the same variants set with STRUCTURE software using ancestral population sizes K=2-9. The parameter standard errors are estimated using bootstrapping (100 replicates).
Extended Data Fig. 9
Extended Data Fig. 9. Chemical structures and antioxidant activities of 11 secondary metabolites isolated from A. spinulosa stems.
(a) Chemical structure and hypothetical biosynthetic pathway of one new compound (1) and ten known compounds (2-11). compound 1: (±)-alsophilin; compound 2: 3,4-dihydroxybenzalacetone; compound 3: protocatechnic aldehyde; compound 4: vanillic acid; compound 5: piceatannol; compound 6: cyperusphenol B; compound 7: cinnamtannin B-1; compound 8: jezonodione; compound 9: davallialactone; compound 10: cyathenosin A; compound 11: 4-O-β-D-glucopyranosyl-p-coumaric acid. (b) Antioxidant effects on MDA production of pure compounds at 10−5 M, using curcumin as the positive control. compound 1a: (−)-alsophilin; compound 1b: (+)-alsophilin. (c) Antioxidant effects on MDA production of (±)-alsophilin, (−)-alsophilin, and (+)-alsophilin at 10−4, 10−5, and 10−6 M, respectively, using curcumin as positive control. The data of inhibition rates in b and c are presented as means ±SD of three independent experiments. Source data

Similar articles

Cited by

References

    1. Delwiche C, Cooper E. The evolutionary origin of a terrestrial flora. Curr. Biol. 2015;25:R899–R910. doi: 10.1016/j.cub.2015.08.029. - DOI - PubMed
    1. Sarkanen, K. V. & Ludwig, C. H. Lignins: Occurrence, Formation, Structure and Reactions (Wiley-Interscience, 1971).
    1. Schuettpelz E, Schneider H, Smith AR, Kessler M. A community-derived classification for extant lycophytes and ferns. J. Syst. Evol. 2016;54:563–603. doi: 10.1111/jse.12229. - DOI
    1. Clark J, et al. Genome evolution of ferns: evidence for relative stasis of genome size across the fern phylogeny. N. Phytol. 2016;210:1072–1082. doi: 10.1111/nph.13833. - DOI - PubMed
    1. Dong SY, Zuo ZY. On the recognition of Gymnosphaera as a distinct genus in Cyatheaceae. Ann. Mo. Bot. Gard. 2018;103:1–23. doi: 10.3417/2017049. - DOI