

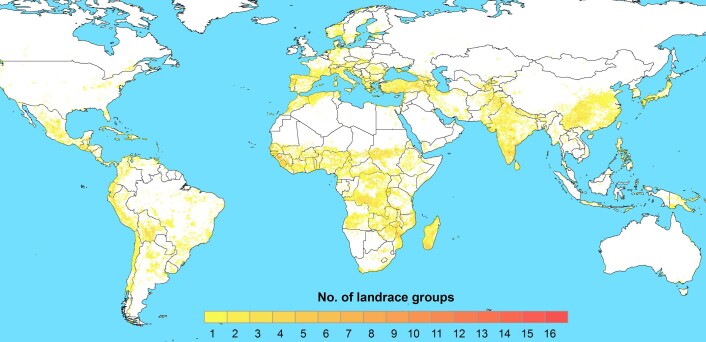
State of ex situ conservation of landrace groups of 25 major crops
- PMID: 35534721
- PMCID: PMC9122826
- DOI: 10.1038/s41477-022-01144-8
State of ex situ conservation of landrace groups of 25 major crops
Abstract
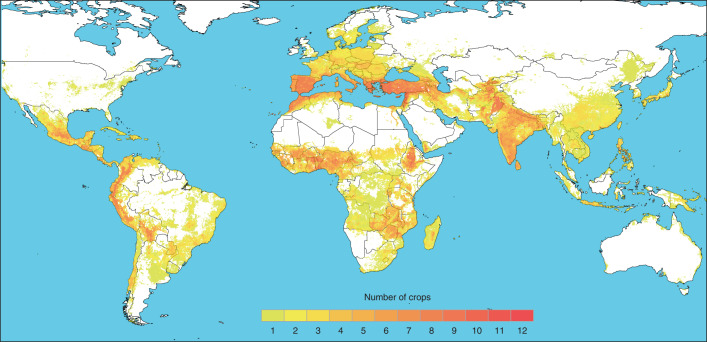
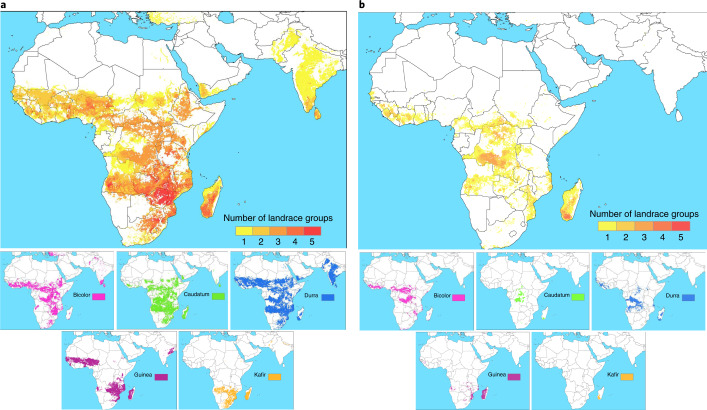
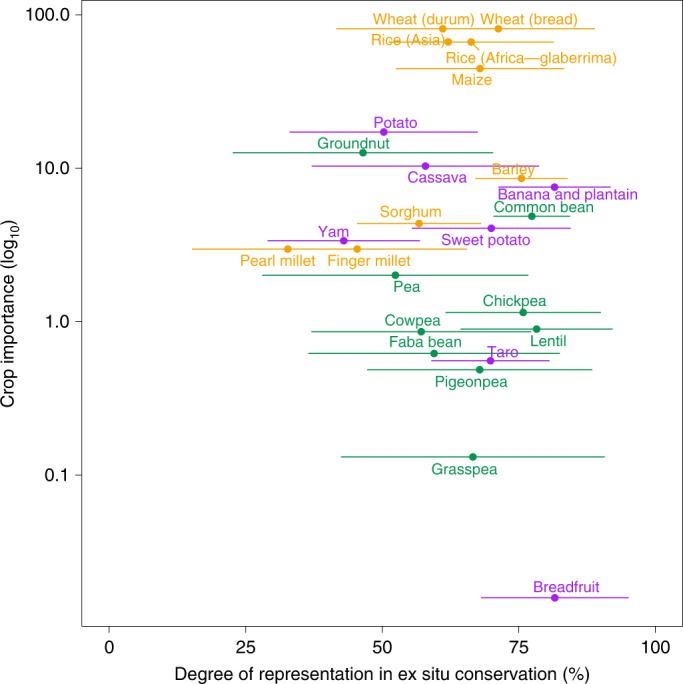
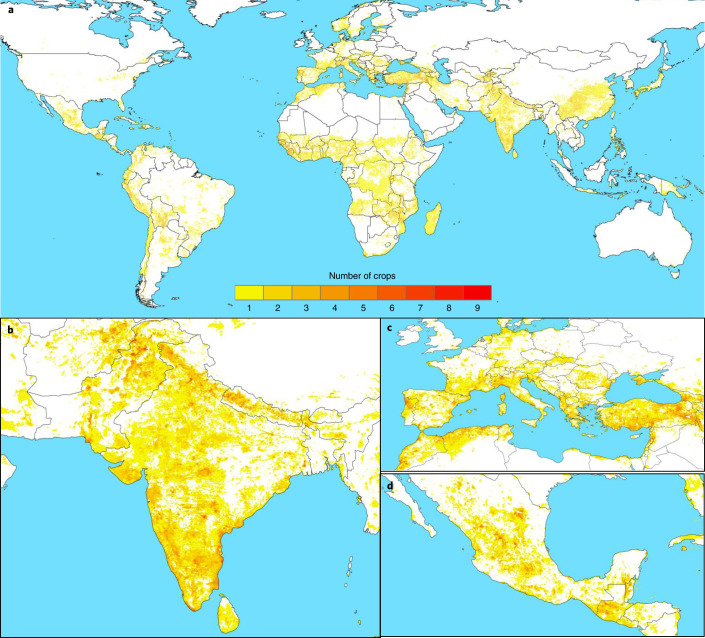
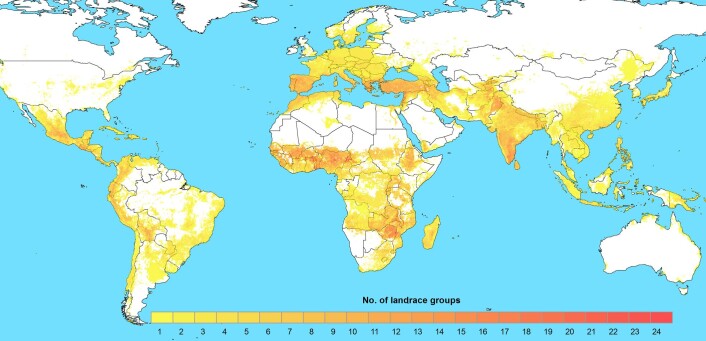
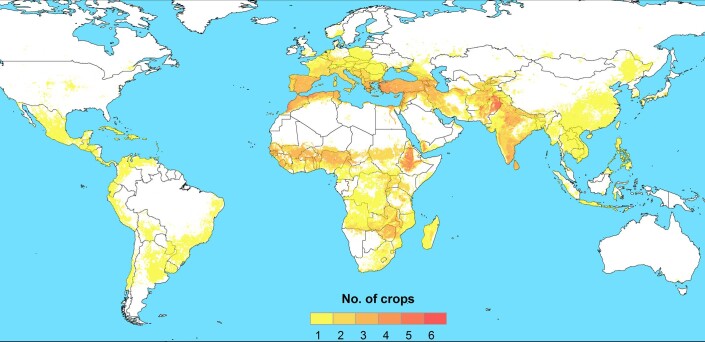
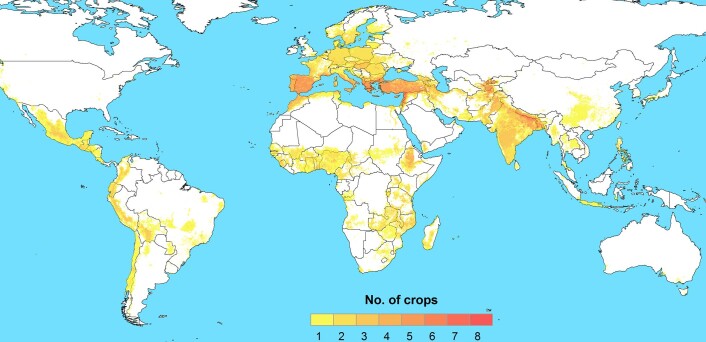
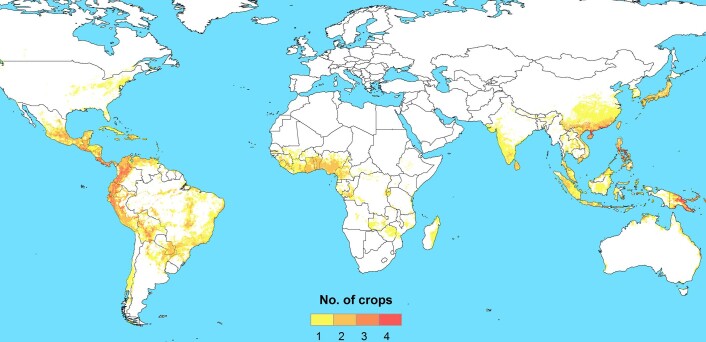
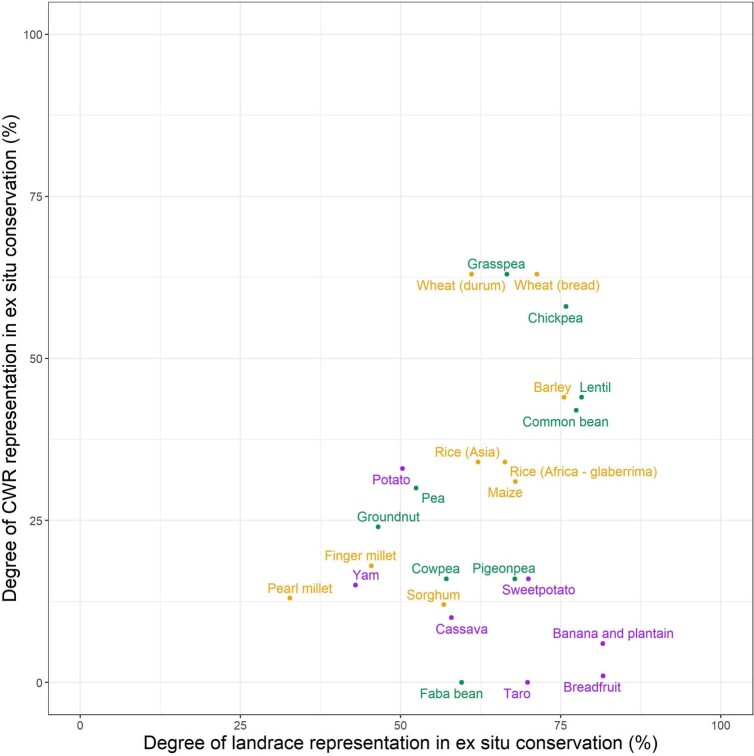
Crop landraces have unique local agroecological and societal functions and offer important genetic resources for plant breeding. Recognition of the value of landrace diversity and concern about its erosion on farms have led to sustained efforts to establish ex situ collections worldwide. The degree to which these efforts have succeeded in conserving landraces has not been comprehensively assessed. Here we modelled the potential distributions of eco-geographically distinguishable groups of landraces of 25 cereal, pulse and starchy root/tuber/fruit crops within their geographic regions of diversity. We then analysed the extent to which these landrace groups are represented in genebank collections, using geographic and ecological coverage metrics as a proxy for genetic diversity. We find that ex situ conservation of landrace groups is currently moderately comprehensive on average, with substantial variation among crops; a mean of 63% ± 12.6% of distributions is currently represented in genebanks. Breadfruit, bananas and plantains, lentils, common beans, chickpeas, barley and bread wheat landrace groups are among the most fully represented, whereas the largest conservation gaps persist for pearl millet, yams, finger millet, groundnut, potatoes and peas. Geographic regions prioritized for further collection of landrace groups for ex situ conservation include South Asia, the Mediterranean and West Asia, Mesoamerica, sub-Saharan Africa, the Andean mountains of South America and Central to East Asia. With further progress to fill these gaps, a high degree of representation of landrace group diversity in genebanks is feasible globally, thus fulfilling international targets for their ex situ conservation.
© 2022. The Author(s).
Conflict of interest statement
The authors declare no competing interests.
Figures
References
-
- Jarvis DI, Hodgkin T. Wild relatives and crop cultivars: detecting natural introgression and farmer selection of new genetic combinations in agroecosystems. Mol. Ecol. 1999;8:S159–S173. doi: 10.1046/j.1365-294X.1999.00799.x. - DOI
MeSH terms
LinkOut - more resources
Full Text Sources
Research Materials
