

Comparative transcriptome analysis of resistant and susceptible wheat in response to Rhizoctonia cerealis
- PMID: 35534832
- PMCID: PMC9087934
- DOI: 10.1186/s12870-022-03584-y
Comparative transcriptome analysis of resistant and susceptible wheat in response to Rhizoctonia cerealis
Abstract
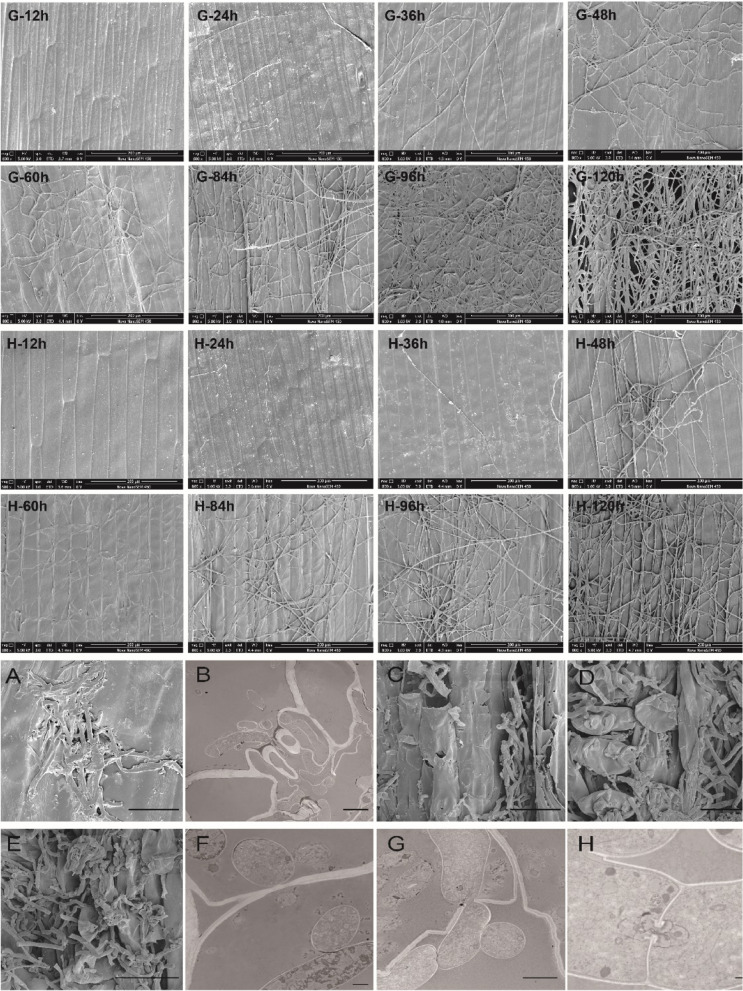
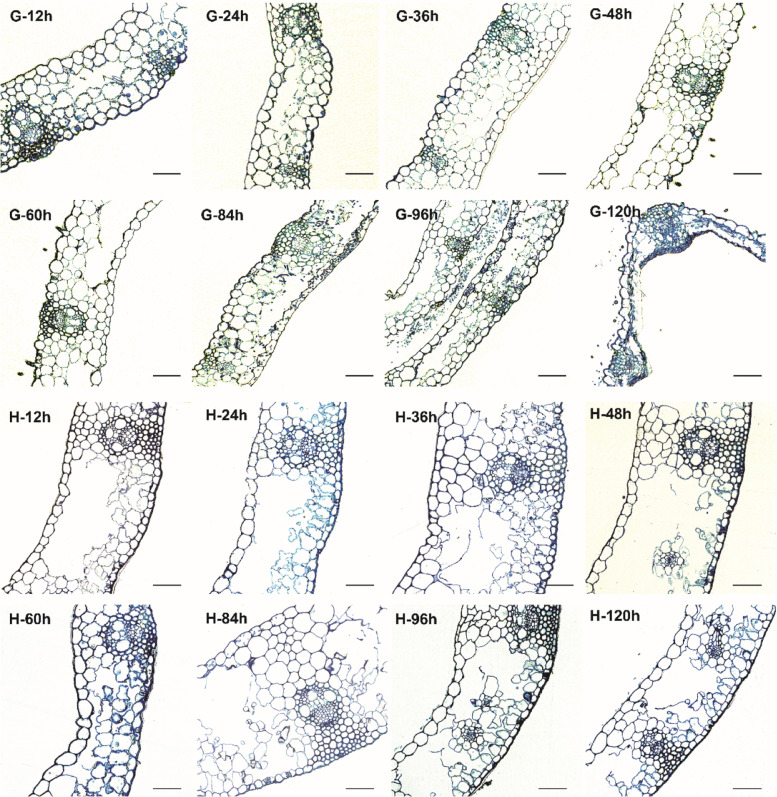
Background: Sheath blight is an important disease caused by Rhizoctonia cerealis that affects wheat yields worldwide. No wheat varieties have been identified with high resistance or immunity to sheath blight. Understanding the sheath blight resistance mechanism is essential for controlling this disease. In this study, we investigated the response of wheat to Rhizoctonia cerealis infection by analyzing the cytological changes and transcriptomes of common wheat 7182 with moderate sensitivity to sheath blight and H83 with moderate resistance.
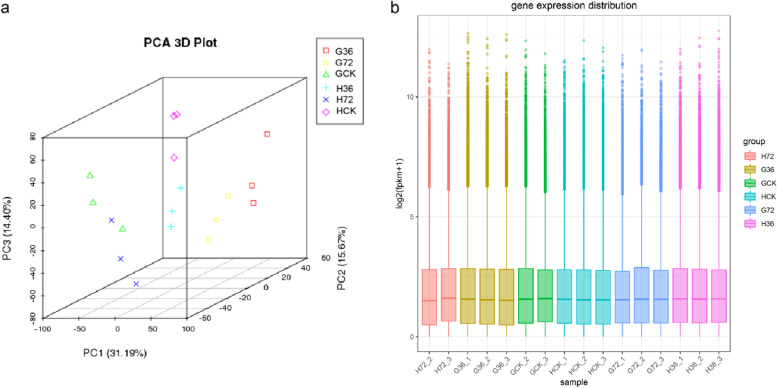
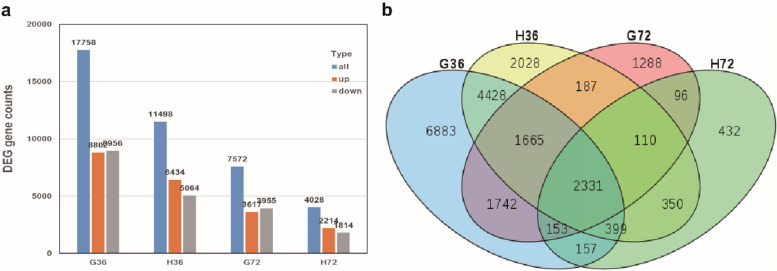
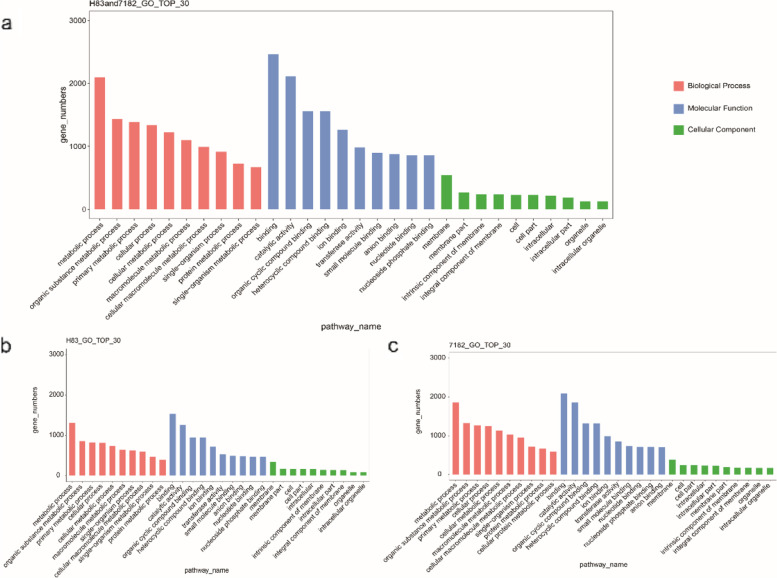
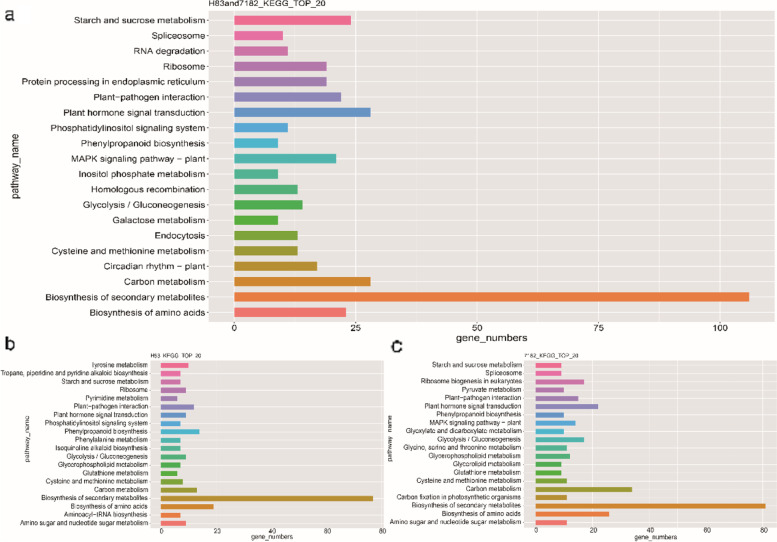
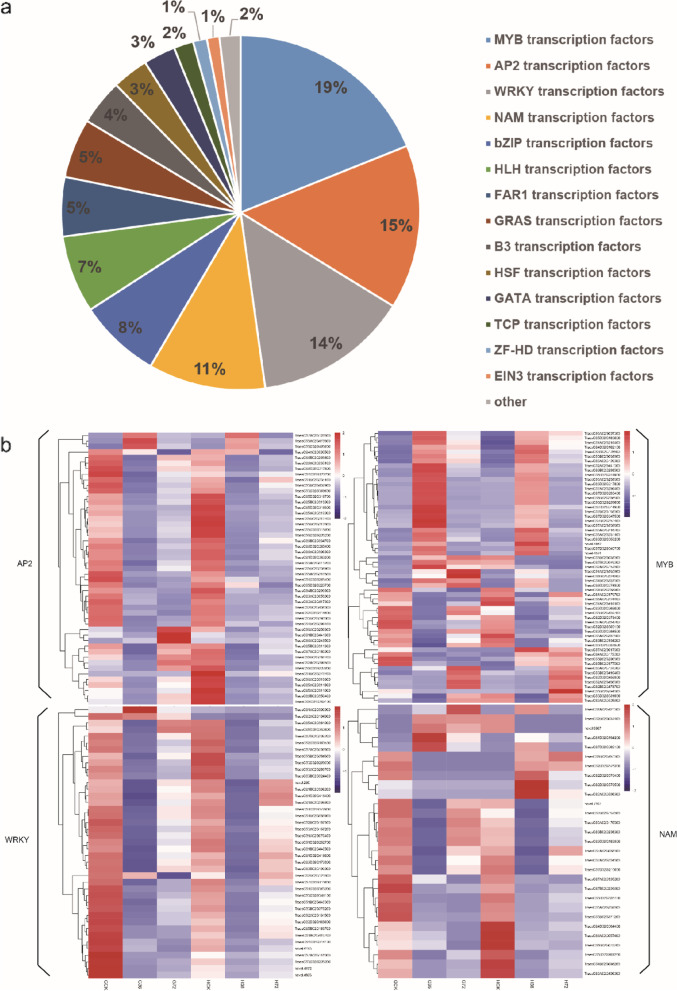
Results: The cytological observation showed that the growth of Rhizoctonia cerealis on the surface and its expansion inside the leaf sheath tissue were more rapid in the susceptible material. According to the transcriptome sequencing results, a total of 88685 genes were identified in both materials, including 20156 differentially expressed genes (DEGs) of which 12087 was upregulated genes and 8069 was downregulated genes. At 36 h post-inoculation, compared with the uninfected control, 11498 DEGs were identified in resistant materials, with 5064 downregulated genes and 6434 upregulated genes, and 13058 genes were detected in susceptible materials, with 6759 downregulated genes and 6299 upregulated genes. At 72 h post-inoculation, compared with the uninfected control, 6578 DEGs were detected in resistant materials, with 2991 downregulated genes and 3587 upregulated genes, and 7324 genes were detected in susceptible materials, with 4119 downregulated genes and 3205 upregulated genes. Functional annotation and enrichment analysis showed that the main pathways enriched for the DEGs included biosynthesis of secondary metabolites, carbon metabolism, plant hormone signal transduction, and plant-pathogen interaction. In particular, phenylpropane biosynthesis pathway is specifically activated in resistant variety H83 after infection. Many DEGs also belonged to the MYB, AP2, NAC, and WRKY transcription factor families.
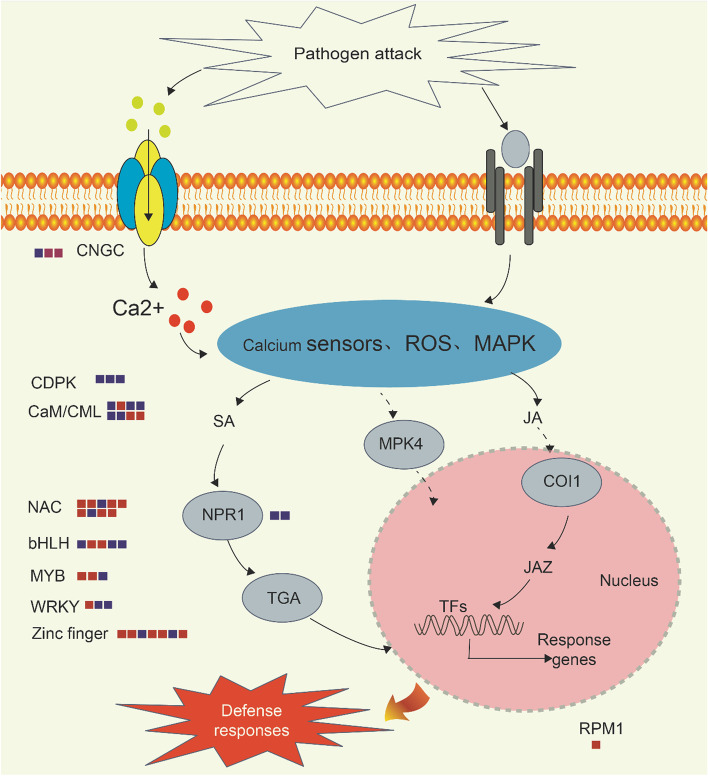
Conclusions: Thus, we suggest that the normal functioning of plant signaling pathways and differences in the expression of key genes and transcription factors in some important metabolic pathways may be important for defending wheat against sheath blight. These findings may facilitate further exploration of the sheath blight resistance mechanism in wheat and the cloning of related genes.
Keywords: Comparative transcriptome; Plant hormone; Plant–fungus interaction; Rhizoctonia cerealis; Sheath blight; Wheat (Triticum aestivum L.).
© 2022. The Author(s).
Conflict of interest statement
The authors have no conflicts of interest to declare.
Figures
Similar articles
-
Gene expression analysis of resistant and susceptible rice cultivars to sheath blight after inoculation with Rhizoctonia solani.BMC Genomics. 2022 Apr 7;23(1):278. doi: 10.1186/s12864-022-08524-6. BMC Genomics. 2022. PMID: 35392815 Free PMC article.
-
The wheat R2R3-MYB transcription factor TaRIM1 participates in resistance response against the pathogen Rhizoctonia cerealis infection through regulating defense genes.Sci Rep. 2016 Jul 1;6:28777. doi: 10.1038/srep28777. Sci Rep. 2016. PMID: 27364458 Free PMC article.
-
The Pathogen-Induced MATE Gene TaPIMA1 Is Required for Defense Responses to Rhizoctonia cerealis in Wheat.Int J Mol Sci. 2022 Mar 21;23(6):3377. doi: 10.3390/ijms23063377. Int J Mol Sci. 2022. PMID: 35328796 Free PMC article.
-
Sheath blight of rice: a review and identification of priorities for future research.Planta. 2019 Nov;250(5):1387-1407. doi: 10.1007/s00425-019-03246-8. Epub 2019 Jul 25. Planta. 2019. PMID: 31346804 Review.
-
Transcriptome analysis of genes related to resistance against powdery mildew in wheat-Thinopyrum alien addition disomic line germplasm SN6306.Gene. 2016 Sep 15;590(1):5-17. doi: 10.1016/j.gene.2016.06.005. Epub 2016 Jun 2. Gene. 2016. PMID: 27265028 Review.
Cited by
-
Combined analysis of mRNA and miRNA transcriptomes reveals the regulatory mechanism of Xanthomonas arboricola pv pruni resistance in Prunus persica.BMC Genomics. 2024 Feb 27;25(1):214. doi: 10.1186/s12864-024-10113-8. BMC Genomics. 2024. PMID: 38413907 Free PMC article.
-
Genome-Wide Analysis of Type-III Polyketide Synthases in Wheat and Possible Roles in Wheat Sheath-Blight Resistance.Int J Mol Sci. 2022 Jun 28;23(13):7187. doi: 10.3390/ijms23137187. Int J Mol Sci. 2022. PMID: 35806194 Free PMC article.
-
Regulation of hormone pathways in wheat infested by Blumeria graminis f. sp. tritici.BMC Plant Biol. 2023 Nov 9;23(1):554. doi: 10.1186/s12870-023-04569-1. BMC Plant Biol. 2023. PMID: 37940874 Free PMC article.
-
Design, Synthesis, and Antifungal Activities of Phenylpyrrole Analogues Based on Alkaloid Lycogalic Acid.Molecules. 2024 Jul 2;29(13):3150. doi: 10.3390/molecules29133150. Molecules. 2024. PMID: 38999100 Free PMC article.
-
Transcriptomic and Metabolomic Analyses Reveal the Role of Phenylalanine Metabolism in the Maize Response to Stalk Rot Caused by Fusarium proliferatum.Int J Mol Sci. 2024 Jan 25;25(3):1492. doi: 10.3390/ijms25031492. Int J Mol Sci. 2024. PMID: 38338769 Free PMC article.
References
-
- Zhang HY, Chen RZ, Feng GH. Research Advances and Prospect on Wheat Sharp Eyespot in China (in Chinese) J Triticeae Crops. 2007;27:1150–53.
-
- Liu XM, Xiao JG. Histological study on the infection process of Rhizoctonia cerealis (in Chinese) mycosystema. 1999;18(3):288–293.
-
- Iakimova ET, Woltering EJ, Yordanova ZP. Toxin- and cadmium-induced cell death events in tomato suspension cells resemble features of hypersensitive response. J Fruit Ornament Plant Res. 2007;15:15–19.
MeSH terms
Substances
Supplementary concepts
LinkOut - more resources
Full Text Sources
Research Materials
