. 2022 May 10;14(1):49.
doi: 10.1186/s13073-022-01051-9.

Single-cell profiling of human dura and meningioma reveals cellular meningeal landscape and insights into meningioma immune response

Affiliations

Single-cell profiling of human dura and meningioma reveals cellular meningeal landscape and insights into meningioma immune response

Anthony Z Wang et al. Genome Med. .

Abstract

Background: Recent investigations of the meninges have highlighted the importance of the dura layer in central nervous system immune surveillance beyond a purely structural role. However, our understanding of the meninges largely stems from the use of pre-clinical models rather than human samples.

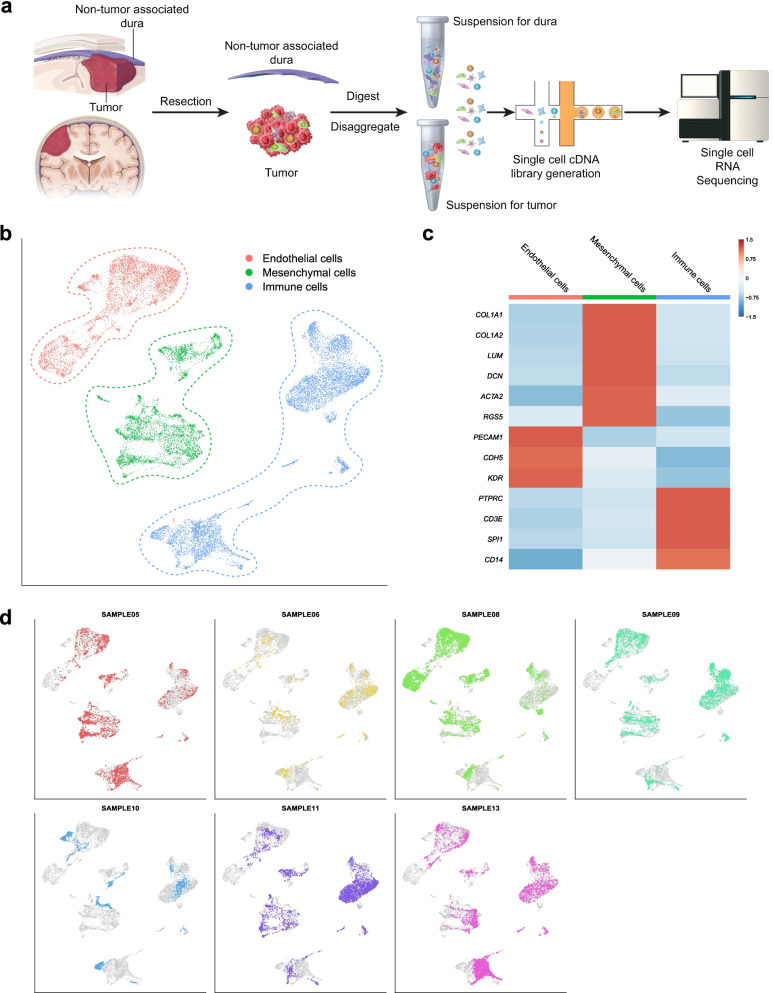
Methods: Single-cell RNA sequencing of seven non-tumor-associated human dura samples and six primary meningioma tumor samples (4 matched and 2 non-matched) was performed. Cell type identities, gene expression profiles, and T cell receptor expression were analyzed. Copy number variant (CNV) analysis was performed to identify putative tumor cells and analyze intratumoral CNV heterogeneity. Immunohistochemistry and imaging mass cytometry was performed on selected samples to validate protein expression and reveal spatial localization of select protein markers.

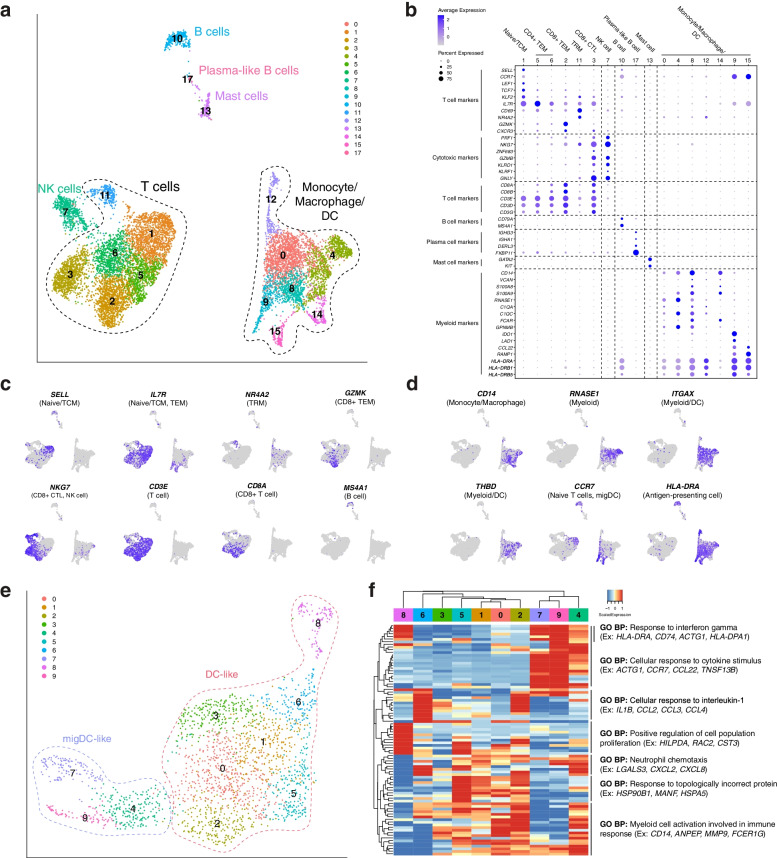
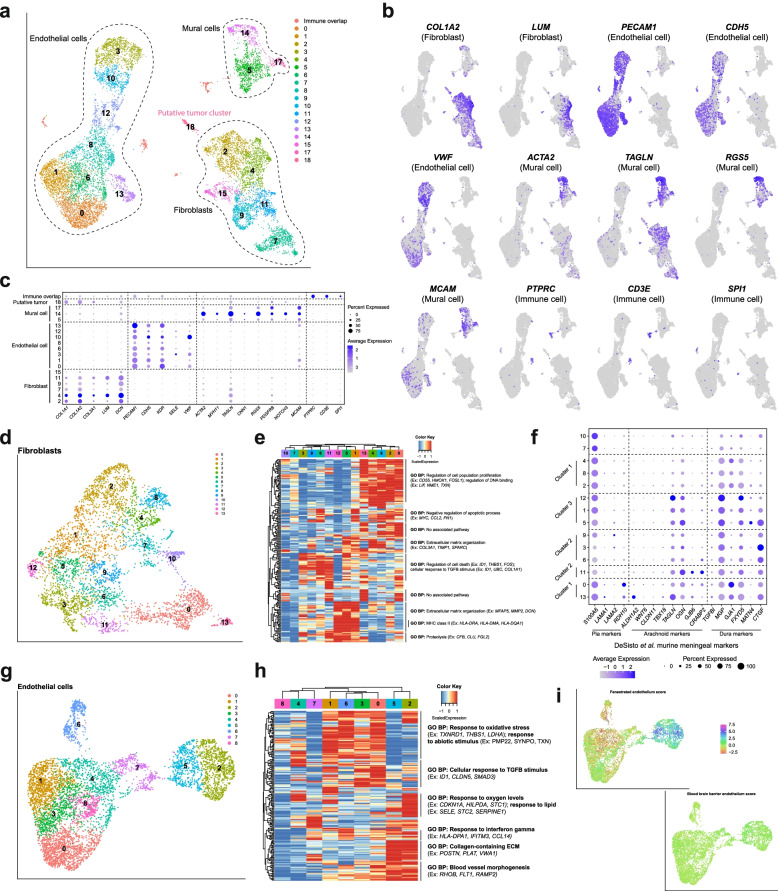
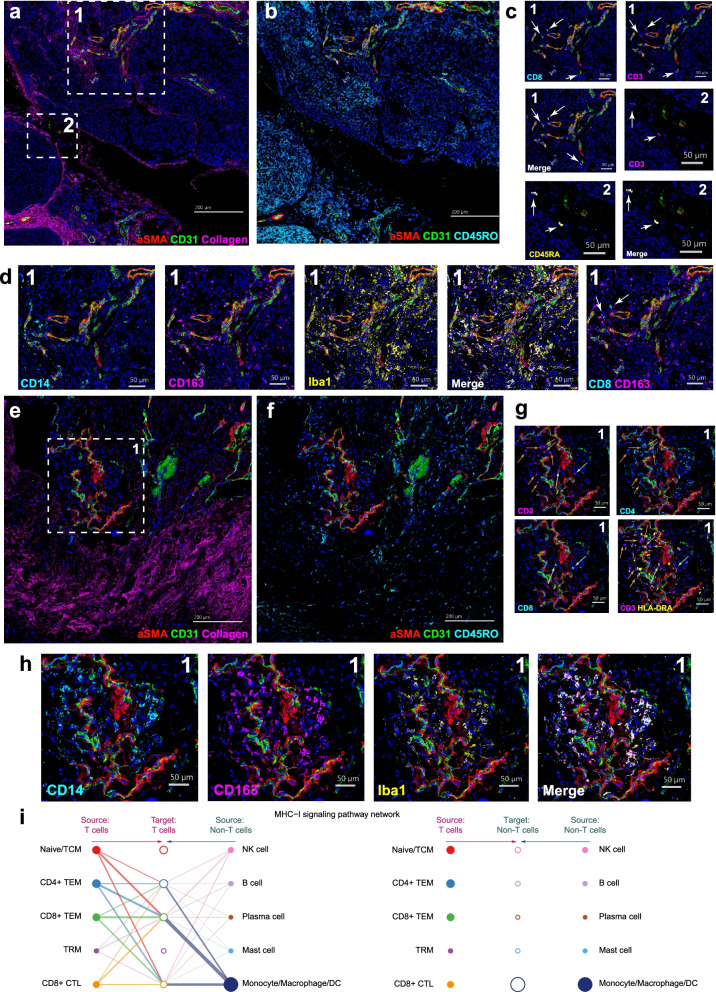
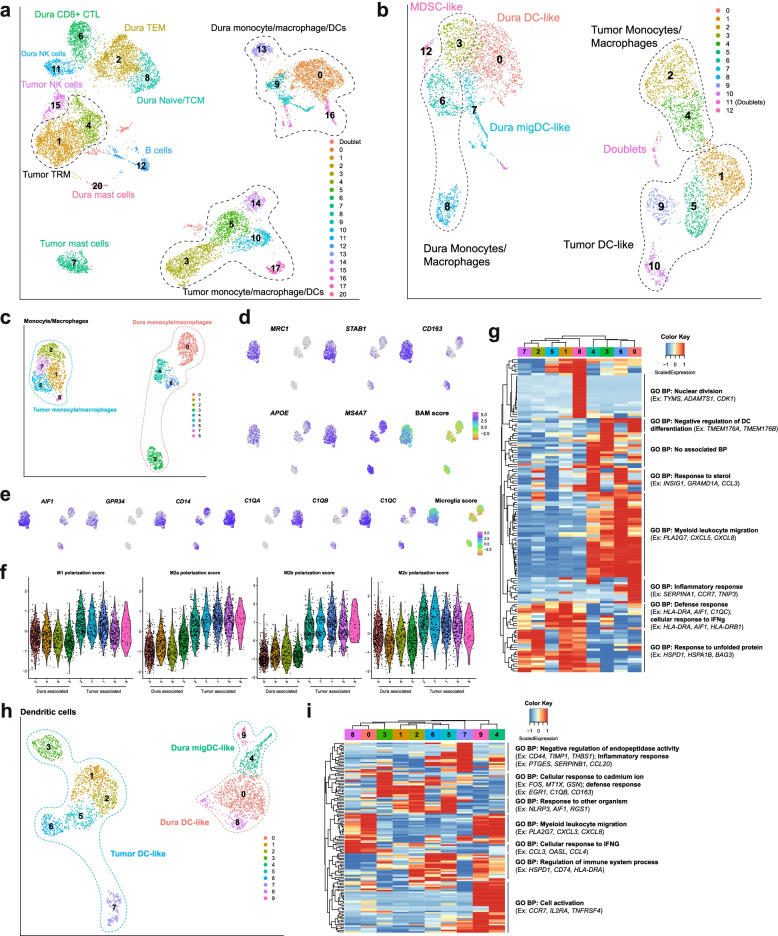
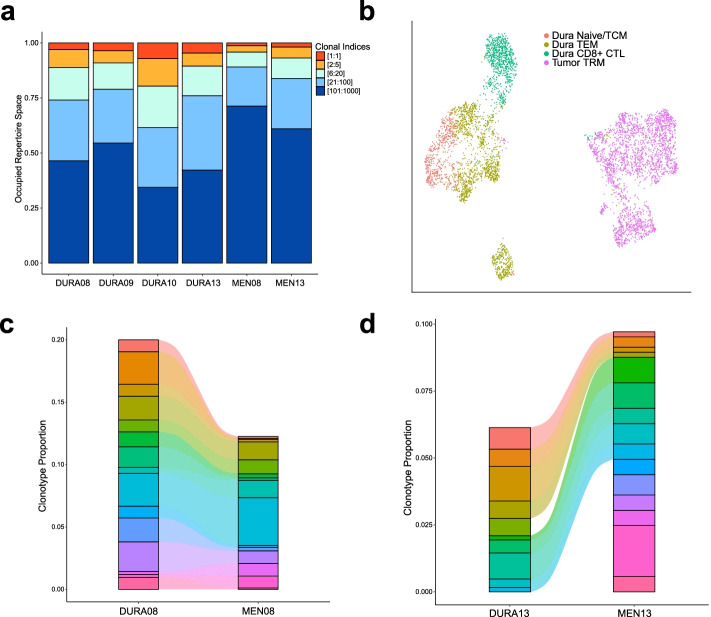
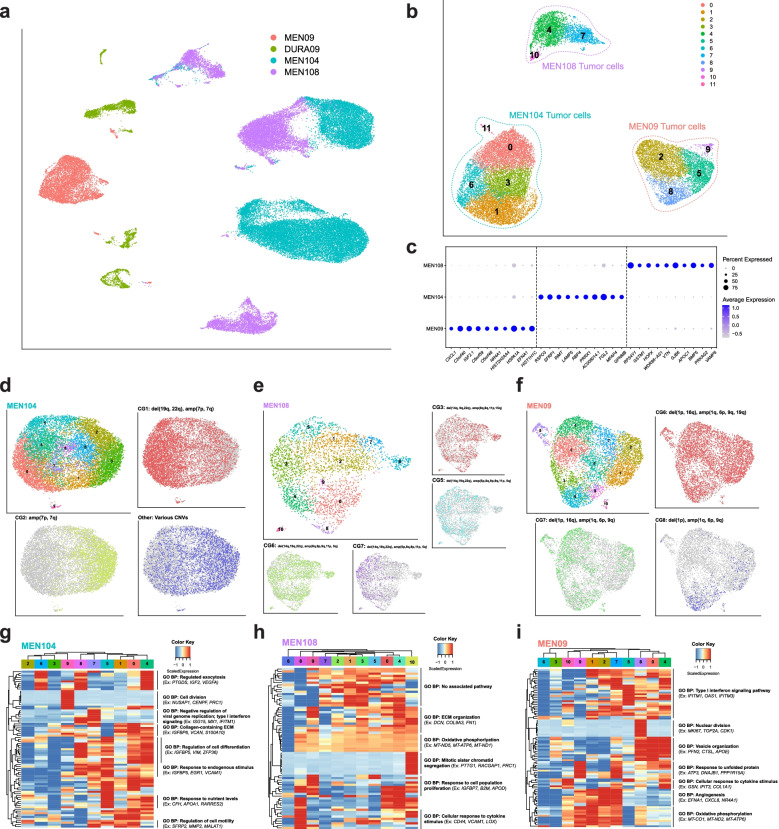
Results: In this study, we use single-cell RNA sequencing to perform the first characterization of both non-tumor-associated human dura and primary meningioma samples. First, we reveal a complex immune microenvironment in human dura that is transcriptionally distinct from that of meningioma. In addition, we characterize a functionally diverse and heterogenous landscape of non-immune cells including endothelial cells and fibroblasts. Through imaging mass cytometry, we highlight the spatial relationship among immune cell types and vasculature in non-tumor-associated dura. Utilizing T cell receptor sequencing, we show significant TCR overlap between matched dura and meningioma samples. Finally, we report copy number variant heterogeneity within our meningioma samples.

Conclusions: Our comprehensive investigation of both the immune and non-immune cellular landscapes of human dura and meningioma at single-cell resolution builds upon previously published data in murine models and provides new insight into previously uncharacterized roles of human dura.

Keywords: Dura; Imaging mass cytometry; Meninges; Single-cell RNA sequencing.


Conflict of interest statement

GPD is a member of the Scientific Advisory Board of Ziopharm Oncology, the clinical advisory board of ImmunoGenesis, and is a co-founder of Immunovalent.

AHK has received research grants from Monteris Medical for a mouse laser therapy study as well as from Stryker and Collagen Matrix for clinical outcomes studies about a dural substitute, which have no direct relation to this study.

ECL has listed the following competing interests: Acera; Alcyone; Caeli Vascular; Cerovations; E15; Immunovalent; inner Cosmos; Intellectual Ventures; Kinexus; Monteris; Neuroloutions, Inc.; Osteovantage, Inc.; Pear Therapeutics, Inc.; red devil 4; Sante Ventures; Sora Imaging Solutions; SympEL Neuromodulation.

The remaining authors declare that they have no competing interests.

Figures

Fig. 1
Fig. 1
Single-cell preparation and sequencing shows diverse cell landscape of human dura. A Illustration of both non-tumor-associated dura and tumor resection and single-cell library preparation. B UMAP visualization of single-cell RNA-seq data identified by cell type. C Representative gene expression of select cell type gene markers. D UMAP visualization of single-cell RNA-seq data highlighting cells originating from each individual patient sample
Fig. 2
Fig. 2
Immune cell composition of human dura consists of functionally diverse lymphoid and myeloid cell types. A UMAP visualization of immune cells identified by cell type (C1: naive/central memory T (TCM) cells; C5, C6: CD4+ effector memory T (TEM) cells; C2: CD8+ TEM cells; C11: resident memory T (TRM) cells; C3: CD8+ cytotoxic T cells (CTLs)). B Dot plot of gene expression of select cell type gene markers. C, D UMAP visualization of select lymphoid and myeloid marker gene expression. E UMAP visualization of dura DCs (C0, C1, C3, C4, C6, C7: DC-like; C2, C5, C8: migDC-like). F Expression heatmap of top 10 genes of top 10 principal components with hierarchical clustering and associated functional enrichment analysis of gene clusters
Fig. 3
Fig. 3
Functionally diverse non-immune cells comprise a significant proportion of human dura. A UMAP visualization of non-immune cells identified by cell type. B UMAP visualization of select endothelial, mural, and fibroblast markers. C Dot plot of representative gene expression of select cell type gene markers. D UMAP visualization of fibroblast endothelial cells. E Expression heatmap of top 15 genes of top 15 principal components of dura fibroblast cells with hierarchical clustering and associated functional enrichment analysis of gene clusters. F Dot plot of select meningeal fibroblast markers from Desisto et al. [39]. G UMAP visualization of dura endothelial cells. H Expression heatmap of top 15 genes of top 15 principal components of dura endothelial cells with hierarchical clustering and associated functional enrichment analysis of gene clusters. I UMAP visualization of fenestrated endothelium and blood-brain barrier scores
Fig. 4
Fig. 4
Imaging mass cytometry of a human dura sample reveals intricate spatial relationships among immune, endothelial, and mesenchymal cell types. A, B Imaging mass cytometry of human dura sample DURA02 labeled with markers specified and specific regions of interest (ROIs) highlighted by dashed white boxes. C, D Relative position of each image is denoted by marked number in the top left or right corner. Markers are specified and color coded. White arrows label cells of interest. E, F Imaging mass cytometry of human dura sample DURA05 with markers specified and the specific region of interest (ROI) highlighted by a dashed white box. G, H Relative position of each image is denoted by marked number at the top right corner. Markers are specified and color coded. Green arrows represent CD8+ T cells and orange arrows represent CD4+ T cells. I Hierarchical plot showing the inferred network for MHC-I signaling for immune cells from Fig. 2A. The left and right portions of the plot show autocrine and paracrine signaling to T cells and remaining immune cells, respectively. Solid circles represent the source of MHC class I ligands and open circles represent the target of said MHC class I ligands. Circle sizes are proportional to the number of cells and width of connecting lines indicate the communication probability of said interaction
Fig. 5
Fig. 5
Non-tumor-associated human dura and meningioma tumor samples show distinctively different immune cell populations. A UMAP visualization of dura and tumor immune cells identified by cell type. B UMAP visualization of dura and tumor monocyte/macrophage/DCs identified by cell type. C UMAP visualization of dura and tumor monocyte/macrophages identified by cell type. D UMAP visualization of select border-associated macrophage (BAM) gene markers and aggregated score. E UMAP visualization of select microglial gene markers and aggregated score. F Violin plots of M1, M2a, M2b, and M2c macrophage polarization state scores of each cluster from Fig. 5C. G Expression heatmap of the top 15 genes of the top 10 principal components with hierarchical clustering and associated functional enrichment analysis of gene clusters. H UMAP visualization of dura and tumor DCs identified by cell type. I Expression heatmap of the top 15 genes of the top 10 principal components with hierarchical clustering and associated functional enrichment analysis of gene clusters
Fig. 6
Fig. 6
TCR frequency and expression overlap in paired non-tumor-associated dura and meningioma samples. A Clonal frequency of the dominant TCR, designated by absolute count, and groupings of TCRs ranked by absolute count. B UMAP visualization of dura and tumor T cells identified by cell type. C, D Alluvial plot demonstrating overlap of the top 15 and 16, respectively, TCRs in paired dura and meningioma samples ranked by relative frequency
Fig. 7
Fig. 7
Analysis of meningioma cells reveals subclonal tumor populations with varying chromosomal abnormalities. A UMAP visualization of one paired dura and meningioma sample and two additional meningioma samples. B UMAP visualization of predicted tumor cells from MEN104, MEN105, and MEN09 samples. C Top 10 DEGs expressed in >50% cells of each sample-specific tumor cluster. D-F UMAP visualization of each individual sample-specific tumor cluster with unsupervised clustering and highlighted by respective CNV group (CG#) identities. G–I Expression heatmaps of the top 10 genes of the top 10 principal components of sample-specific tumor cells (D-F) with hierarchical clustering and associated functional enrichment analysis of gene clusters

References

    1. Dasgupta K, Jeong J. Developmental biology of the meninges. Genesis. 2019;57:e23288. doi: 10.1002/dvg.23288. - DOI - PMC - PubMed
    1. Adeeb N, Mortazavi MM, Tubbs RS, Cohen-Gadol AA. The cranial dura mater: a review of its history, embryology, and anatomy. Childs Nerv Syst. 2012;28:827–837. doi: 10.1007/s00381-012-1744-6. - DOI - PubMed
    1. Greenberg RW, Lane EL, Cinnamon J, Farmer P, Hyman RA. The cranial meninges: anatomic considerations. Semin Ultrasound CT MR. 1994;15:454–465. doi: 10.1016/S0887-2171(05)80017-4. - DOI - PubMed
    1. Snell RS. Clinical neuroanatomy. Lippincott Williams & Wilkins; 2010.
    1. Miura M, Kato S, von Lüdinghausen M. Lymphatic drainage of the cerebrospinal fluid from monkey spinal meninges with special reference to the distribution of the epidural lymphatics. Arch Histol Cytol. 1998;61:277–286. doi: 10.1679/aohc.61.277. - DOI - PubMed

Publication types

LinkOut - more resources