. 2022 May 9;17(1):10.
doi: 10.1186/s13062-022-00324-y.

An integrative in-silico analysis discloses a novel molecular subset of colorectal cancer possibly eligible for immune checkpoint immunotherapy

Affiliations

An integrative in-silico analysis discloses a novel molecular subset of colorectal cancer possibly eligible for immune checkpoint immunotherapy

Pasquale Sibilio et al. Biol Direct. .

Abstract

Background: Historically, the molecular classification of colorectal cancer (CRC) was based on the global genomic status, which identified microsatellite instability in mismatch repair (MMR) deficient CRC, and chromosomal instability in MMR proficient CRC. With the introduction of immune checkpoint inhibitors, the microsatellite and chromosomal instability classification regained momentum as the microsatellite instability condition predicted sensitivity to immune checkpoint inhibitors, possibly due to both high tumor mutation burden (TMB) and high levels of infiltrating lymphocytes. Conversely, proficient MMR CRC are mostly resistant to immunotherapy. To better understand the relationship between the microsatellite and chromosomal instability classification, and eventually discover additional CRC subgroups relevant for therapeutic decisions, we developed a computational pipeline that include molecular integrative analysis of genomic, epigenomic and transcriptomic data.

Results: The first step of the pipeline was based on unsupervised hierarchical clustering analysis of copy number variations (CNVs) versus hypermutation status that identified a first CRC cluster with few CNVs enriched in Hypermutated and microsatellite instability samples, a second CRC cluster with a high number of CNVs mostly including non-HM and microsatellite stable samples, and a third cluster (7.8% of the entire dataset) with low CNVs and low TMB, which shared clinical-pathological features with Hypermutated CRCs and thus defined Hypermutated-like CRCs. The mutational features, DNA methylation profile and base substitution fingerprints of these tumors revealed that Hypermutated-like patients are molecularly distinct from Hypermutated and non-Hypermutated tumors and are likely to develop and progress through different genetic events. Transcriptomic analysis highlighted further differences amongst the three groups and revealed an inflamed tumor microenvironment and modulation Immune Checkpoint Genes in Hypermutated-like CRCs.

Conclusion: Therefore, our work highlights Hypermutated-like tumors as a distinct and previously unidentified CRC subgroup possibly responsive to immune checkpoint inhibitors. If further validated, these findings can lead to expanding the fraction of patients eligible to immunotherapy.

Keywords: Colorectal cancer; Immunoinformatics; Immunotherapy; Meta-analysis; Multi-omics.


Conflict of interest statement

The authors declare that they have no competing interests.

Figures

Fig. 1
Fig. 1
Computational pipeline flowchart
Fig. 2
Fig. 2
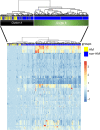
Unsupervised hierarchical clustering analysis based on CNVs data of the 520 CRC patients selected from TCGA-COAD and READ projects. The lines in the heatmap represent significant focal alteration. The columns correspond to the 520 patients. HM and non-HM samples are indicated in yellow and blue colors, respectively. This analysis identified two main clusters: cluster a (ClA) and cluster b (ClB). ClA (117/520; 22.5%) is characterized by a few events of CNVs along the chromosome regions and was enriched in HM samples (n = 76/117; 63.9%). ClB contains samples with a high number of CNVs events and it mostly consists of non-HM samples (n = 401/403; 99%). Among ClA, we identified a sub-group of tumors (called HM-like; n = 41/520; 7.8%) with a similar CNV profile of ClA, also characterized by a low TMB. To the right-hand side of the figure, a scale indicates the color code relative to the log2 segment mean value of CNVs (ranging from − 1 up to 3)
Fig. 3
Fig. 3
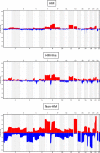
Frequency of CNV events along the genome identified in HM, HM-like and non-HM samples. Frequencies (vertical axis, 0–100%) are plotted as a function of the chromosome location. Copy number gains and losses are highlighted in red and blue, respectively
Fig. 4
Fig. 4
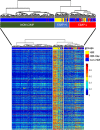
Unsupervised hierarchical clustering analysis based on CpGs methylation data of the 382 patients selected from TCGA-COAD and READ projects. The lines on the heatmap represent the 1000 most differentially methylated CpGs probes between HM, HM-like and non-HM groups. The columns correspond to the 382 patients. Inside the cells of the heatmap are reported the β-values which represent the methylation rate of the probes. The HM patients are reported in yellow; the HM-like patients in red while the non-HM patients in blue. The hierarchical clustering dendrogram supported three distinct tumour groups: CIMP-H (n = 57) defined by an high rate of CpGs probes methylated; CIMP-L (n = 107) with low rate of CpGs probes methylated and non-CIMP (n = 218) characterized by the absence of CpGs probes methylated
Fig. 5
Fig. 5
WGCNA analysis. a Heatmap of module-trait associations. In the heatmap, each row corresponds to a module eigengene and each column to a trait. Each cell contains the corresponding correlation and P value. The table is color-coded by correlation according to the color legend. The traits along the columns have been numerically encoded as follows: HM status (no = 1, yes = 2); HM like status (no = 1, yes = 2); non-HM status (no = 1, yes = 2). The colour labels of modules with at least one statistically significant correlation were highlighted. b, c KEGG pathways. Results of KEGG pathways enrichment analysis for the most representative genes (module membership > 0.9) falling within the modules statistically significant correlated with the HM status (b), HM like status (c), and non-HM status (d). The names of genes annotated for the enriched KEGG pathways were reported
Fig. 6
Fig. 6
Results of immune signatures analysis performed by ImSig. The boxplots (A and B) show the gene expression of T and NK signature genes (estimated relative abundance) across the HM, non-HM and HM-like groups. Statistical analysis of data was performed using analysis of variance (ANOVA) followed by multiple comparison Tukey’s test. **P < .01, *P < .05
Fig. 7
Fig. 7
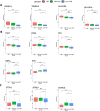
Example of ICGs differentially expressed in HM, non-HM and HM-like groups. The Box Plots show A ICGs more expressed in HM group versus non-HM, which may (KIR genes) or may not (HLA genes) be significantly more expressed in HM-like vs non-HM tumors; B gene sharing a similar trend of expression between HM and HM-like; C gene specifically more expressed in HM-like group (VTCN1 and BTNL9) or with an opposite trend of expression in HM versus HM-like (CD40LG). The analysis was performed using the multiple comparison of the three subgroups using Wald test and P value was adjusted according to the Benjamini–Hochberg method. Thresholds for FDR < 0.1 and Log2 Fold Change > 0.4 were used to select significant differentially expressed genes

Similar articles

Cited by

References

    1. Cancer Statistics, 2021—PubMed. https://pubmed-ncbi-nlm-nih-gov.ezproxy.uniroma1.it/33433946/. Accessed 13 Dec 2021.
    1. Nguyen HT, Duong H-Q. The molecular characteristics of colorectal cancer: implications for diagnosis and therapy. Oncol Lett. 2018;16(1):9–18. doi: 10.3892/ol.2018.8679. - DOI - PMC - PubMed
    1. Ganesh K, Stadler ZK, Cercek A, Mendelsohn RB, Shia J, Segal NH, Diaz LA. Immunotherapy in colorectal cancer: rationale, challenges and potential. Nat Rev Gastroenterol Hepatol. 2019;16(6):361–375. doi: 10.1038/s41575-019-0126-x. - DOI - PMC - PubMed
    1. Chalmers ZR, Connelly CF, Fabrizio D, Gay L, Ali SM, Ennis R, Schrock A, et al. Analysis of 100,000 human cancer genomes reveals the landscape of tumor mutational burden. Genome Med. 2017;9:1–14. doi: 10.1186/s13073-017-0424-2. - DOI - PMC - PubMed
    1. Goodman AM, Kato S, Bazhenova L, Patel SP, Frampton GM, Miller V, Stephens PJ, Daniels GA, Kurzrock R. Tumor mutational burden as an independent predictor of response to immunotherapy in diverse cancers. Mol Cancer Ther. 2017;16(11):2598–2608. doi: 10.1158/1535-7163.MCT-17-0386. - DOI - PMC - PubMed

Publication types

MeSH terms

Substances