. 2022 May 9;24(1):30.
doi: 10.1186/s12968-022-00864-2.

Quantification correction for free-breathing myocardial T mapping in mice using a recursively derived description of a T* relaxation pathway

Affiliations

Quantification correction for free-breathing myocardial T mapping in mice using a recursively derived description of a T* relaxation pathway

Maximilian Gram et al. J Cardiovasc Magn Reson. .

Abstract

Background: Fast and accurate T mapping in myocardium is still a major challenge, particularly in small animal models. The complex sequence design owing to electrocardiogram and respiratory gating leads to quantification errors in in vivo experiments, due to variations of the T relaxation pathway. In this study, we present an improved quantification method for T using a newly derived formalism of a T* relaxation pathway.

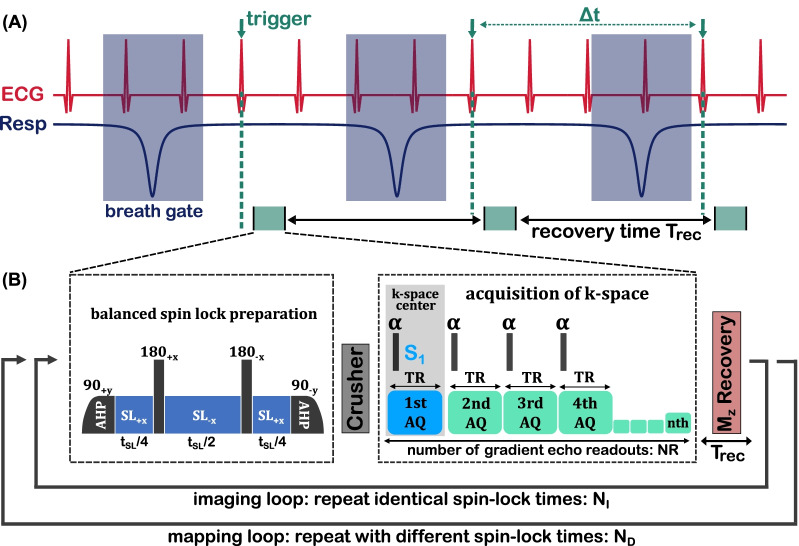
Methods: The new signal equation was derived by solving a recursion problem for spin-lock prepared fast gradient echo readouts. Based on Bloch simulations, we compared quantification errors using the common monoexponential model and our corrected model. The method was validated in phantom experiments and tested in vivo for myocardial T mapping in mice. Here, the impact of the breath dependent spin recovery time Trec on the quantification results was examined in detail.

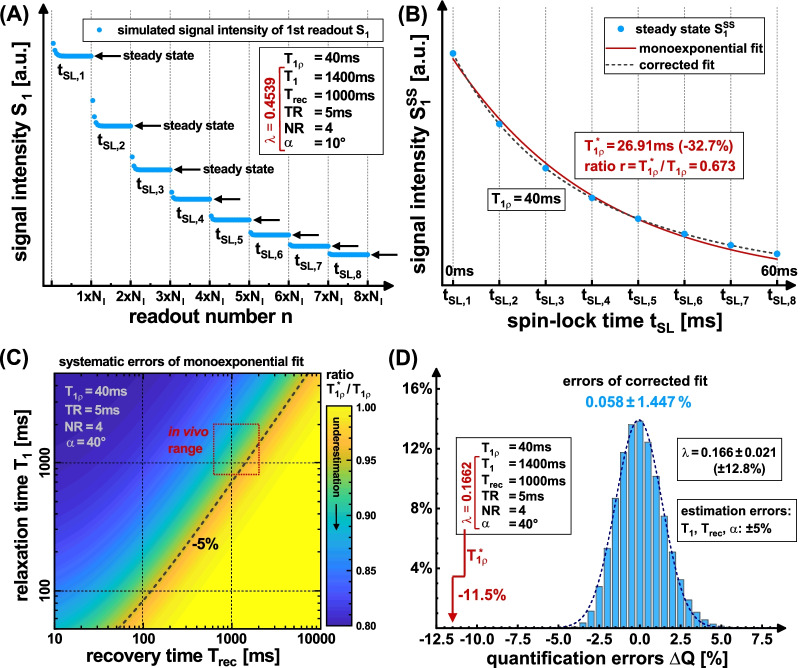
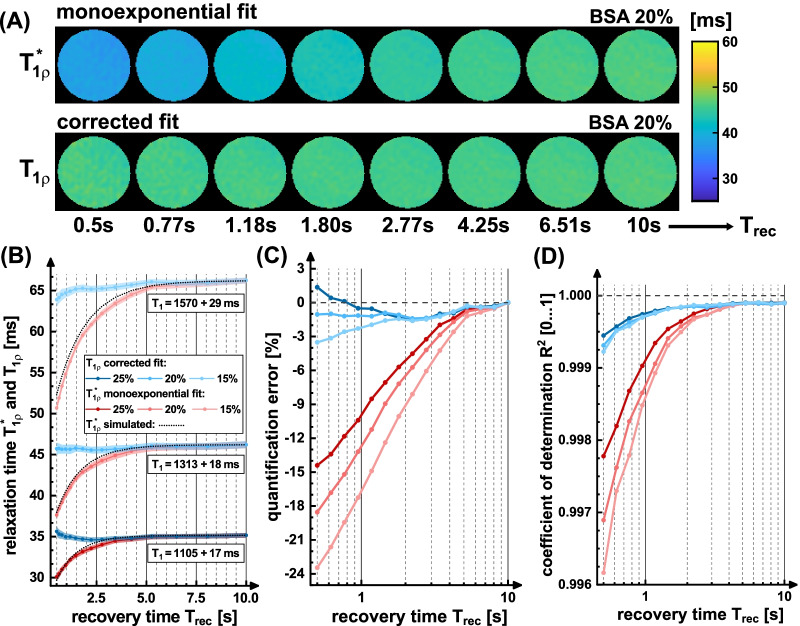
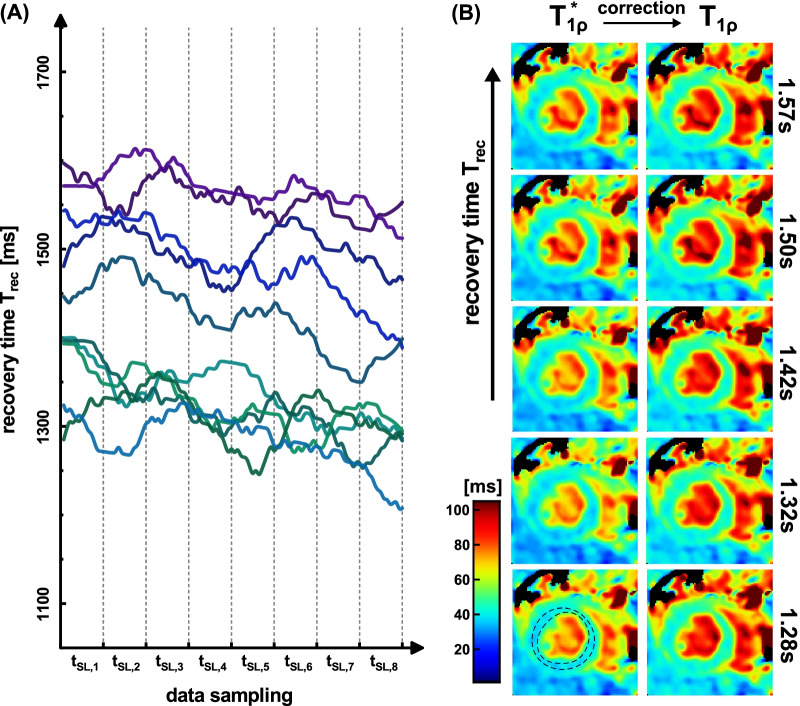
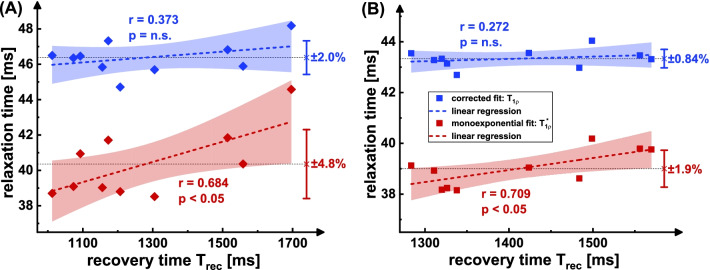
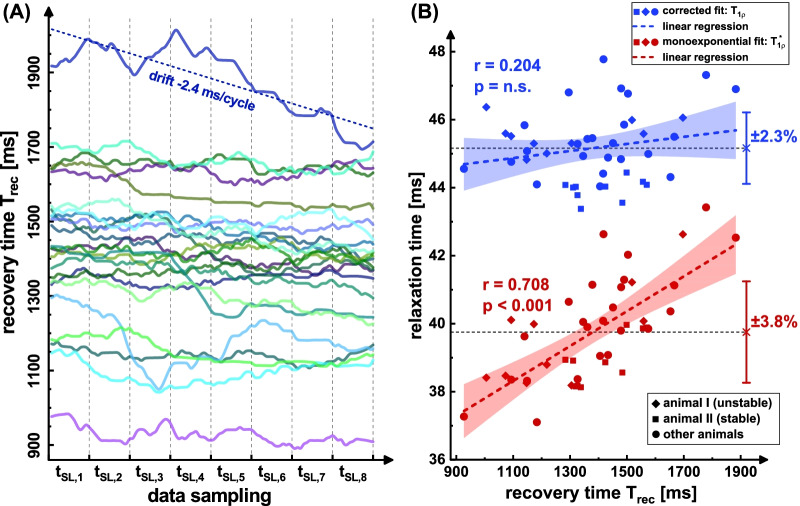
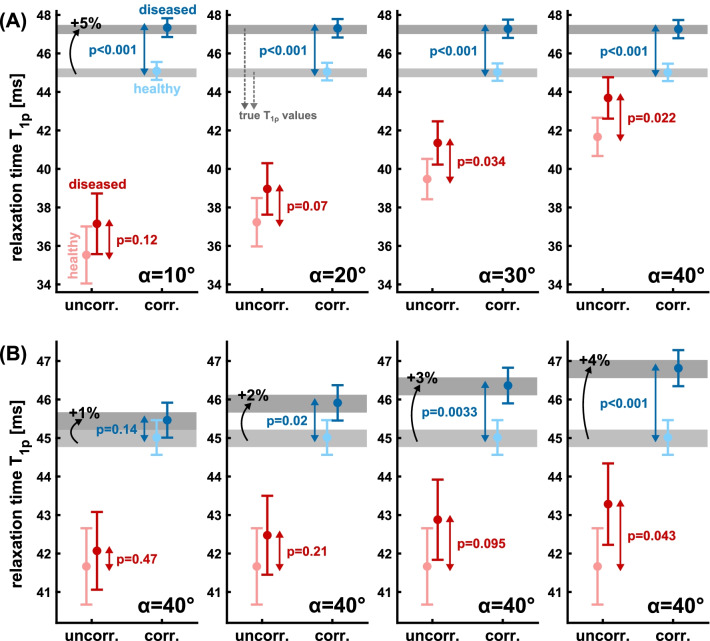
Results: Simulations indicate that a correction is necessary, since systematically underestimated values are measured under in vivo conditions. In the phantom study, the mean quantification error could be reduced from - 7.4% to - 0.97%. In vivo, a correlation of uncorrected T with the respiratory cycle was observed. Using the newly derived correction method, this correlation was significantly reduced from r = 0.708 (p < 0.001) to r = 0.204 and the standard deviation of left ventricular T values in different animals was reduced by at least 39%.

Conclusion: The suggested quantification formalism enables fast and precise myocardial T quantification for small animals during free breathing and can improve the comparability of study results. Our new technique offers a reasonable tool for assessing myocardial diseases, since pathologies that cause a change in heart or breathing rates do not lead to systematic misinterpretations. Besides, the derived signal equation can be used for sequence optimization or for subsequent correction of prior study results.

Keywords: Cardiac; Correction; Mapping; Quantitative MRI; Radial; Spin-lock; T1rho; T1ρ.


Conflict of interest statement

The authors declare that they have no competing interests.

Figures

Fig. 1
Fig. 1
Sequence design for myocardial T mapping in small animals. The high heart and respiratory rates require the use of prospective triggering in combination with breath gating. Usually a trigger on the R-wave and dynamic trigger delays are applied before the spin-lock (SL) preparation. The acquisition window in diastole is very short (≈20–30 ms), so that several readouts can only be carried out by using fast gradient echoes. To acquire a single T weighted image, the experiment has to be repeated several times (NI). For T mapping, imaging has to be repeated with different SL times (ND). The sequence parameters of the readout (Trec, TR, NR, α) have a decisive impact on the relaxation pathway of T. This is explained in Fig. 2 by considering the signal S1
Fig. 2
Fig. 2
Simulation results of the investigation of quantification errors. The signal of the first acquisition S1 was calculated using Bloch simulations for realistic in vivo parameters (A). An individual steady state S1SS is reached for each SL time. When using small flip angles, more repetitions are required for this. In B the values were fitted with the common monoexponential model. The relaxation time T* calculated in this way is systematically below the true T value. The relationship between the systematic underestimation and the two parameters T1 and Trec is shown in C. From this it can be seen that an incomplete spin recovery is the decisive point. A systematic error of − 2% to − 16% is to be expected in vivo. If the corrected fit is used (novel signal equation), errors only arise if incorrect sequence parameters are assumed (D). The error propagation is moderate here, since ± 5% estimation errors in the sequence parameters only lead to ± 1.447% errors in T
Fig. 3
Fig. 3
Results of the phantom experiments. In A, calculated relaxation time maps using the monoexponential model and the corrected model are compared. The increase in T* with Trec can be seen visually. The measured T* values agree well with theoretically predicted values (B). The mean deviation from the prediction for the phantoms with increasing BSA concentration was 0.47%, 0.84% and 1.38%. The corrected fit, on the other hand, delivers nearly constant results. This is confirmed in the ROI based evaluation in B and C. The highest deviations arise in the phantom with the longest T1 relaxation time. Corrected fitting reduced the quantification error averaged over all measurements from -7.4% to -0.97%. The errors in the corrected fit could result from incorrect values of T1, Trec, or α. The R2 values are generally higher for the corrected fit (> 0.999). However, for monoexponential fitting, R2 values > 0.996 were achieved despite high quantification errors
Fig. 4
Fig. 4
Results of the in vivo measurements at high Trec variability. The recovery times recorded during the data acquisition are shown in A. The different colored curves show the individual Trec times for 10 repetitions of the T mapping sequence in animal I. In B the calculated relaxation time maps (short axis view, isotropic resolution 250 µm) for the monoexponential fit (left) and the corrected fit (right) are shown. 5 repetitions with different Trec times are exemplary shown. The mean T1 value 1391 ± 34 ms in myocardial tissue was obtained by an inversion recovery snapshot flash (IRSF) sequence and used to calculate the corrected maps. The maps show distinct artifact formation, which is primarily due to the unsteady breathing. The region-of-interest (ROI) based correlation analysis with Trec is shown in Fig. 6A
Fig. 5
Fig. 5
Results of the in vivo measurements at low Trec variability. The recovery times recorded during the data acquisition are shown in A. The different colored curves show the individual Trec times for 10 repetitions of the T mapping sequence in animal II. In B the calculated relaxation time maps (short axis view, isotropic resolution 250 µm) for the monoexponential fit (left) and the corrected fit (right) are shown. 5 repetitions with different Trec times are exemplary shown. The mean T1 value 1342 ± 44 ms in myocardial tissue was obtained by an IRSF sequence and used to calculate the corrected maps. A high image quality and less streaking is perceptible due to reduced motion issues. The ROI based correlation analysis with Trec is shown in Fig. 6B
Fig. 6
Fig. 6
Correlation analysis of the measured relaxation times with Trec. The T and T* values are the mean values within the left ventricular ROIs (Figs. 4B, 5B). The Trec values correspond to the averaged recovery times during the corresponding individual measurements (Figs. 4A, 5A). A Shows the results with high and (B) shows the results with low Trec variability. In both cases there is a significant positive correlation (r = 0.684, r = 0.709, p < 0.05) for uncorrected monoexponential fitting and no significant correlation (r = 0.373, r = 0.272) for corrected fitting. The plots also show the 95% confidence intervals (light red/blue areas) and the respective mean values and standard deviations as error bars in both cases
Fig. 7
Fig. 7
Correlation analysis of the measured relaxation times with Trec for n = 14 different animals and N = 44 individual measurements. The recovery times recorded during the data acquisition are shown in A for the remaining animals. The evaluation was carried out analogously to animal I and animal II (Figs. 4, 5, 6). Here, corrections were made for all animals with the T1 estimate of 1400 ms. In B a significant positive correlation for uncorrected fitting (r = 0.708, p < 0.001) and no significant correlation (r = 0.204) for corrected fitting was identified. The plots also show the 95% confidence intervals (light red/blue areas) and the respective mean values and standard deviations as error bars in both cases. Since comparisons were made between different animals, the variation in relaxation times is higher here than, for example, in the single study of animal II
Fig. 8
Fig. 8
Simulation of in vivo experiments for the detectability of diseased tissue. The gray areas illustrate the true T values for healthy (light gray) and diseased tissue (dark gray). A natural variation of ± 1% was assumed in the simulation for the N = 1000 random experiments. The uncorrected fit results (red) and the corrected fit results (blue) were compared. In A, the impact of radiofrequency (RF) flip angle choice (α = 10–40°) on quantification accuracy and significance levels at 5% increased T in diseased tissue was investigated. In B the sensitivity of detectability for increased T in the range 1–4% was investigated for α = 40°. The corrected fit provides consistent results for all simulated RF flip angles (p < 0.001) and improved detection sensitivity for increased T (p < 0.05 for + 2%)
Fig. 9
Fig. 9
Simulation of in vivo experiments for the detectability of diseased tissue. The gray areas illustrate the true T values for healthy (light gray) and diseased tissue (dark gray). A natural variation of ± 1% was assumed in the simulation for the N = 1000 random experiments. For the RF flip angle α = 40° was used. The impact of varying T1 values in diseased tissue on T quantification and detectability was investigated. A 5% increased T in diseased tissue was considered. In A, the uncorrected fit results (red) and the corrected fit results (blue) were compared. Here, the correction was performed using the baseline T1 value (1400 ms) for both healthy and diseased tissue. In (B), the corrected fit using the true T1 values of healthy and diseased tissue was supplemented. The results show significantly improved detectability based on the corrected fit (A). Using true T1 values instead of baseline values, the quantification accuracy can be slightly increased (B)

Similar articles

Cited by

References

    1. Roth GA, Forouzanfar MH, Moran AE, Barber R, Nguyen G, Feigin VL, Naghavi M, Mensah GA, Murray CJL. Demographic and epidemiologic drivers of global cardiovascular mortality. N Engl J Med. 2015;372:1333–1341. doi: 10.1056/NEJMoa1406656. - DOI - PMC - PubMed
    1. Virani SS, Alonso A, Aparicio HJ, Benjamin EJ, Bittencourt MS, et al. American Heart Association Council on Epidemiology and Prevention Statistics Committee and Stroke Statistics Subcommittee. Heart Disease and Stroke Statistics-2021 Update: A Report From the American Heart Association. Circulation. 2021;143(8):e254–e743. doi: 10.1161/CIR.0000000000000950. - DOI - PubMed
    1. Frantz S, Bauersachs J, Ertl G. Post-infarct remodelling: contribution of wound healing and inflammation. Cardiovasc Res. 2009;81(3):474–481. doi: 10.1093/cvr/cvn292. - DOI - PMC - PubMed
    1. Chiong M, Wang Z, Pedrozo Z, et al. Cardiomyocyte death: mechanisms and translational implications. Cell Death Dis. 2011;2:e244. doi: 10.1038/cddis.2011.130. - DOI - PMC - PubMed
    1. Talman V, Ruskoaho H. Cardiac fibrosis in myocardial infarction-from repair and remodeling to regeneration. Cell Tissue Res. 2016;365(3):563–581. doi: 10.1007/s00441-016-2431-9. - DOI - PMC - PubMed

Publication types