. 2022 Jul;113(7):2311-2322.
doi: 10.1111/cas.15391. Epub 2022 Jun 29.

Opposing roles of HDAC6 in liver regeneration and hepatocarcinogenesis

Affiliations

Opposing roles of HDAC6 in liver regeneration and hepatocarcinogenesis

Sophors Phorl et al. Cancer Sci. 2022 Jul.

Abstract

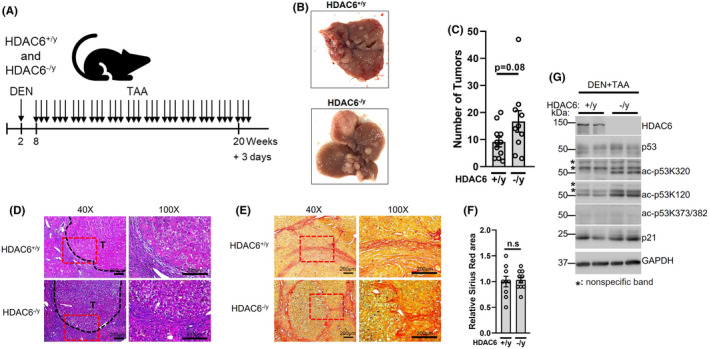
Histone deacetylase 6 (HDAC6), a deacetylase of p53, has emerged as a privileged inhibitory target for cancer therapy because of its deacetylating activity for p53 at K120 and K373/382. However, intricate roles of HDAC6 in hepatocellular carcinogenesis have been suggested by recent evidence, namely that HDAC6 ablation suppresses innate immunity, which plays critical roles in tumor immunosurveillance and antitumor immune responses. Therefore, it is valuable to determine whether HDAC6 ablation inhibits hepatocellular carcinogenesis using in vivo animal models. Here, we firstly showed that HDAC6 ablation increased K320 acetylation of p53, known as pro-survival acetylation, in all tested animal models but did not always increase K120 and K373/382 acetylation of p53, known as pro-apoptotic acetylation. HDAC6 ablation induced cellular senescence in primary MEFs and inhibited cell proliferation in HepG2 cells and liver regeneration after two-thirds partial hepatectomy. However, the genetic ablation of HDAC6 did not inhibit hepatocarcinogenesis, but instead slightly enhanced it in two independent mouse models (DEN + HFD and DEN + TAA). Notably, HDAC6 ablation significantly promoted hepatocarcinogenesis in a multiple DEN treatment hepatocellular carcinoma (HCC) mouse model, mimicking chronic DNA damage in the liver, which correlated with hyperacetylation at K320 of p53 and a decrease in inflammatory cytokines and chemokines. Our data from three independent in vivo animal HCC models emphasize the importance of the complex roles of HDAC6 ablation in hepatocellular carcinogenesis, highlighting its immunosuppressive effects.

Keywords: HDAC6; acetylation; hepatocellular carcinogenesis; innate immunity; p53.


Figures

FIGURE 1
FIGURE 1
Loss of histone deacetylase 6 (HDAC6), induces p53 acetylation and senescence in primary MEFs. (A), Primary HDAC6+/y and HDAC6−/y MEFs were subjected to SA‐β‐gal and DAPI staining, at passage 11. (B), A percentage of SA‐β‐gal–positive cells to total cell numbers (n = 3). (C), The sample from (A) was subject to Western blot for HDAC6, p53, acetylated p53 (K320, K120, and K373/382), p21, and GAPDH (asterisk, nonspecific band). (D), qRT‐PCR analysis of p21 mRNA expression (n = 3) from MEFs as described in (A)
FIGURE 2
FIGURE 2
Histone deacetylase 6 (HDAC6) knockdown in HepG2 induces p53 acetylation and inhibits cell growth. A‐B, HepG2 cells were transfected with three independent HDAC6 siRNAs. (A), MTT assay analysis to quantify cell viability (n = 4 per group). (B), Western blot analysis of HDAC6, p53, acetylated p53 (K320, K120, and K373/382), p21, and GAPDH at 48 h after transfection. (C), HepG2 cells were cotransfected with HDAC6 and p53 siRNA, and subjected to Western blot for p21, p53, HDAC6, and GAPDH
FIGURE 3
FIGURE 3
Loss of histone deacetylase 6 (HDAC6) inhibits hepatocyte proliferation after two‐thirds hepatectomy (PHx). (A), Photographs of the resected surface of livers during PHx. (B), Liver to body weight ratio after PHx. (C), H&E staining of control and regenerative livers after PHx. (D), The number of hepatocyte nuclei per high‐power field. (E), BrdU incorporation assay after PHx. (F), Percentage of BrdU‐positive hepatocytes after PHx (n = 4 per group). (G), Western blot analysis of HDAC6, p53, Ac‐p53K320, p21, and β‐actin in liver (asterisk, nonspecific band)
FIGURE 4
FIGURE 4
Effect of histone deacetylase 6 (HDAC6) deficiency in the diethylnitrosamine (DEN) + high‐fat diet (HFD)–induced hepatocellular carcinoma (HCC) model. (A), Schematic representation of DEN + HFD–induced HCC protocol. (B), Representative images of livers from HDAC6+/y and HDAC6−/y mice treated as in (A). (C), The number of tumors (>3 mm3) in HDAC6+/y and HDAC6−/y livers. (n = 8 per group). D, H&E staining of HDAC6+/y and HDAC6−/y livers treated as in (A) (T, tumor; black dotted line, separate tumor and normal tissues; red dotted line, region of the field magnified). E, Sirius Red staining of HDAC6+/y and HDAC6−/y livers treated as in (A) (red dotted line, region of the field magnified). F, Quantification of the Sirius Red–positive area from (E) (n = 8 per group). G, Western blot for HDAC6, p21, p53, acetylated p53 (K320, K120, and K373/382), and GAPDH (n = 2 per genotype)
FIGURE 5
FIGURE 5
Effect of histone deacetylase 6 (HDAC6) deficiency in the (diethylnitrosamine) DEN + (thioacetamide) TAA–induced hepatocellular carcinoma (HCC) model. (A), Schematic representation of the DEN + TAA–induced HCC protocol. (B), Representative images of livers from HDAC6+/y and HDAC6−/y mice treated as in (A). (C), The total number of tumors in HDAC6+/y and HDAC6−/y livers (n = 10‐11 per group). (D), H&E staining of HDAC6+/y and HDAC6−/y livers after DEN + TAA treatment (T, tumor; black dotted line, separate tumor and normal tissues; red dotted line, region of the field magnified). (E), Sirius Red staining of HDAC6+/y and HDAC6−/y livers after DEN + TAA (red dotted line, region of the field magnified). (F), Quantification of the Sirius Red–positive area from (E) (n = 8 per group). (G), Western blot to check levels of HDAC6, p21, p53, acetylated p53 (K320, K120, and K373/382), and GAPDH (asterisk, nonspecific band)
FIGURE 6
FIGURE 6
Effect of histone deacetylase 6 (HDAC6) deficiency in the multiple diethylnitrosamine (DEN) treatment hepatocellular carcinoma (HCC) model. (A), Schematic representation of the multiple DEN treatment–induced HCC protocol. (B), Representative images of livers from HDAC6+/y and HDAC6−/y mice treated as in (A). (C), Total number of tumors, (D) liver to body ratio, and (E) body weight in HDAC6+/y and HDAC6−/y mouse. C‐E, n = 4‐25 per group (the circle dots in graphs represent mouse numbers). (F), H&E staining of HDAC6+/y and HDAC6−/y livers (T, tumor; black dotted line, separate tumor and normal tissues). (G), Sirius Red staining of HDAC6+/y and HDAC6−/y livers. (H), Quantification of the Sirius Red–positive area from (G) n = 21‐25 images per group. (I), Western blot for HDAC6, p21, p53, acetylated p53 (K320, K120, and K373/382), and GAPDH. (J), Hep3B cells were transfected with indicated protein expression plasmids. After 24 h of transfection, cells were treated with 30 µM etoposide for 24 h. Cell viability was measured by MTT assay (n = 4 per group). Ectopic expression of p53 was confirmed by Western blotting of anti‐MYC and anti‐GAPDH antibodies in the right panel
FIGURE 7
FIGURE 7
Histone deacetylase 6 (HDAC6) deficiency downregulates genes in cell cycle and cell division pathways. A, Heat map showing the clustering of mRNA expression profiles of bulk RNA‐seq data from multiple diethylnitrosamine (DEN)–treated 12‐week‐old mice based on normalized mRNA expression level (fold change > 1.5, p < 0.05). B, Gene Ontology (GO) analysis performed with differentially expressed 341 genes in (A) using DAVID. Red arrows indicate GO pathway term used in (C). C, Selected GO pathway term gene network (red, upregulated genes; blue, downregulated genes). D‐E, Gene‐to‐gene networks between p53 and groups of identified genes from the Cell Division and Cell Cycle GO terms in (C). Node color represents the degree of fold change (Log2 FC), and node size indicates P value (–Log10 P value). F, Proliferating cell nuclear antigen (PCNA) staining and (G) TUNEL staining of multiple DEN–treated mice at 24 weeks old. T, tumor; black dotted line, separate tumor and normal tissues; red dotted line, region of the field magnified
FIGURE 8
FIGURE 8
Histone deacetylase 6 (HDAC6) deficiency reduces innate immune response in the multiple diethylnitrosamine (DEN) treatment hepatocellular carcinoma (HCC) model. A‐E, Total RNA isolated from the livers of each treatment group was subjected to qPCR analysis for mRNA expression of indicated genes. Data were calculated as fold change in 12‐week DEN‐treated HDAC6+/y livers using the ΔΔCT method (n = 3‐9 per group). F, Immunofluorescence analysis of liver tissue sections from 24‐week‐old mice with multiple DEN treatments using anti‐F4/80 antibody for macrophages (green) and DAPI (blue) (NT, nontumor; T, tumor; white dotted line, separate tumor and normal tissues). G, Quantification of F4/80‐positive cells from (F). (n = 3 per group)

Similar articles

Cited by

References

    1. Rui L. Energy metabolism in the liver. Compr Physiol. 2014;4:177‐197. - PMC - PubMed
    1. Degasperi E, Colombo M. Distinctive features of hepatocellular carcinoma in non‐alcoholic fatty liver disease. Lancet Gastroenterol Hepatol. 2016;1:156‐164. - PubMed
    1. Forner A, Llovet JM, Bruix J. Hepatocellular carcinoma. Lancet. 2012;379:1245‐1255. - PubMed
    1. Mu X, Espanol‐Suner R, Mederacke I, et al. Hepatocellular carcinoma originates from hepatocytes and not from the progenitor/biliary compartment. J Clin Invest. 2015;125:3891‐3903. - PMC - PubMed
    1. Henderson JM, Polak N, Chen J, et al. Multiple liver insults synergize to accelerate experimental hepatocellular carcinoma. Sci Rep. 2018;8:10283. - PMC - PubMed

MeSH terms

Substances