

Characterization and Pharmacological Validation of a Preclinical Model of NASH in Göttingen Minipigs
- PMID: 35535064
- PMCID: PMC9077241
- DOI: 10.1016/j.jceh.2021.09.001
Characterization and Pharmacological Validation of a Preclinical Model of NASH in Göttingen Minipigs
Abstract
Background: Nonalcoholic fatty liver disease (NAFLD) is the leading cause of chronic liver disease, which is associated with features of metabolic syndrome. NAFLD may progress in a subset of patients into nonalcoholic steatohepatitis (NASH) with liver injury resulting ultimately in cirrhosis and potentially hepatocellular carcinoma. Today, there is no approved treatment for NASH due to, at least in part, the lack of preclinical models recapitulating features of human disease. Here, we report the development of a dietary model of NASH in the Göttingen minipig.
Methods: First, we performed a longitudinal characterization of diet-induced NASH and fibrosis using biochemical, histological, and transcriptional analyses. We then evaluated the pharmacological response to Obeticholic acid (OCA) treatment for 8 weeks at 2.5mg/kg/d, a dose matching its active clinical exposure.
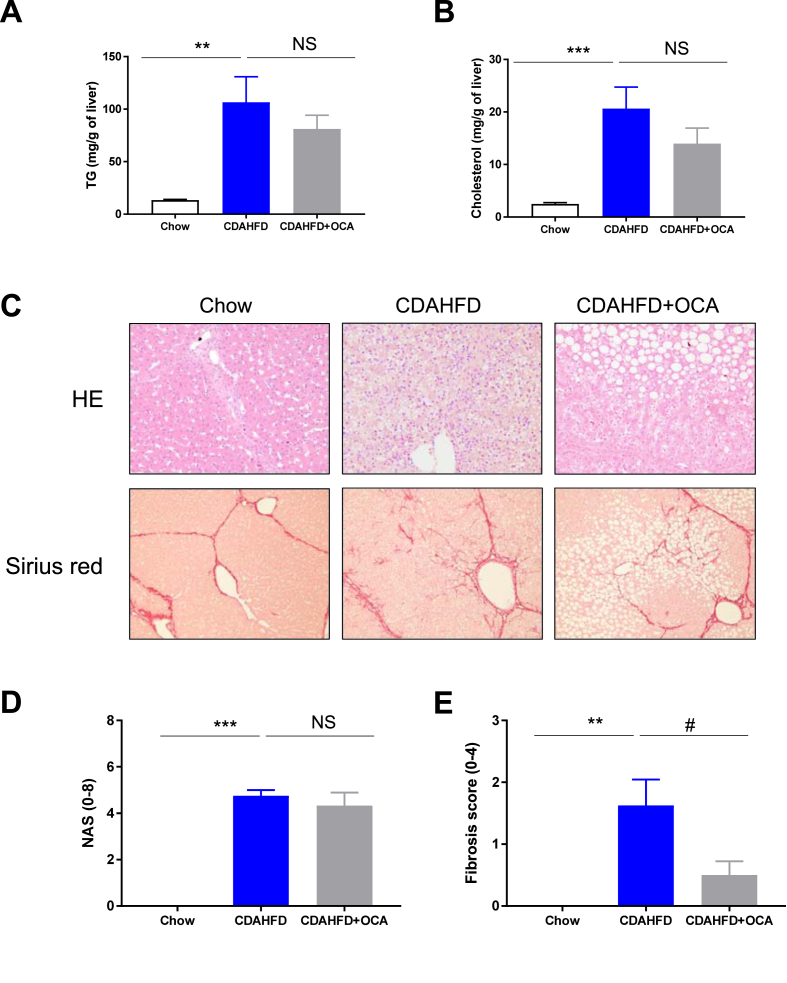
Results: Serial histological examinations revealed a rapid installation of NASH driven by massive steatosis and inflammation, including evidence of ballooning. Furthermore, we found the progressive development of both perisinusoidal and portal fibrosis reaching fibrotic septa after 6 months of diet. Histological changes were mechanistically supported by well-defined gene signatures identified by RNA Seq analysis. While treatment with OCA was well tolerated throughout the study, it did not improve liver dysfunction nor NASH progression. By contrast, OCA treatment resulted in a significant reduction in diet-induced fibrosis in this model.
Conclusions: These results, taken together, indicate that the diet-induced NASH in the Göttingen minipig recapitulates most of the features of human NASH and may be a model with improved translational value to prioritize drug candidates toward clinical development.
Keywords: CDAHFD, choline-deficient amino acid-defined high fat diet; FDR, false discovery rate; FFC, fatfructose cholesterol diet; NAFLD, nonalcoholic fatty liver disease; NAS, NAFLD activity score; NASH; NASH, nonalcoholic steatohepatitis; PNPLA3, patatin-like phospholipase domain-containing 3; minipig; translational value.
© 2021 The Authors.
Figures


References
-
- Brunt E.M., Wong V.W.S., Nobili V., et al. Nonalcoholic fatty liver disease. Nat Rev Dis Prim. 2015;1 https://pubmed.ncbi.nlm.nih.gov/27188459/ [Internet]. Nature Publishing Group [cited 2021 Jun 2] Available from: - PubMed
-
- Diehl A.M., Day C. Cause, pathogenesis, and treatment of nonalcoholic steatohepatitis. N Engl J Med. 2017;377:2063–2072. https://pubmed.ncbi.nlm.nih.gov/29166236/ [Internet]. New England Journal of Medicine (NEJM/MMS) [cited 2021 Jun 2] Available from: - PubMed
-
- Younossi Z.M., Golabi P., de Avila L., et al. The global epidemiology of NAFLD and NASH in patients with type 2 diabetes: a systematic review and meta-analysis. J Hepatol. 2019;71:793–801. https://pubmed.ncbi.nlm.nih.gov/31279902/ [Internet]. Elsevier B.V.[cited 2021 Jun 2] Available from: - PubMed
-
- Younossi Z.M., Koenig A.B., Abdelatif D., Fazel Y., Henry L., Wymer M. Global epidemiology of nonalcoholic fatty liver disease—meta-analytic assessment of prevalence, incidence, and outcomes. Hepatology. 2016;64:73–84. John Wiley and Sons Inc. - PubMed
-
- Loomba R., Friedman S.L., Shulman G.I. Mechanisms and disease consequences of nonalcoholic fatty liver disease. Cell. 2021;184:2537–2564. http://www.ncbi.nlm.nih.gov/pubmed/33989548 [Internet]. Cell [cited 2021 May 23] Available from: - PMC - PubMed
LinkOut - more resources
Full Text Sources
