Identification and Validation of a Gene Signature for Lower-Grade Gliomas Based on Pyroptosis-Related Genes to Predict Survival and Response to Immune Checkpoint Inhibitors
- PMID: 35535221
- PMCID: PMC9078805
- DOI: 10.1155/2022/8704127
Identification and Validation of a Gene Signature for Lower-Grade Gliomas Based on Pyroptosis-Related Genes to Predict Survival and Response to Immune Checkpoint Inhibitors
Abstract
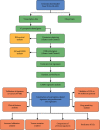
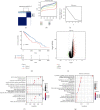
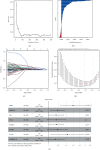
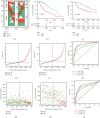
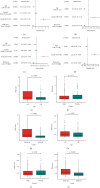
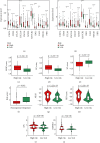
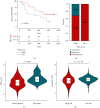
Pyroptosis plays a critical role in the immune response to immune checkpoint inhibitors (ICIs) by mediating the tumor immune microenvironment. However, the impact of pyroptosis-related biomarkers on the prognosis and efficacy of ICIs in patients with lower-grade gliomas (LGGs) is unclear. An unsupervised clustering analysis identified pyroptosis-related subtypes (PRSs) based on the expression profile of 47 pyroptosis-related genes in The Cancer Genome Atlas-LGG cohort. A PRS gene signature was established using univariate Cox regression, random survival forest, least absolute shrinkage and selection operator, and stepwise multivariable Cox regression analyses. The predictive power of this signature was validated in the Chinese Glioma Genome Atlas database. We also investigated the differences between high- and low-risk groups in terms of the tumor immune microenvironment, tumor mutation, and response to target therapy and ICIs. The PRS gene signature comprised eight PRS genes, which independently predicted the prognosis of LGG patients. High-risk patients had a worse overall survival than did the low-risk patients. The high-risk group also displayed a higher proportion of M1 macrophages and CD8+ T cells and higher immune scores, tumor mutational burden, immunophenoscore, IMmuno-PREdictive Score, MHC I association immune score, and T cell-inflamed gene expression profile scores, but lower suppressor cells scores, and were more suitable candidates for ICI treatment. Higher risk scores were more frequent in patients who responded to ICIs using data from the ImmuCellAI website. The presently established PRS gene signature can be validated in melanoma patients treated with real ICI treatment. This signature is valuable in predicting prognosis and ICI treatment of LGG patients, pending further prospective verification.
Copyright © 2022 Guichuan Lai et al.
Conflict of interest statement
The authors declare no conflicts of interest regarding the publication of this paper.
Figures


Similar articles
-
Optimization of cancer immunotherapy through pyroptosis: A pyroptosis-related signature predicts survival benefit and potential synergy for immunotherapy in glioma.Front Immunol. 2022 Aug 3;13:961933. doi: 10.3389/fimmu.2022.961933. eCollection 2022. Front Immunol. 2022. PMID: 35990696 Free PMC article.
-
Systematic transcriptome profiling of pyroptosis related signature for predicting prognosis and immune landscape in lower grade glioma.BMC Cancer. 2022 Aug 13;22(1):885. doi: 10.1186/s12885-022-09982-7. BMC Cancer. 2022. PMID: 35964070 Free PMC article.
-
A novel pyroptosis-related gene signature predicts the prognosis of glioma through immune infiltration.BMC Cancer. 2021 Dec 7;21(1):1311. doi: 10.1186/s12885-021-09046-2. BMC Cancer. 2021. PMID: 34876094 Free PMC article.
-
Identification of a novel cuproptosis-related gene signature and integrative analyses in patients with lower-grade gliomas.Front Immunol. 2022 Aug 15;13:933973. doi: 10.3389/fimmu.2022.933973. eCollection 2022. Front Immunol. 2022. PMID: 36045691 Free PMC article. Review.
-
Molecular subtypes based on PANoptosis-related genes and tumor microenvironment infiltration characteristics in lower-grade glioma.Funct Integr Genomics. 2023 Mar 17;23(2):84. doi: 10.1007/s10142-023-01003-5. Funct Integr Genomics. 2023. Retraction in: Funct Integr Genomics. 2024 May 11;24(3):88. doi: 10.1007/s10142-024-01374-3. PMID: 36930242 Retracted. Review.
Cited by
-
Construction of a prognostic model for lung adenocarcinoma based on heat shock protein-related genes and immune analysis.Cell Stress Chaperones. 2023 Nov;28(6):821-834. doi: 10.1007/s12192-023-01374-5. Epub 2023 Sep 11. Cell Stress Chaperones. 2023. PMID: 37691069 Free PMC article.
-
Crosstalk of disulfidptosis-related subtypes, establishment of a prognostic signature and immune infiltration characteristics in bladder cancer based on a machine learning survival framework.Front Endocrinol (Lausanne). 2023 Apr 19;14:1180404. doi: 10.3389/fendo.2023.1180404. eCollection 2023. Front Endocrinol (Lausanne). 2023. PMID: 37152941 Free PMC article.
-
A new TGF-β risk score predicts clinical and immune landscape in colorectal cancer patients.Ann Gastroenterol Surg. 2024 May 21;8(5):927-941. doi: 10.1002/ags3.12802. eCollection 2024 Sep. Ann Gastroenterol Surg. 2024. PMID: 39229560 Free PMC article.
-
Identification and validation of a risk model and molecular subtypes based on tryptophan metabolism-related genes to predict the clinical prognosis and tumor immune microenvironment in lower-grade glioma.Front Cell Neurosci. 2023 Feb 28;17:1146686. doi: 10.3389/fncel.2023.1146686. eCollection 2023. Front Cell Neurosci. 2023. PMID: 36925967 Free PMC article.
-
Development of a Hallmark Pathway-Related Gene Signature Associated with Immune Response for Lower Grade Gliomas.Int J Mol Sci. 2022 Oct 9;23(19):11971. doi: 10.3390/ijms231911971. Int J Mol Sci. 2022. PMID: 36233273 Free PMC article.
References
-
- Schiff D., Van den Bent M., Vogelbaum M. A., et al. Recent developments and future directions in adult lower-grade gliomas: society for Neuro-Oncology (SNO) and European Association of Neuro-Oncology (EANO) consensus. Neuro-Oncology . 2019;21(7):837–853. doi: 10.1093/neuonc/noz033. - DOI - PMC - PubMed
Publication types
MeSH terms
Substances
LinkOut - more resources
Full Text Sources
Research Materials

