. 2022 Apr 30:2022:1592905.
doi: 10.1155/2022/1592905. eCollection 2022.

Mitochondrial-Related Transcriptome Feature Correlates with Prognosis, Vascular Invasion, Tumor Microenvironment, and Treatment Response in Hepatocellular Carcinoma

Affiliations

Mitochondrial-Related Transcriptome Feature Correlates with Prognosis, Vascular Invasion, Tumor Microenvironment, and Treatment Response in Hepatocellular Carcinoma

Yizhou Wang et al. Oxid Med Cell Longev. .

Abstract

Background: Hepatocellular carcinoma (HCC) is the most common subtype of primary liver cancer, which was highly correlated with metabolic dysfunction. Nevertheless, the association between nuclear mitochondrial-related transcriptome and HCC remained unclear.

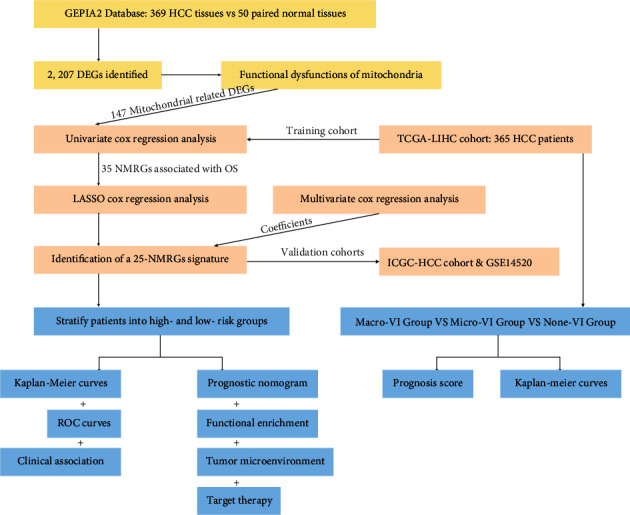
Materials and methods: A total of 147 nuclear mitochondrial-related genes (NMRGs) were downloaded from the MITOMAP: A Human Mitochondrial Genome Database. The training dataset was downloaded from The Cancer Genome Atlas (TCGA), while validation datasets were retrieved from the International Cancer Genome Consortium (ICGC) and Gene Expression Omnibus (GEO). The univariate and multivariate, and least absolute shrinkage and selection operator (LASSO) Cox regression analyses were applied to construct a NMRG signature, and the value of area under receiver operating characteristic curve (AUC) was utilized to assess the signature and nomogram. Then, data from the Genomics of Drug Sensitivity in Cancer (GDSC) were used for the evaluation of chemotherapy response in HCC.

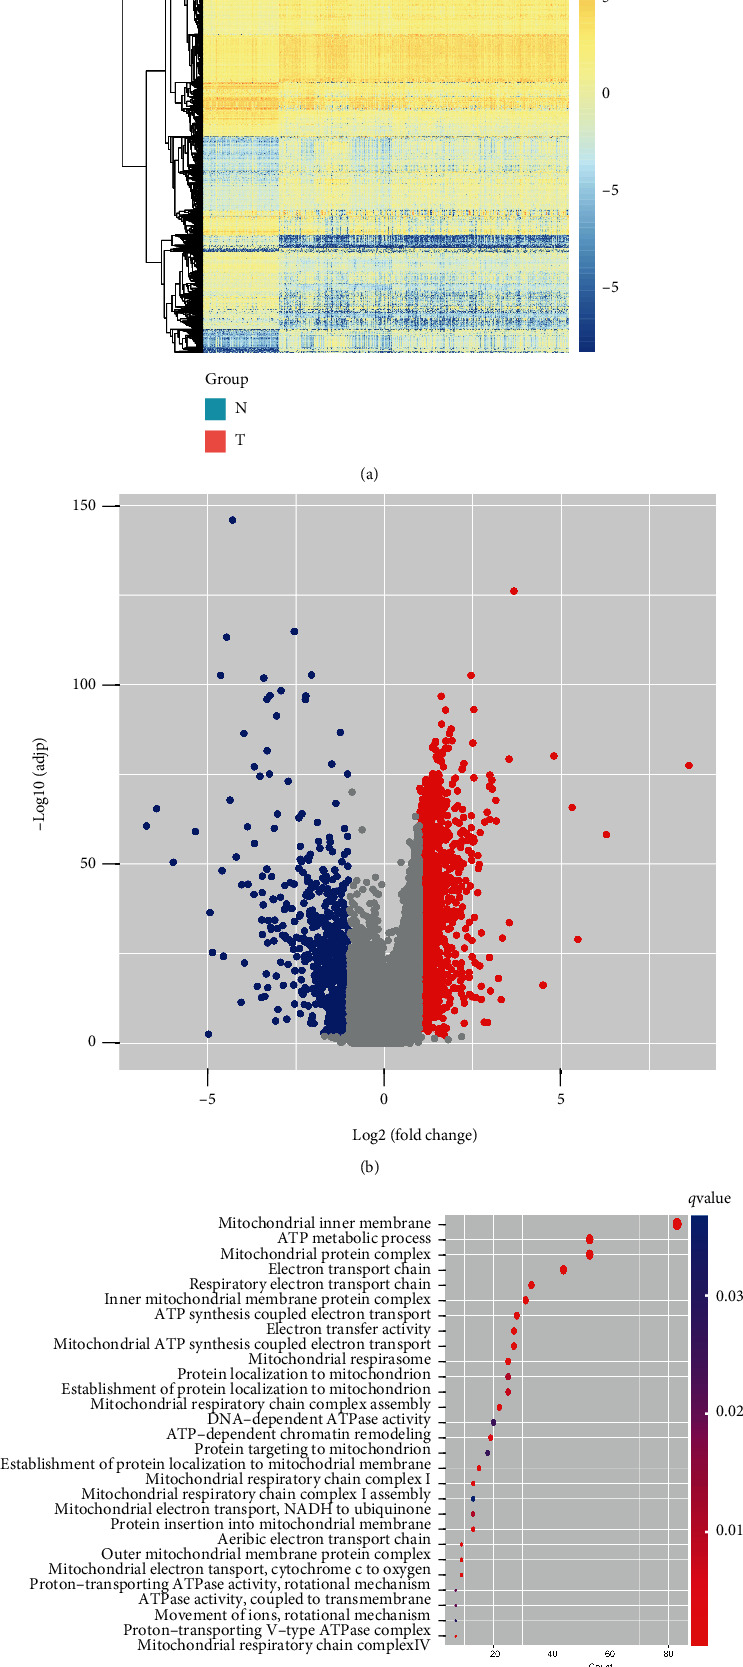
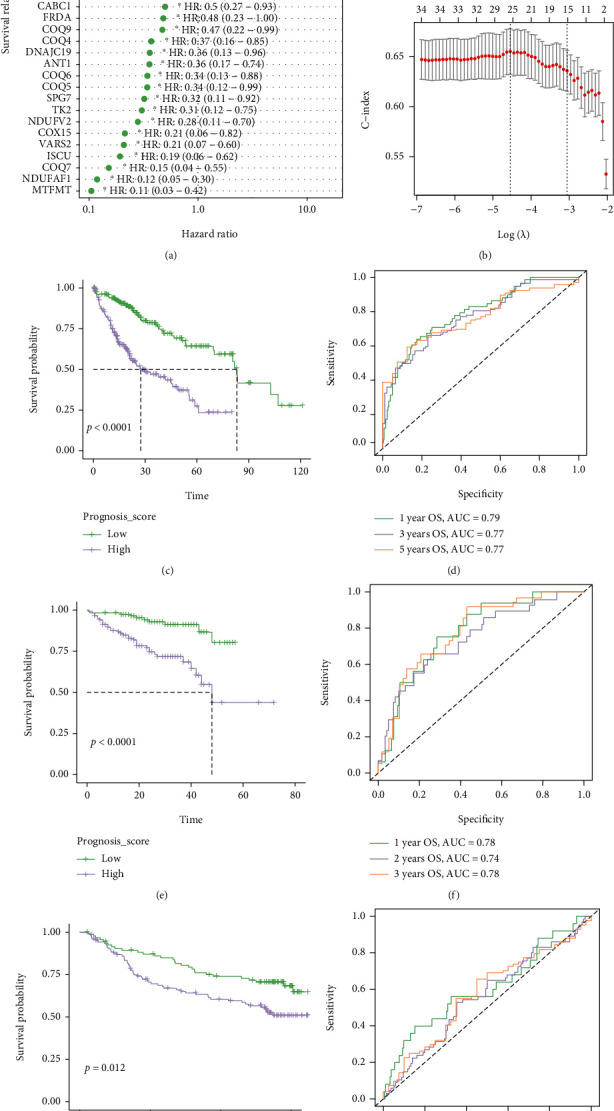
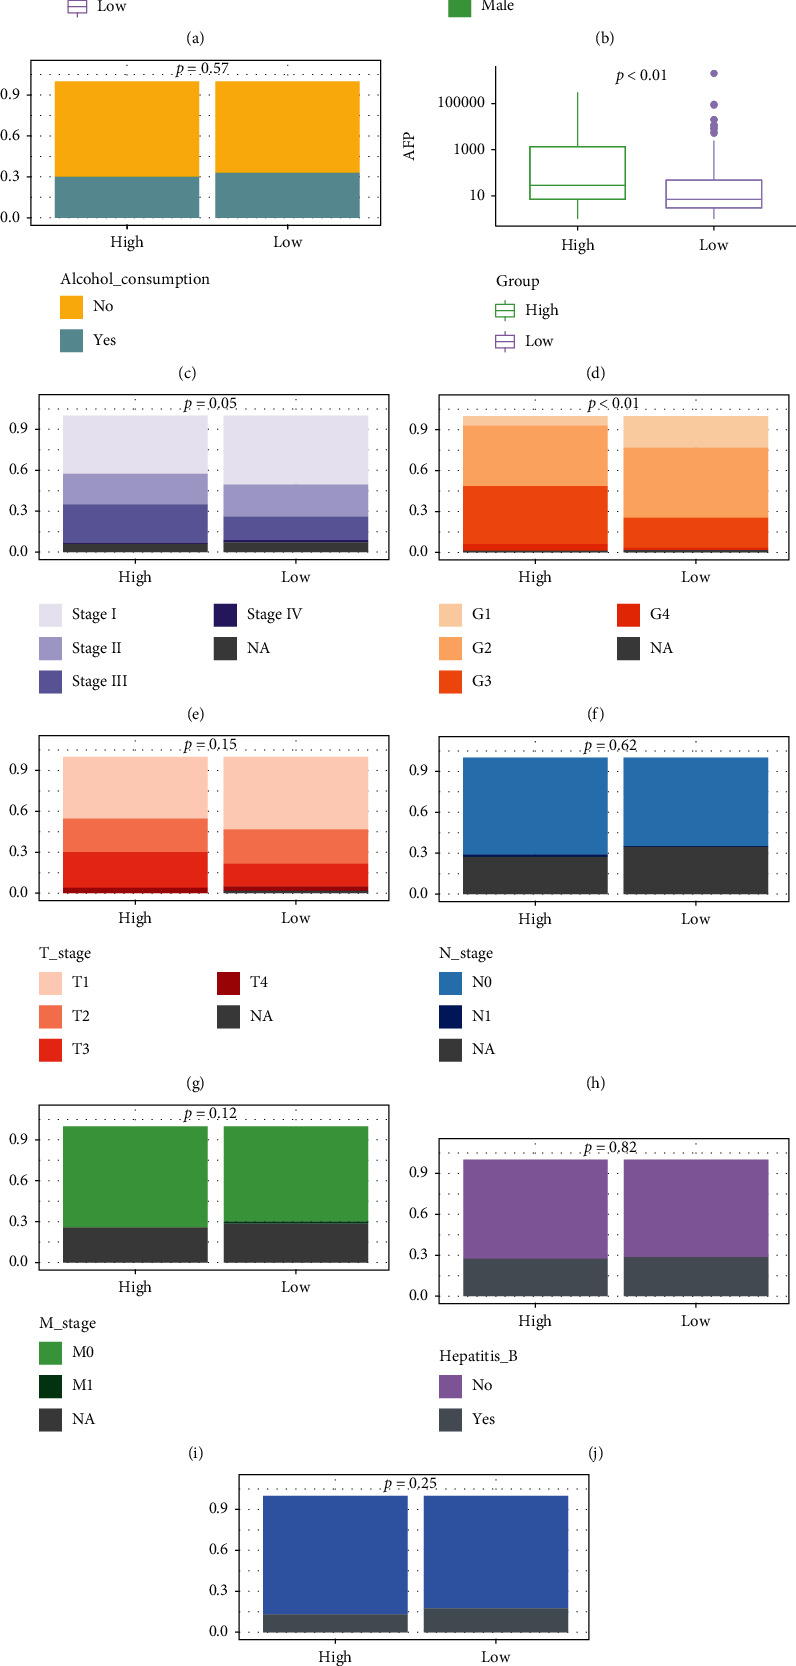
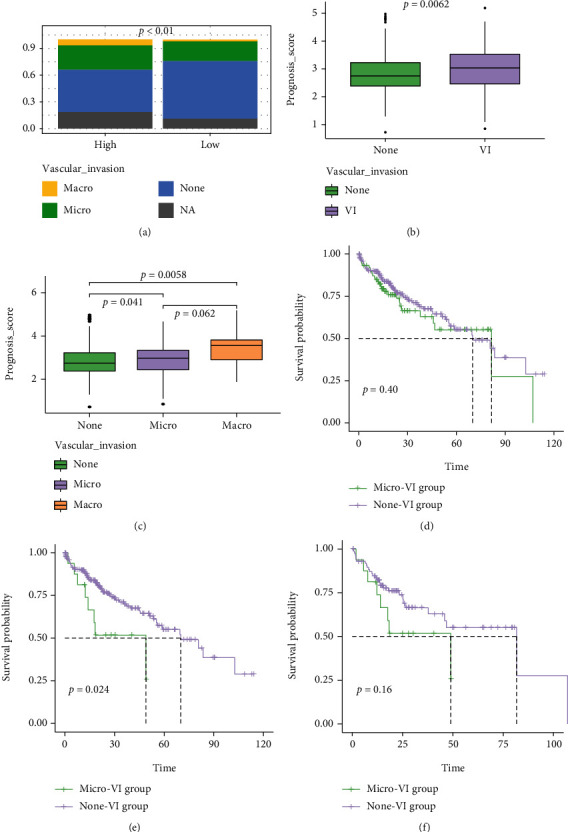
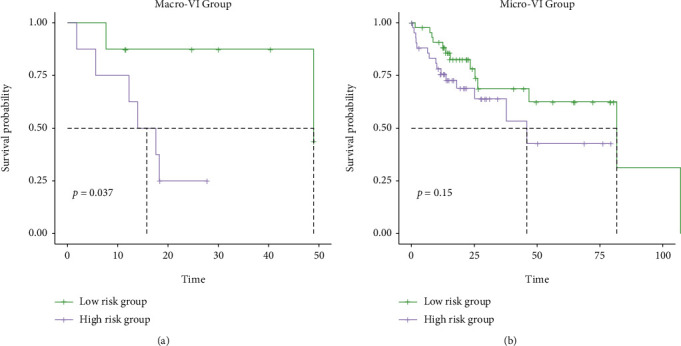
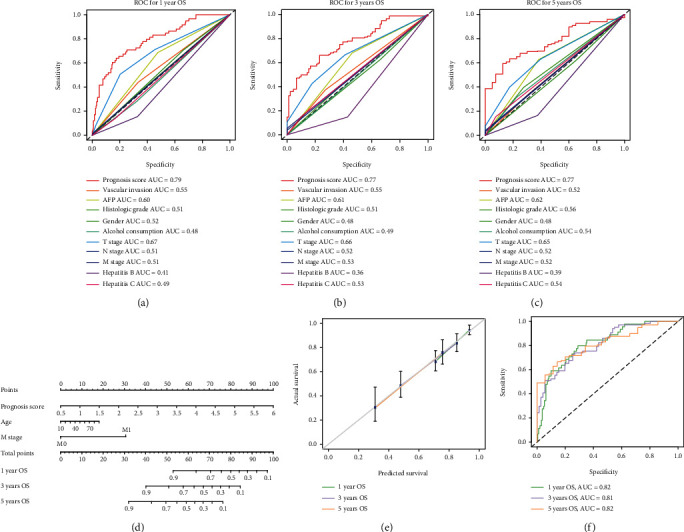
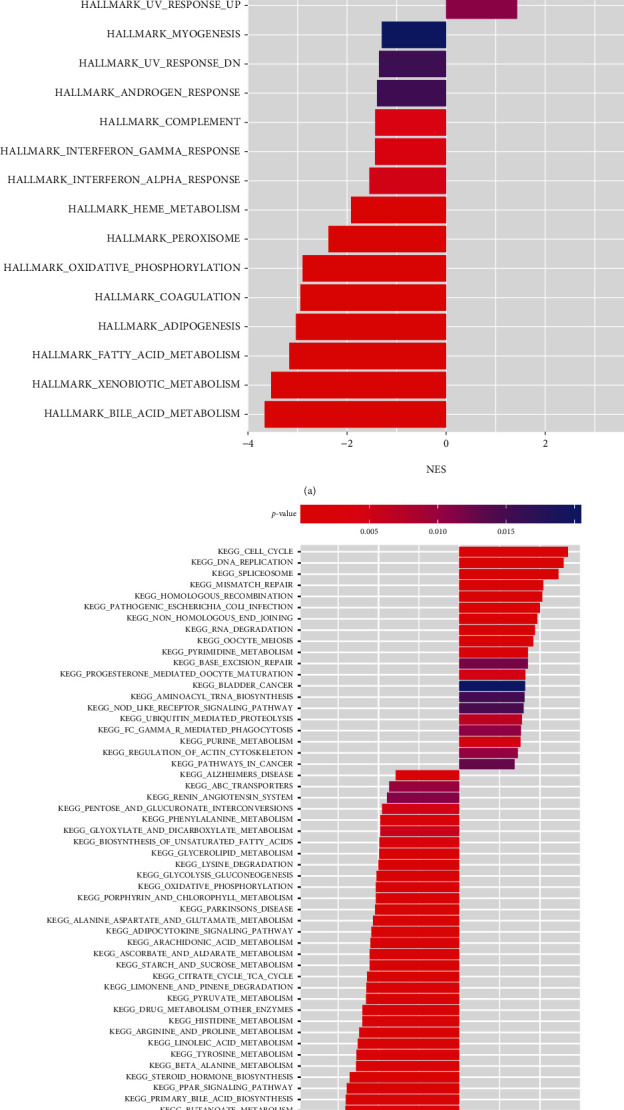
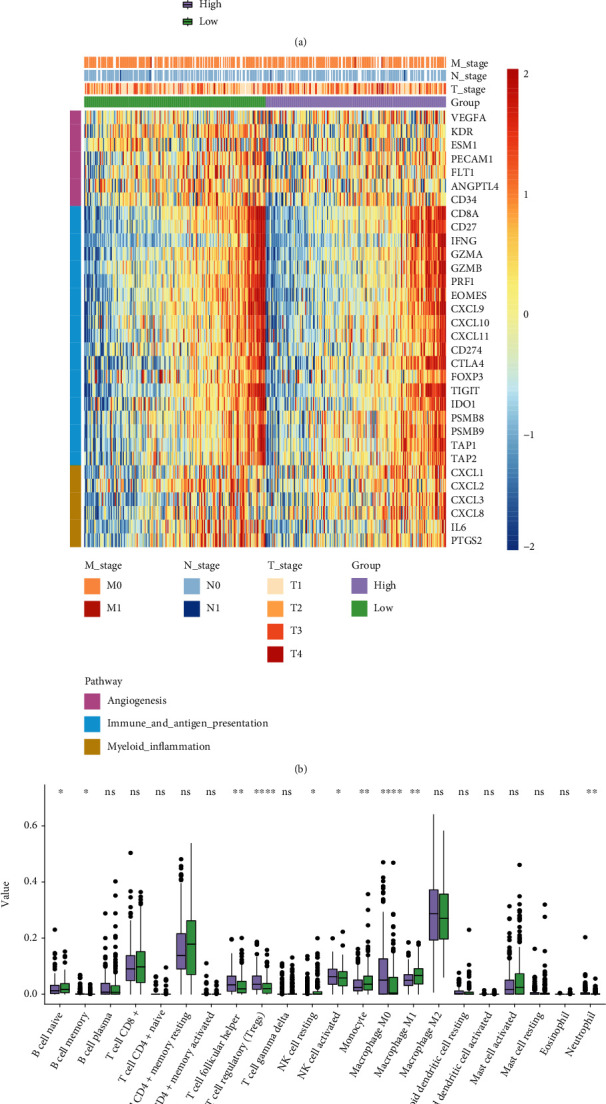
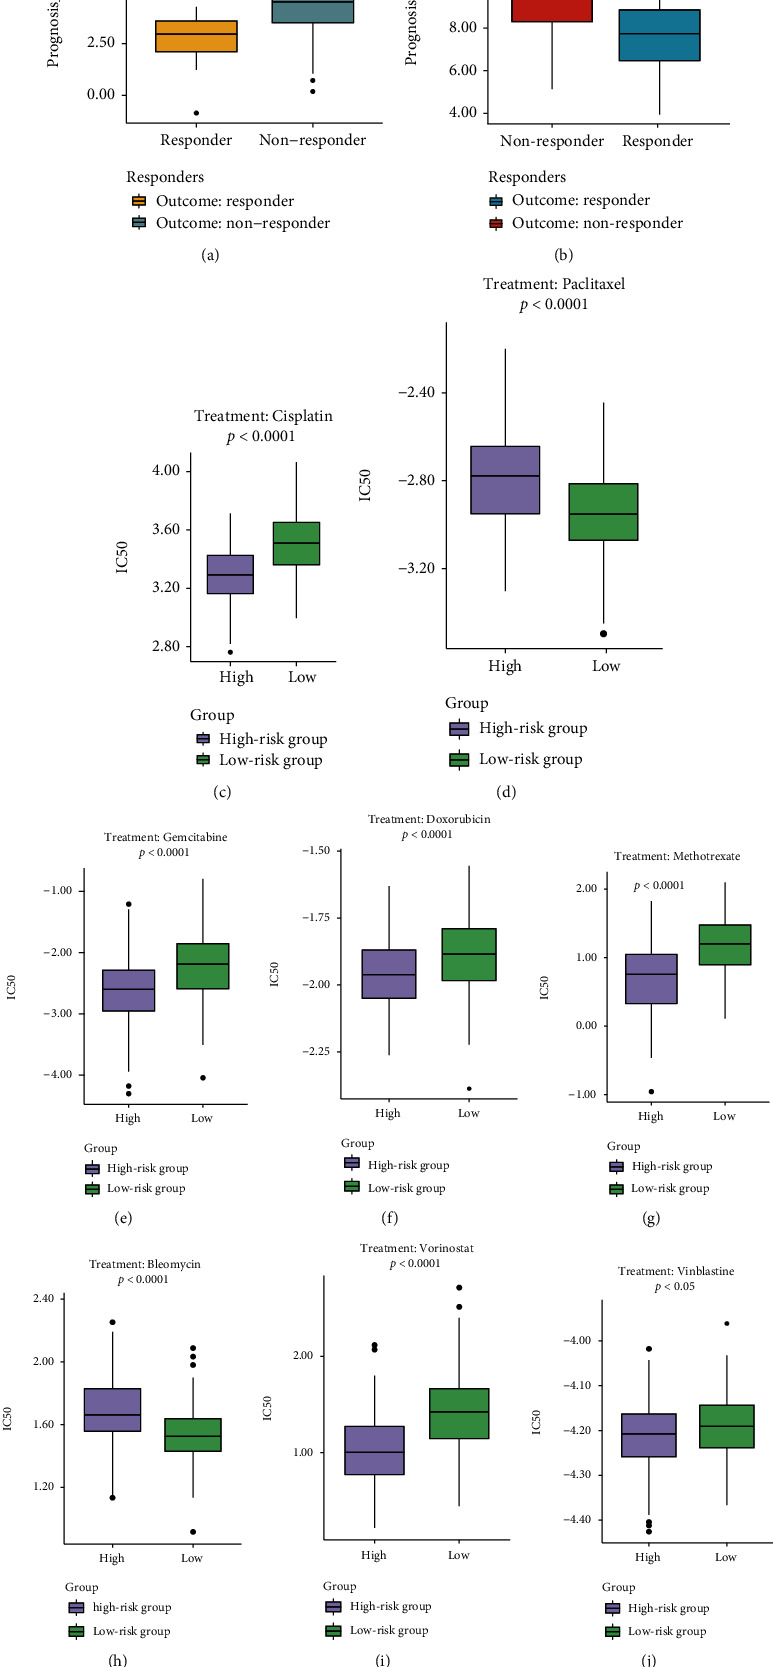
Results: Functional enrichment of differentially expressed genes (DEGs) between HCC and paired normal tissue samples demonstrated that mitochondrial dysfunction was significantly associated with HCC development. Survival analysis showed a total of 35 NMRGs were significantly correlated with overall survival (OS) of HCC, and the LASSO Cox regression analysis further identified a 25-NMRG signature and corresponding prognosis score based on their transcriptional profiling. HCC patients were divided into high- and low-risk groups according to the median prognosis score, and high-risk patients had significantly worse OS (median OS: 27.50 vs. 83.18 months, P < 0.0001). The AUC values for OS at 1, 3, and 5 years were 0.79, 0.77, and 0.77, respectively. The prognostic capacity of NMRG signature was verified in the GSE14520 dataset and ICGC-HCC cohort. Besides, the NMRG signature outperformed each NMRG and clinical features in prognosis prediction and could also differentiate whether patients presented with vascular invasions (VIs) or not. Subsequently, a prognostic nomogram (C-index: 0.753, 95% CI: 0.703~0.804) by the integration of age, tumor metastasis, and NMRG prognosis score was constructed with the AUC values for OS at 1, 3, and 5 years were 0.82, 0.81, and 0.82, respectively. Notably, significant enrichment of regulatory and follicular helper T cells in high-risk group indicated the potential treatment of immune checkpoint inhibitors for these patients. Interestingly, the NMRG signature could also identify the potential responders of sorafenib or transcatheter arterial chemoembolization (TACE) treatment. Additionally, HCC patients in high-risk group appeared to be more sensitive to cisplatin, vorinostat, and methotrexate, reversely, patients in low-risk group had significantly higher sensitivity to paclitaxel and bleomycin instead.

Conclusions: In summary, the development of NMRG signature provided a more comprehensive understanding of mitochondrial dysfunction in HCC, helped predict prognosis and tumor microenvironment, and provided potential targeted therapies for HCC patients with different NMRG prognosis scores.


Conflict of interest statement

The authors declare that the research was conducted in the absence of any commercial or financial relationships that could be construed as a potential conflict of interest.

Figures

Figure 1
Figure 1
The flow-process diagram for the construction of the NMRG signature and exploration of clinicopathological association and potential targeted therapy.
Figure 2
Figure 2
Mitochondrial dysfunction potentially promoted the hepatocarcinogenesis. (a) Transcriptional profiling of HCC and adjacent paired normal tissues. (b) Differentially expressed genes (DEGs) between HCC and adjacent paired normal tissues. Red dots represented significant upregulation and blue dots represented significant downregulation of DEGs in HCC tissues. (c) Identification of biological functions via the GO pathway enrichment analysis.
Figure 3
Figure 3
Construction and validation of the nuclear mitochondrial-related gene (NMRG) signature. (a) Univariate Cox regression analysis for selection of NMRGs correlated with overall survival of HCC patients. (b) LASSO Cox regression analysis determined a total of 25 NMRGs as the optimal combination for the NMRG signature construction. The Kaplan-Meier curves for HCC patients in high- and low-risk groups, from the TCGA cohort (c), from the ICGC-HCC cohort (e), and from the GSE14520 dataset (g). The ROC curves for OS at 1, 3, and 5 years in TCGA cohort (d), in ICGC-HCC cohort (f), and in GSE14520 dataset (h).
Figure 4
Figure 4
Association analysis between the NMRG signature and clinical features. (a) The boxplots showed the distribution of age at diagnosis between the high- and low-risk groups. (b) The percentage-staked bar plots for gender distribution between the high- and low-risk groups. (c) The percentage-staked bar plots for the distribution of alcohol consumption between the high- and low-risk groups. (d) The boxplots showed the distribution of AFP concentration between the high- and low-risk groups. The percentage-staked bar plots for the distribution of neoplasm cancer stages (e), histological grading (f), T stages (g), N stages (h), M stages (i), Hepatitis_B status (j), and Hepatitis_C status (k) between the high- and low-risk groups.
Figure 5
Figure 5
The application of the NMRGs signature in the groups with vascular invasions (VIs) or not. (a) The percentage-staked bar plots for the distribution of VIs between high- and low- risk groups. (b) Comparison of prognosis score between groups with VIs or not. (c) Comparison of prognosis score between groups with macro-VIs, micro-VIs, and without VIs. The Kaplan-Meier curves for HCC patients between micro-VI and none-VI groups (d). (e) Green and purple lines represent macro-VI group and none-VI group, respectively. (f) Green and purple lines represent macro-VI group and micro-VI group, respectively.
Figure 6
Figure 6
Comparison of overall survival between high- and low-risk HCC patients in the groups with macro-VIs or micro-VIs. The Kaplan-Meier curves between high- and low-risk HCC patients in the macro-VI group (a) and micro-VI group (b).
Figure 7
Figure 7
Construction of a novel nomogram for HCC patients based on the NMRG signature. The ROC curves of a variety of clinical features for overall survival (OS) at 1 (a), 3 (b), and 5 years (c). (d) The NMRG-based nomogram was constructed to predict the OS of HCC patients. (e) The calibration plots for the evaluation of predicted OS at 1, 3, and 5 years. (f) The ROC curves of the nomogram for OS at 1, 3, and 5 years in the analysis of TCGA-HCC cohort.
Figure 8
Figure 8
The analysis of genomic alterations between the high- and low-risk groups. (a) The boxplots showed the mutation counts between the high- and low-risk groups. The genomic profiling of the top 20 most frequently altered genes in the high-risk group (b) and in the low-risk group (c). (d) Genomic alteration enrichment of altered genes between the high- and low-risk groups. (e) Genomic alteration enrichment of altered signaling pathways between the high- and low-risk groups. The genomic profiles of altered events in DDR (f), PI3K (g), and WNT signaling pathways (h).
Figure 9
Figure 9
Functional enrichment analysis between the high- and low-risk groups. The HALLMARK gene set enrichment analysis (a) and the KEGG pathway enrichment analysis (b). P < 0.05 was considered statistically significant.
Figure 10
Figure 10
Comparison of tumor microenvironment (TME) between the high- and low-risk groups. (a) The statistical analyses of the stromal score, immune score, and ESTIMATE score between the high- and low-risk groups. (b) Heatmap demonstrated the expression of genes related to angiogenesis (purple), immune and antigen presentation (blue), and myeloid inflammation (brown). (c) The analysis of 22 immune infiltrated cells between high- and low-risk groups. ∗∗∗∗P < 0.0001, ∗∗∗P < 0.001, ∗∗P < 0.01, P < 0.05.
Figure 11
Figure 11
The evaluation of treatment responses by the novel prognosis score based on NMRG signature. (a) The treatment response prediction of the sorafenib therapy in the GSE109211 dataset. (b) The treatment response prediction of the transcatheter arterial chemoembolization (TACE) therapy in the GSE104580 dataset. (c–j) The boxplots of the evaluated IC50 for commonly used chemodrugs between the high- and low-risk groups by the analysis of cell line data from the GDSC database. ∗∗∗∗P < 0.0001, P < 0.05.

Similar articles

Cited by

References

    1. Miller K. D., Fidler-Benaoudia M., Keegan T. H., Hipp H. S., Jemal A., Siegel R. L. Cancer statistics for adolescents and young adults, 2020. CA: a Cancer Journal for Clinicians . 2020;70(6):443–459. doi: 10.3322/caac.21637. - DOI - PubMed
    1. Longerich T. Hepatozelluläres Karzinom. Pathologe . 2020;41(5):478–487. doi: 10.1007/s00292-020-00801-z. - DOI - PubMed
    1. Kim D. W., Talati C., Kim R. Hepatocellular carcinoma (HCC): beyond sorafenib—chemotherapy. Journal of Gastrointestinal Oncology . 2017;8(2):256–265. doi: 10.21037/jgo.2016.09.07. - DOI - PMC - PubMed
    1. Luo P., Wu S., Yu Y., et al. Current status and perspective biomarkers in AFP negative HCC: towards screening for and diagnosing hepatocellular carcinoma at an earlier stage. Pathology Oncology Research . 2020;26(2):599–603. doi: 10.1007/s12253-019-00585-5. - DOI - PubMed
    1. Krishnan M., Rajan KD A., Park J., et al. Genomic analysis of vascular invasion in HCC reveals molecular drivers and predictive biomarkers. Hepatology . 2021;73(6):2342–2360. doi: 10.1002/hep.31614. - DOI - PMC - PubMed

MeSH terms

Substances