High-spatial-resolution, instantaneous passive cavitation imaging with temporal resolution in histotripsy: a simulation study
- PMID: 35535468
- PMCID: PMC9262664
- DOI: 10.14366/usg.21153
High-spatial-resolution, instantaneous passive cavitation imaging with temporal resolution in histotripsy: a simulation study
Abstract
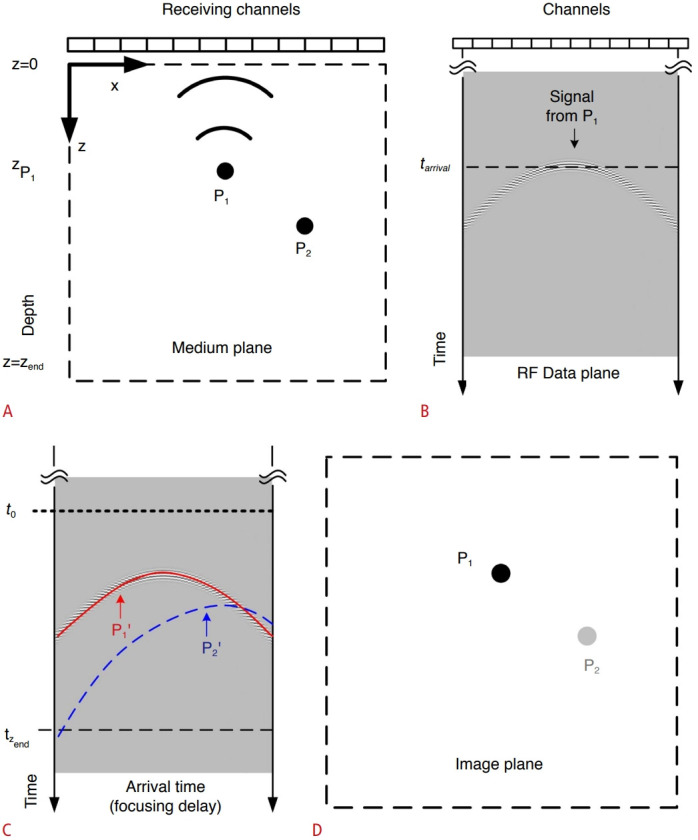
Purpose: In histotripsy, a shock wave is transmitted, and the resulting inertial bubble cavitation that disrupts tissue is used for treatment. Therefore, it is necessary to detect when cavitation occurs and track the position of cavitation occurrence using a new passive cavitation (PC) imaging method.
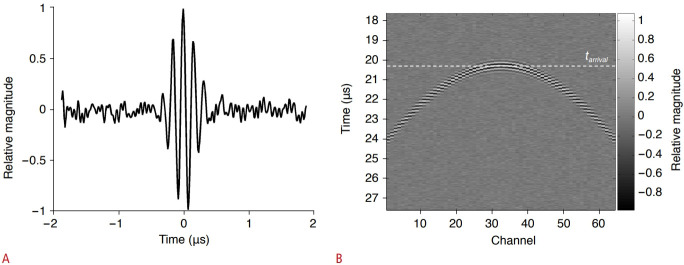
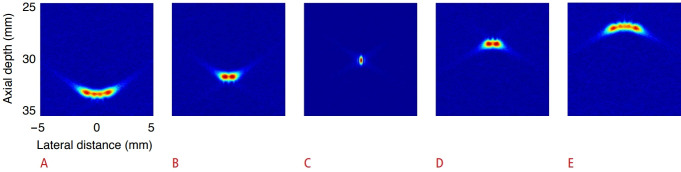
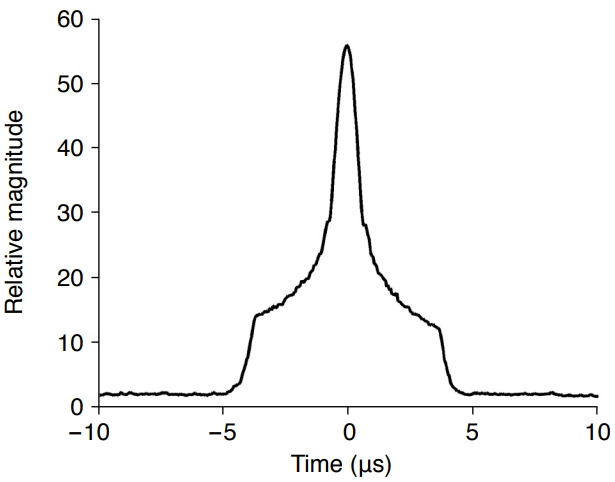
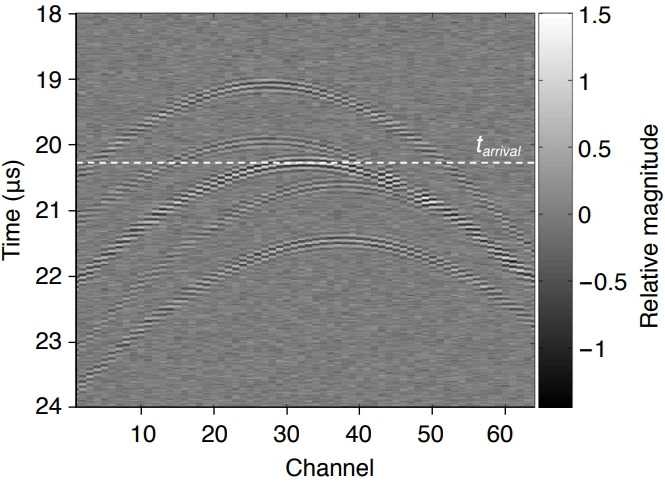
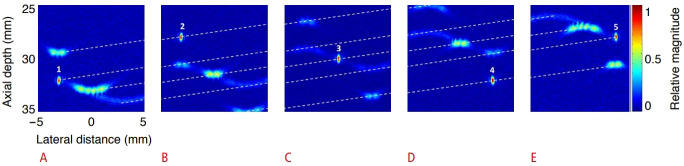
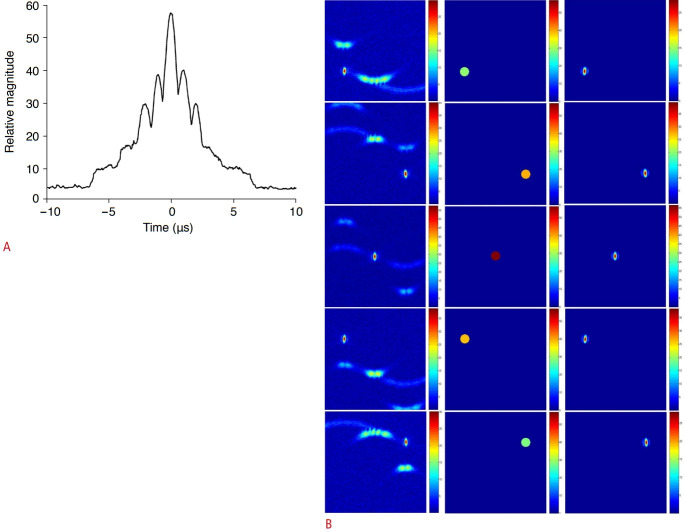
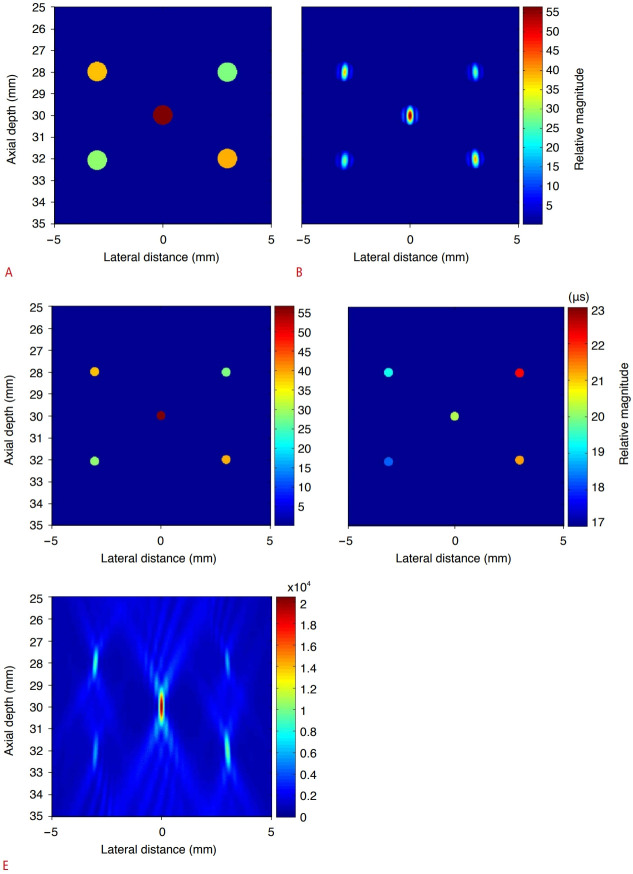
Methods: An integrated PC image, which is constructed by collecting the focused signals at all times, does not provide information on when cavitation occurs and has poor spatial resolution. To solve this problem, we constructed instantaneous PC images by applying delay and sum beamforming at instantaneous time instants. By calculating instantaneous PC images at all data acquisition times, the proposed method can detect cavitation when it occurs by using the property that when signals from the cavitation are focused, their amplitude becomes large, and it can obtain a high-resolution PC image by masking out side lobes in the vicinity of cavitation.
Results: Ultrasound image simulation confirmed that the proposed method has higher resolution than conventional integrated PC imaging and showed that it can determine the position and time of cavitation occurrence as well as the signal strength.
Conclusion: Since the proposed novel PC imaging method can detect each cavitation separately when the incidence of cavitations is low, it can be used to monitor the treatment process of shock wave therapy and histotripsy, in which cavitation is an important mechanism of treatment.
Keywords: Beamforming; Passive cavitation imaging; Strength of cavitation.
Conflict of interest statement
Mok Kun Jeong and Min Joo Choi serve as editors of
Figures

Similar articles
-
Spatial-temporal ultrasound imaging of residual cavitation bubbles around a fluid-tissue interface in histotripsy.J Acoust Soc Am. 2015 May;137(5):2563-72. doi: 10.1121/1.4919286. J Acoust Soc Am. 2015. PMID: 25994689
-
A Novel Approach for the Detection of Every Significant Collapsing Bubble in Passive Cavitation Imaging.IEEE Trans Ultrason Ferroelectr Freq Control. 2022 Apr;69(4):1288-1300. doi: 10.1109/TUFFC.2022.3151882. Epub 2022 Mar 30. IEEE Trans Ultrason Ferroelectr Freq Control. 2022. PMID: 35167448
-
Control of the dynamics of a boiling vapour bubble using pressure-modulated high intensity focused ultrasound without the shock scattering effect: A first proof-of-concept study.Ultrason Sonochem. 2021 Sep;77:105699. doi: 10.1016/j.ultsonch.2021.105699. Epub 2021 Jul 31. Ultrason Sonochem. 2021. PMID: 34371476 Free PMC article.
-
Post Hoc Analysis of Passive Cavitation Imaging for Classification of Histotripsy-Induced Liquefaction in Vitro.IEEE Trans Med Imaging. 2018 Jan;37(1):106-115. doi: 10.1109/TMI.2017.2735238. Epub 2017 Aug 2. IEEE Trans Med Imaging. 2018. PMID: 28783627 Free PMC article.
-
Passive cavitation mapping for biomedical applications using higher order delay multiply and sum beamformer with linear complexity.Ultrasonics. 2025 Sep;153:107653. doi: 10.1016/j.ultras.2025.107653. Epub 2025 Apr 7. Ultrasonics. 2025. PMID: 40203513
Cited by
-
Ultrasound guided blood brain barrier opening using a diagnostic probe in a whole brain model.Sci Rep. 2025 Mar 28;15(1):10674. doi: 10.1038/s41598-025-94660-4. Sci Rep. 2025. PMID: 40148460 Free PMC article.
References
-
- Bailey MR, Khokhlova VA, Sapozhnikov OA, Kargl SG, Crum LA. Physical mechanisms of the therapeutic effect of ultrasound (a review) Acoust Phys. 2003;49:369–388.
-
- Bailey MR, McAteer JA, Pishchalnikov YA, Hamilton MF, Colonius T. Progress in lithotripsy research. Acoust Today. 2006;2:18–29.
-
- Cleveland RO, McAteer JA. The physics of shock wave lithotripsy. In: Smith AD, Badlani GH, Bagley DH, Clayman RV, Docimo SG, Jordan GH, et al., editors. Smith’s textbook of endourology. 2nd ed. London: BC Decker; 2006. pp. 317–332.
-
- Leighton TG, Cleveland RO. Lithotripsy. Proc Inst Mech Eng H. 2010;224:317–342. - PubMed
Grants and funding
LinkOut - more resources
Full Text Sources