. 2022 May 10:11:e75237.
doi: 10.7554/eLife.75237.

Microevolution of Trypanosoma cruzi reveals hybridization and clonal mechanisms driving rapid genome diversification

Affiliations

Microevolution of Trypanosoma cruzi reveals hybridization and clonal mechanisms driving rapid genome diversification

Gabriel Machado Matos et al. Elife. .

Abstract

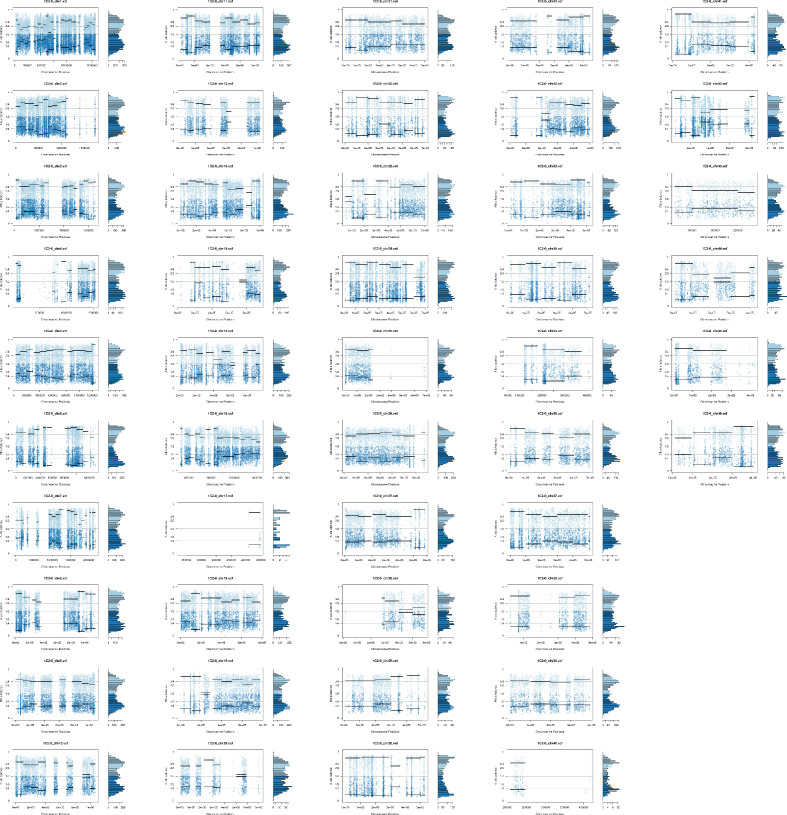
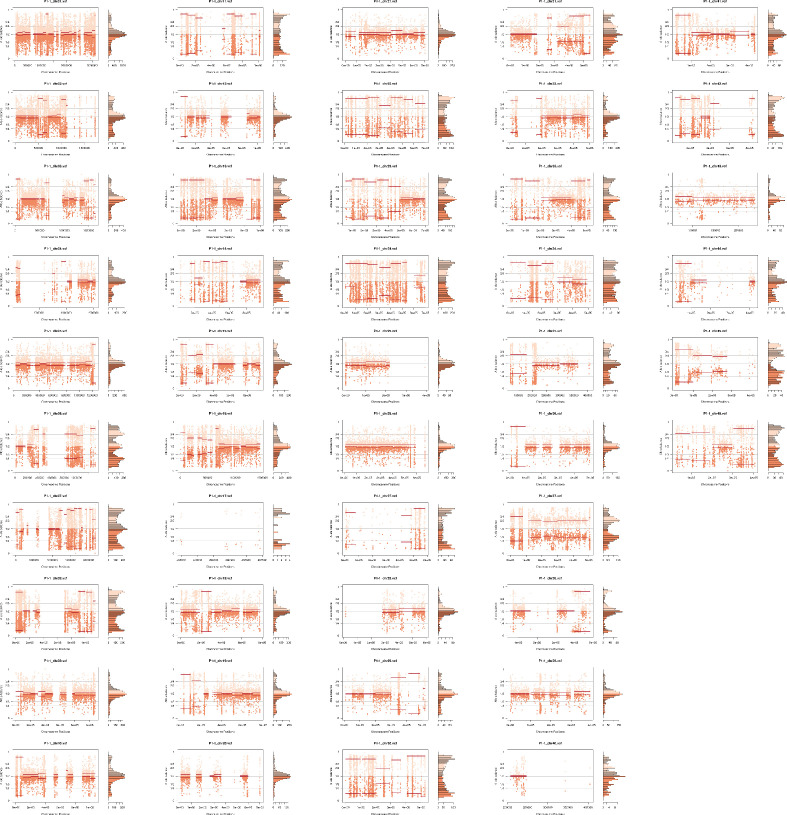
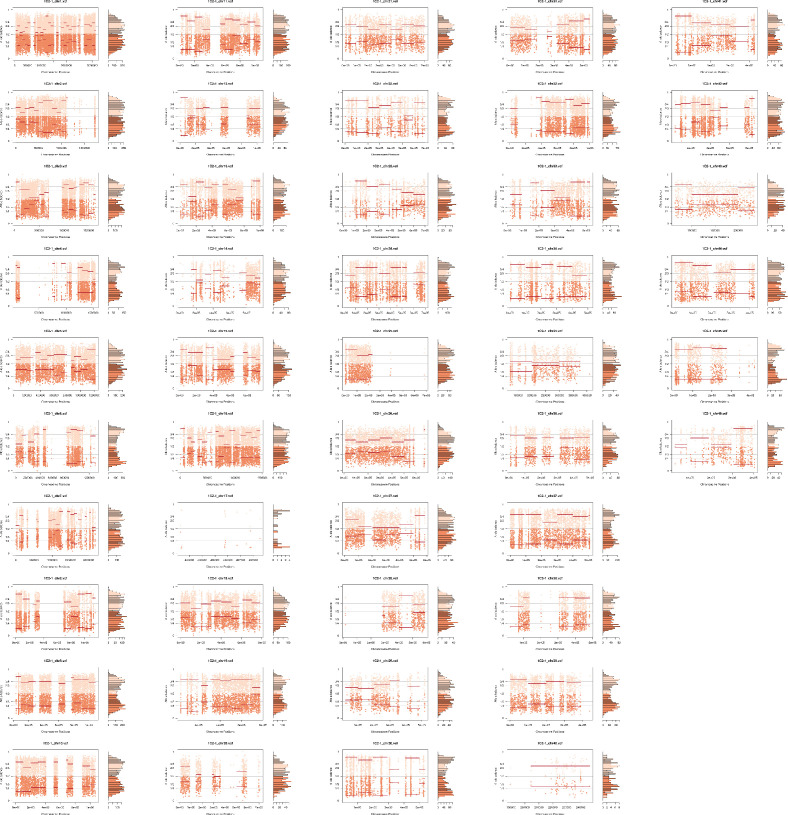
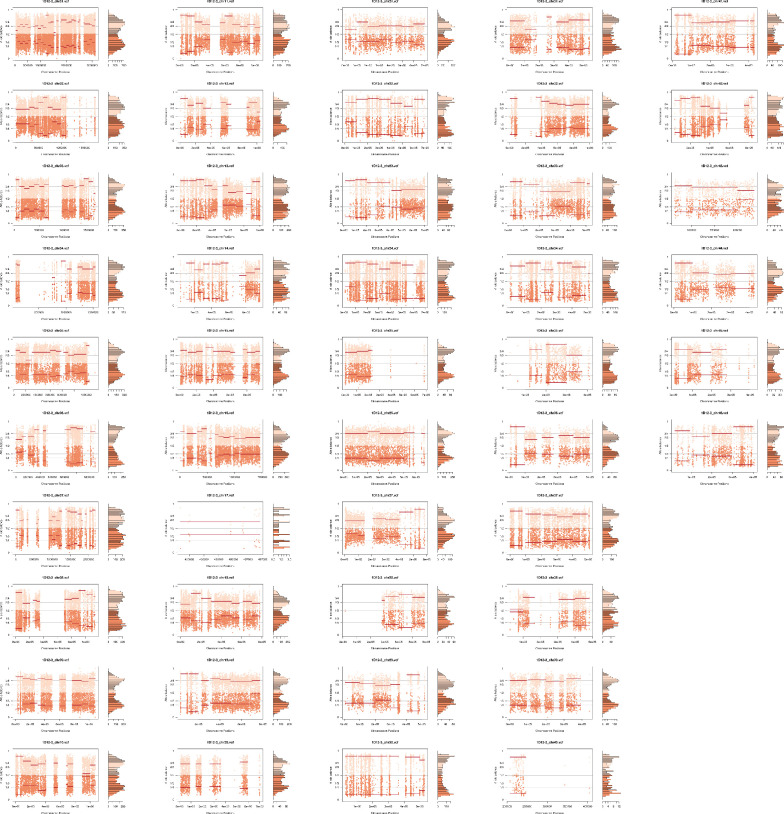
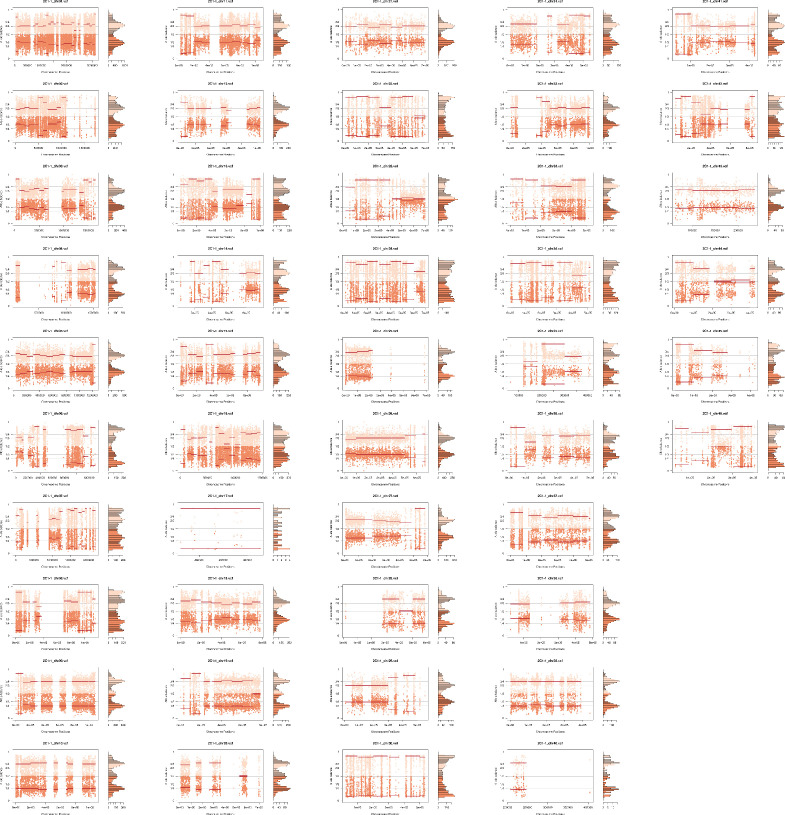
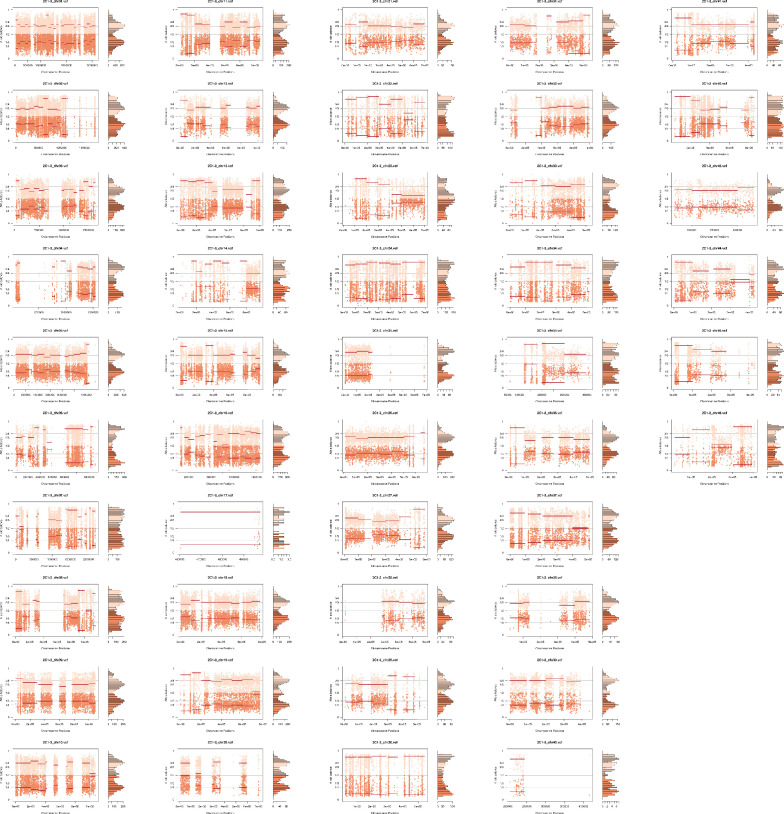
Protozoa and fungi are known to have extraordinarily diverse mechanisms of genetic exchange. However, the presence and epidemiological relevance of genetic exchange in Trypanosoma cruzi, the agent of Chagas disease, has been controversial and debated for many years. Field studies have identified both predominantly clonal and sexually recombining natural populations. Two of six natural T. cruzi lineages (TcV and TcVI) show hybrid mosaicism, using analysis of single-gene locus markers. The formation of hybrid strains in vitro has been achieved and this provides a framework to study the mechanisms and adaptive significance of genetic exchange. Using whole genome sequencing of a set of experimental hybrids strains, we have confirmed that hybrid formation initially results in tetraploid parasites. The hybrid progeny showed novel mutations that were not attributable to either (diploid) parent showing an increase in amino acid changes. In long-term culture, up to 800 generations, there was a variable but gradual erosion of progeny genomes towards triploidy, yet retention of elevated copy number was observed at several core housekeeping loci. Our findings indicate hybrid formation by fusion of diploid T. cruzi, followed by sporadic genome erosion, but with substantial potential for adaptive evolution, as has been described as a genetic feature of other organisms, such as some fungi.

Keywords: Trypanosoma cruzi; comparative genomics; genetic exchange; genetics; genomics; hybrid formation; infectious disease; microbiology; microevolution; recombination.


Conflict of interest statement

GM, MY, EG, LM, BA The authors declare no competing interests, ML, CT, MM No competing interests declared

Figures

Figure 1.
Figure 1.. In vitro microevolution of Trypanosoma cruzi hybrids.
(A) Overview of experimental design. (B) DNA content profiles shown as propidium iodide (PI) staining intensity histograms measured by flow cytometry. PI fluorescence = relative fluorescence units; y-axis shows number of events from the population of parasites at the indicated generation of the in vitro culture experiment from start (t=0) to finish (t=800). Plots of one parent and one hybrid are shown, representative of three biological replicates for each time point. The vertical dashed line marks the position of the G1 fluorescence intensity peak at t=0. (C) Quantitative analysis of DNA content for both parents and three hybrid strains at each time point and for three clones per strain generated after the final time point of 800 generations. Data are the mean + SEM of three biological replicates after normalization against an internal standard and conversion to a ratio of the mean of the two parents at t=0. The predicted total DNA content ranges equating to tetraploid (4n1k) and triploid (3n1k) parasites are indicated, under the assumption that kDNA constitutes between 20% and 30% of total DNA. (D) The same data as shown in C, represented as the % change in DNA content over time compared to t=0. (E) Distinct genomic signatures exclusive to each parental strain were inherited by the hybrid strains. In black are represented SNPs present in both parental strains, in green SNPs exclusive to the P1 strain, in purple SNPs exclusive to the P2 strain, in dark blue SNPs common to all hybrids, and in light blue SNPs exclusive to each hybrid clone.
Figure 2.
Figure 2.. Somy estimation based on read depth coverage (RDC) and allelic balance (AB) reveals aneuploidies in parental strains and tetrasomic hybrid clones.
(A) Aneuploidy analysis based on RDC among all 47 chromosomes in the starting generation of parental strains (P1-0 and P2-0) and hybrids (1C2-0, 1D12-0, and 2C1-0). An increase or decrease in the mean RDC of a chromosome when compared to the genome coverage is an indicator of a gain or loss of chromosomal sequences. When the ratio between the median chromosome coverage and the median genome coverage was approximately one, the chromosome was considered having the same somy as the genome, while fluctuations in this ratio (lower than 0.75 or higher than 1.25) were considered as putative aneuploidies. (B) Proportion of the alleles in heterozygous SNP positions in chromosomes with RDC ratio higher than 1.25 to confirm somy estimations. Blue points represent the proportion of the alleles in heterozygous SNP positions along the chromosome. Darker blue represents the frequency of the first allele while lighter blue represents the frequency of the second allele, black lines represent the median value in windows. (C) Ploidy estimation based on the proportion of the alleles in heterozygous SNP positions of single-copy genes. It is expected that diploid genomes display a proportion of each allele around 50%, triploid genomes around 33.3% and 66.6%, while tetraploid genomes around 25% and 75% or 50% (Lenski, 2017). Darker blue represents the frequency of the first allele while lighter blue represents the frequency of the second allele.
Figure 3.
Figure 3.. Somy estimation per chromosome based on allele balance (AB) in starting generation confirming aneuploidies in parental strains and tetrasomic hybrid clones.
(A) Gene distribution and its implication in mapping quality (MQ) and somy estimation of six representative TcI chromosomes with longer surface molecule-encoding regions (chromosomes 2, 7, and 13) and shorter encoding surface molecule-encoding regions (chromosomes 18, 21, and 37). Surface protein-coding genes are represented as cyan blue boxes while other genes are represented as black boxes. (B) Implication of chromosome gene distribution in MQ and somy estimation based on AB in chromosome 2 (longer surface molecule-encoding regions) of parental strain 1 (P1-0). Dark green represents the fluctuation in MQ along chromosome positions. Blue points represent the proportion of the alleles in heterozygous SNP positions along the chromosome. Darker blue represents the frequency of the first allele while lighter blue represents the frequency of the second allele, black lines represent the median value in windows. (C) Proportion of the alleles in heterozygous SNP positions in chromosomes with longer surface molecule-encoding regions. (D) Proportion of the alleles in heterozygous SNP positions in chromosomes with shorter surface molecule-encoding regions. Blue points represent the proportion of the alleles in heterozygous SNP positions along the chromosome. Darker blue represents the frequency of the first allele while lighter blue represents the frequency of the second allele, black lines represent the median value in windows.
Figure 3—figure supplement 1.
Figure 3—figure supplement 1.. Somy estimation per chromosome based on allele balance (AB) in starting generation confirming aneuploidies in essentially diploid P1.
Figure 3—figure supplement 2.
Figure 3—figure supplement 2.. Somy estimation per chromosome based on allele balance (AB) in starting generation confirming aneuploidies in essentially diploid P2.
Figure 3—figure supplement 3.
Figure 3—figure supplement 3.. Somy estimation per chromosome based on allele balance (AB) in starting generation confirming tetrasomic chromosomes in hybrid 1C2.
Figure 3—figure supplement 4.
Figure 3—figure supplement 4.. Somy estimation per chromosome based on allele balance (AB) in starting generation confirming tetrasomic chromosomes in hybrid 1D12.
Figure 3—figure supplement 5.
Figure 3—figure supplement 5.. Somy estimation per chromosome based on allele balance (AB) in starting generation confirming tetrasomic chromosomes in hybrid 2C1.
Figure 4.
Figure 4.. Somy estimation based on read depth coverage (RDC) and allele balance (AB) reveals novel aneuploidies and a shift in hybrid strains ploidy after 800 generations in in vitro culture.
(A) Aneuploidy analysis based on RDC among the 47 chromosomes in all clones after culture growth. (B) Proportion of the alleles in heterozygous SNP positions in chromosomes showing aneuploidies in all parental or hybrid clones. (C) Comparison of somy estimation based on the proportion of the alleles in heterozygous SNP positions of single-copy genes. First generation is presented in shaded blue, while the 800 generation is presented in orange.
Figure 5.
Figure 5.. Somy estimation confirming novel aneuploidies after in vitro culture.
(A) Proportion of the alleles in heterozygous SNP positions in chromosomes with longer surface molecule-encoding regions. (B) Proportion of the alleles in heterozygous SNP positions in chromosomes with shorter surface molecule-encoding regions. Points represent the proportion of the alleles in heterozygous SNP positions along the chromosome.
Figure 5—figure supplement 1.
Figure 5—figure supplement 1.. Somy estimation per chromosome based on allele balance (AB) confirming novel aneuploidies after in vitro culture in the essentially diploid replicate P1-1.
Figure 5—figure supplement 2.
Figure 5—figure supplement 2.. Somy estimation per chromosome based on allele balance (AB) confirming novel aneuploidies after in vitro culture in the essentially diploid replicate P1-2.
Figure 5—figure supplement 3.
Figure 5—figure supplement 3.. Somy estimation per chromosome based on allele balance (AB) confirming novel aneuploidies after in vitro culture in the essentially diploid replicate P1-3.
Figure 5—figure supplement 4.
Figure 5—figure supplement 4.. Somy estimation per chromosome based on allele balance (AB) confirming novel aneuploidies after in vitro culture in the essentially diploid replicate P2-1.
Figure 5—figure supplement 5.
Figure 5—figure supplement 5.. Somy estimation per chromosome based on allele balance (AB) confirming novel aneuploidies after in vitro culture in the essentially diploid replicate P2-2.
Figure 5—figure supplement 6.
Figure 5—figure supplement 6.. Somy estimation per chromosome based on allele balance (AB) confirming novel aneuploidies after in vitro culture in the essentially diploid replicate P2-3.
Figure 5—figure supplement 7.
Figure 5—figure supplement 7.. Somy estimation per chromosome based on allele balance (AB) confirming trisomic and tetrasomic chromosomes after in vitro culture in replicate 1C2-1.
Figure 5—figure supplement 8.
Figure 5—figure supplement 8.. Somy estimation per chromosome based on allele balance (AB) confirming trisomic and tetrasomic chromosomes after in vitro culture in replicate 1C2-2.
Figure 5—figure supplement 9.
Figure 5—figure supplement 9.. Somy estimation per chromosome based on allele balance (AB) confirming trisomic and tetrasomic chromosomes after in vitro culture in replicate 1C2-3.
Figure 5—figure supplement 10.
Figure 5—figure supplement 10.. Somy estimation per chromosome based on allele balance (AB) confirming trisomic and tetrasomic chromosomes after in vitro culture in replicate 1D12-1.
Figure 5—figure supplement 11.
Figure 5—figure supplement 11.. Somy estimation per chromosome based on allele balance (AB) confirming trisomic and tetrasomic chromosomes after in vitro culture in replicate 1D12-2.
Figure 5—figure supplement 12.
Figure 5—figure supplement 12.. Somy estimation per chromosome based on allele balance (AB) confirming trisomic and tetrasomic chromosomes after in vitro culture in replicate 1D12-3.
Figure 5—figure supplement 13.
Figure 5—figure supplement 13.. Somy estimation per chromosome based on allele balance (AB) confirming trisomic and tetrasomic chromosomes after in vitro culture in replicate 2C1-1.
Figure 5—figure supplement 14.
Figure 5—figure supplement 14.. Somy estimation per chromosome based on allele balance (AB) confirming trisomic and tetrasomic chromosomes after in vitro culture in replicate 2C1-2.
Figure 5—figure supplement 15.
Figure 5—figure supplement 15.. Somy estimation per chromosome based on allele balance (AB) confirming trisomic and tetrasomic chromosomes after in vitro culture in replicate 2C1-3.
Figure 6.
Figure 6.. Chromosome gene composition and copy number variation (CNV) comparison indicate genome erosion patterns in surface molecule-coding regions after in vitro culture growth.
(A) CNV comparison in parental strain. (B) CNV comparison in hybrid strain. Each dot in the CNV profile chart represents the normalized depth per kb, while lines represent the median ratio (Cingolani et al., 2012). Blue points and lines represent CNV profiles in the first generation, while red points and lines represent CNV profiles after 800 generations of in vitro culture growth. surface protein-coding genes are represented as cyan blue boxes, while other genes are represented as black boxes.
Figure 6—figure supplement 1.
Figure 6—figure supplement 1.. Counts of A. gene families and other membrane functional categories and B. other functional functional categories displaying copy number variation after culture growth.
Figure 7.
Figure 7.. SNP density analysis throughout the genome indicates that surface molecule-coding regions displayed a higher number of variants than other regions of the genome for all strains.
(A) Number of SNPs in all clones after long-term in vitro culture. In black are represented SNPs common to all hybrid strains, in green SNPs specific to P1 strain, in purple SNPs specific to the P2 strain, in dark blue SNPs common to all hybrids in the first generation, in light blue SNPs exclusive to each hybrid clone in the first generation, and in orange SNPs exclusive to each clone after culture growth. (B) Chromosome average SNP density per kilobase in all samples before (1 g) and after culture growth (800 g). (C) 1C2 chromosomes with higher SNP density plotted displaying gene composition and SNP density. Surface protein-coding genes are represented as cyan blue boxes, while other genes are represented as black boxes.

Similar articles

Cited by

References

    1. Alves CL, Repolês BM, da Silva MS, Mendes IC, Marin PA, Aguiar PHN, Santos SDS, Franco GR, Macedo AM, Pena SDJ, Andrade LDO, Guarneri AA, Tahara EB, Elias MC, Machado CR. The recombinase Rad51 plays a key role in events of genetic exchange in Trypanosoma cruzi. Scientific Reports. 2018;8:13335. doi: 10.1038/s41598-018-31541-z. - DOI - PMC - PubMed
    1. Augusto-Pinto L, Teixeira SMR, Pena SDJ, Machado CR. Single-nucleotide polymorphisms of the Trypanosoma cruzi MSH2 gene support the existence of three phylogenetic lineages presenting differences in mismatch-repair efficiency. Genetics. 2003;164:117–126. doi: 10.1093/genetics/164.1.117. - DOI - PMC - PubMed
    1. Bennett RJ. The parasexual lifestyle of Candida albicans. Current Opinion in Microbiology. 2015;28:10–17. doi: 10.1016/j.mib.2015.06.017. - DOI - PMC - PubMed
    1. Bern C. Chagas’ Disease. The New England Journal of Medicine. 2015;373:456–466. doi: 10.1056/NEJMra1410150. - DOI - PubMed
    1. Boeva V, Popova T, Bleakley K, Chiche P, Cappo J, Schleiermacher G, Janoueix-Lerosey I, Delattre O, Barillot E. Control-FREEC: a tool for assessing copy number and allelic content using next-generation sequencing data. Bioinformatics (Oxford, England) 2012;28:423–425. doi: 10.1093/bioinformatics/btr670. - DOI - PMC - PubMed

Publication types