. 2022 May 10:11:e75170.
doi: 10.7554/eLife.75170.

Early life infection and proinflammatory, atherogenic metabolomic and lipidomic profiles in infancy: a population-based cohort study

Collaborators, Affiliations

Early life infection and proinflammatory, atherogenic metabolomic and lipidomic profiles in infancy: a population-based cohort study

Toby Mansell et al. Elife. .

Abstract

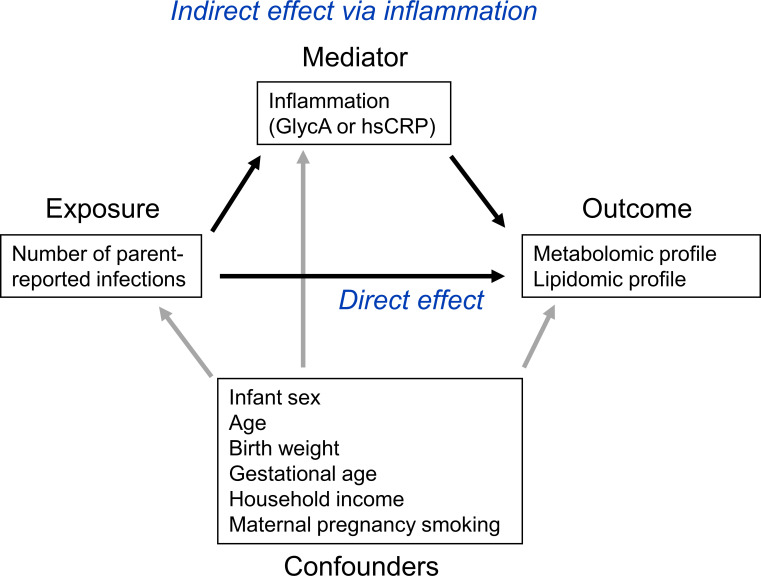
Background: The risk of adult onset cardiovascular and metabolic (cardiometabolic) disease accrues from early life. Infection is ubiquitous in infancy and induces inflammation, a key cardiometabolic risk factor, but the relationship between infection, inflammation, and metabolic profiles in early childhood remains unexplored. We investigated relationships between infection and plasma metabolomic and lipidomic profiles at age 6 and 12 months, and mediation of these associations by inflammation.

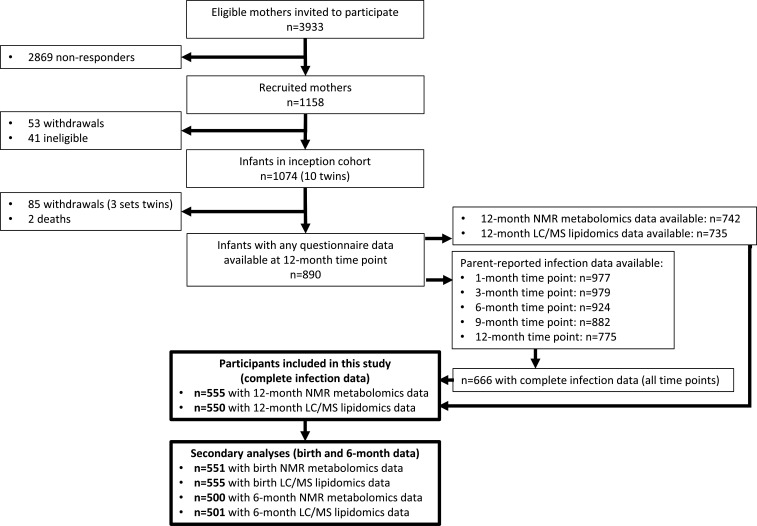
Methods: Matched infection, metabolomics, and lipidomics data were generated from 555 infants in a pre-birth longitudinal cohort. Infection data from birth to 12 months were parent-reported (total infections at age 1, 3, 6, 9, and 12 months), inflammation markers (high-sensitivity C-reactive protein [hsCRP]; glycoprotein acetyls [GlycA]) were quantified at 12 months. Metabolic profiles were 12-month plasma nuclear magnetic resonance metabolomics (228 metabolites) and liquid chromatography/mass spectrometry lipidomics (776 lipids). Associations were evaluated with multivariable linear regression models. In secondary analyses, corresponding inflammation and metabolic data from birth (serum) and 6-month (plasma) time points were used.

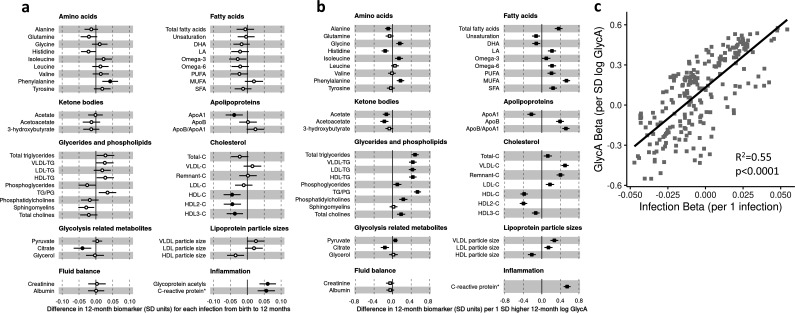
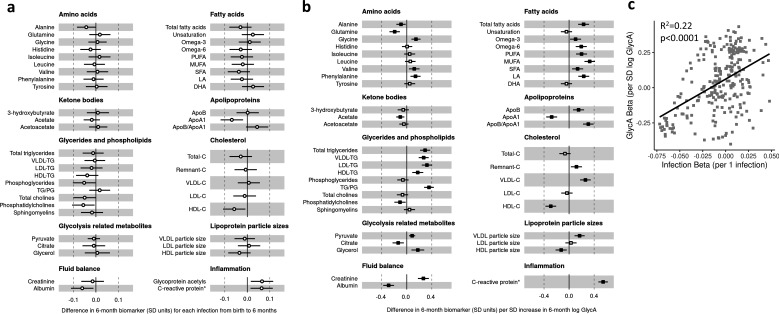
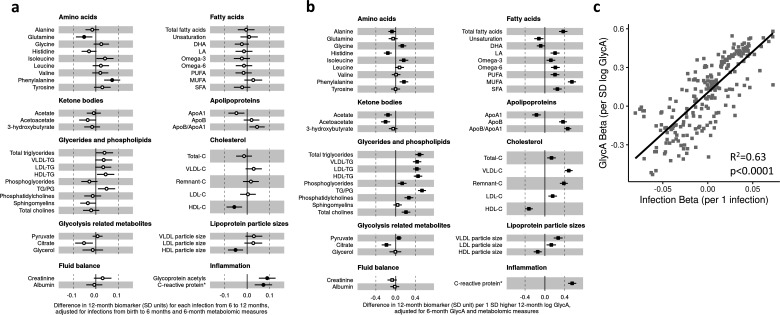
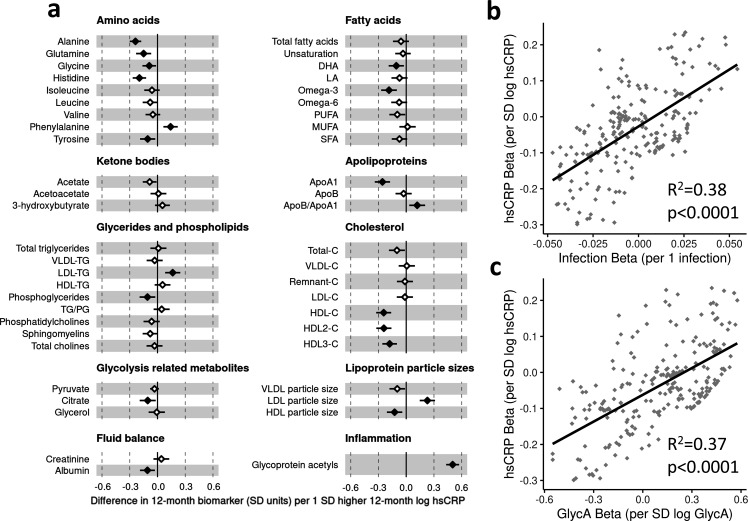
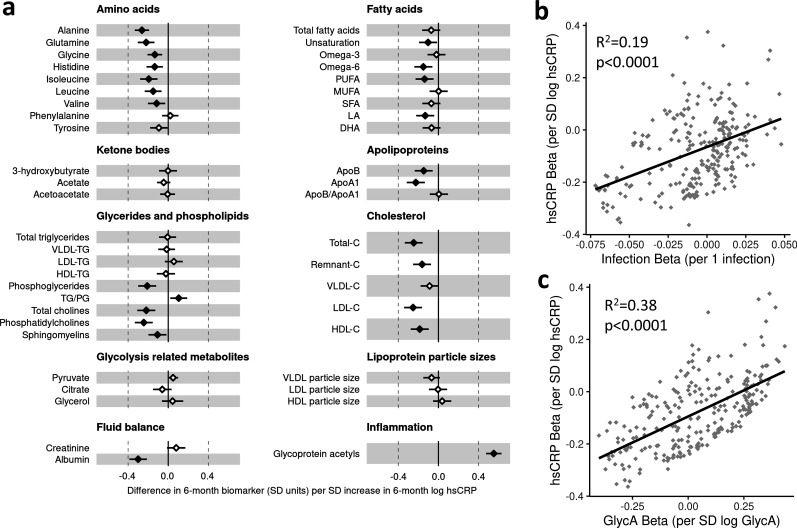
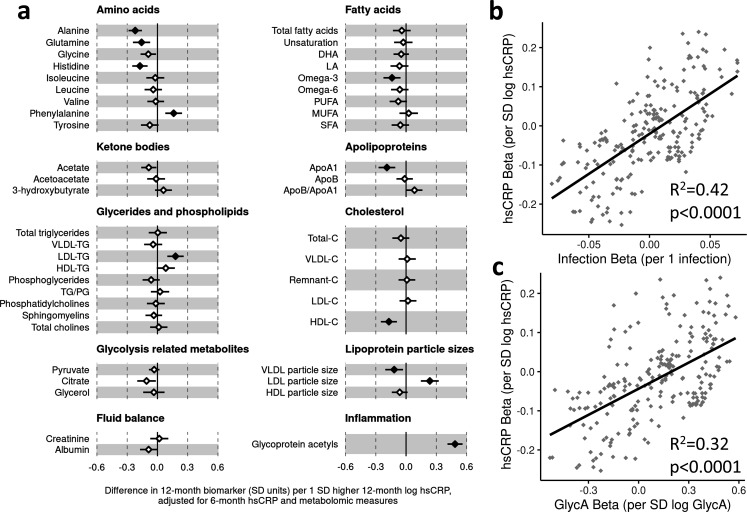
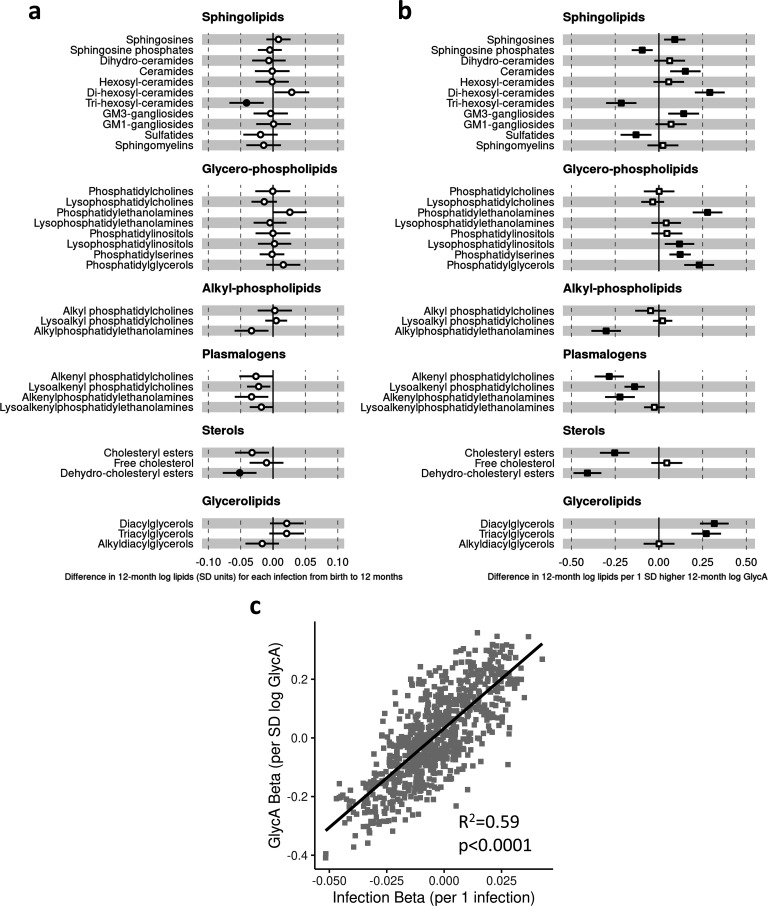
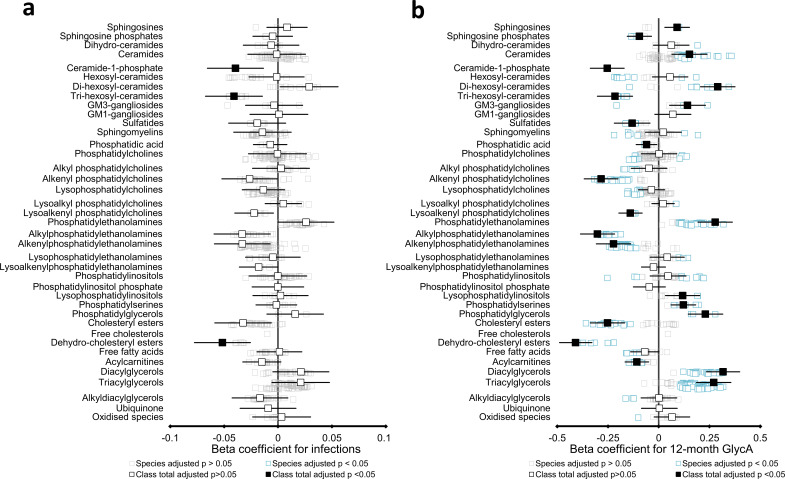
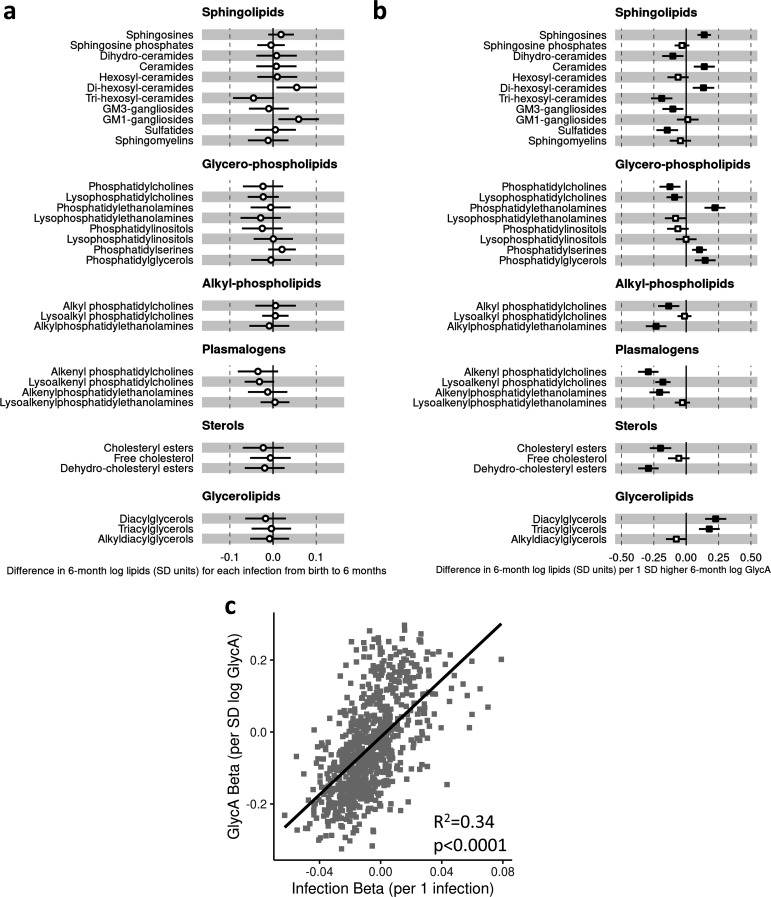
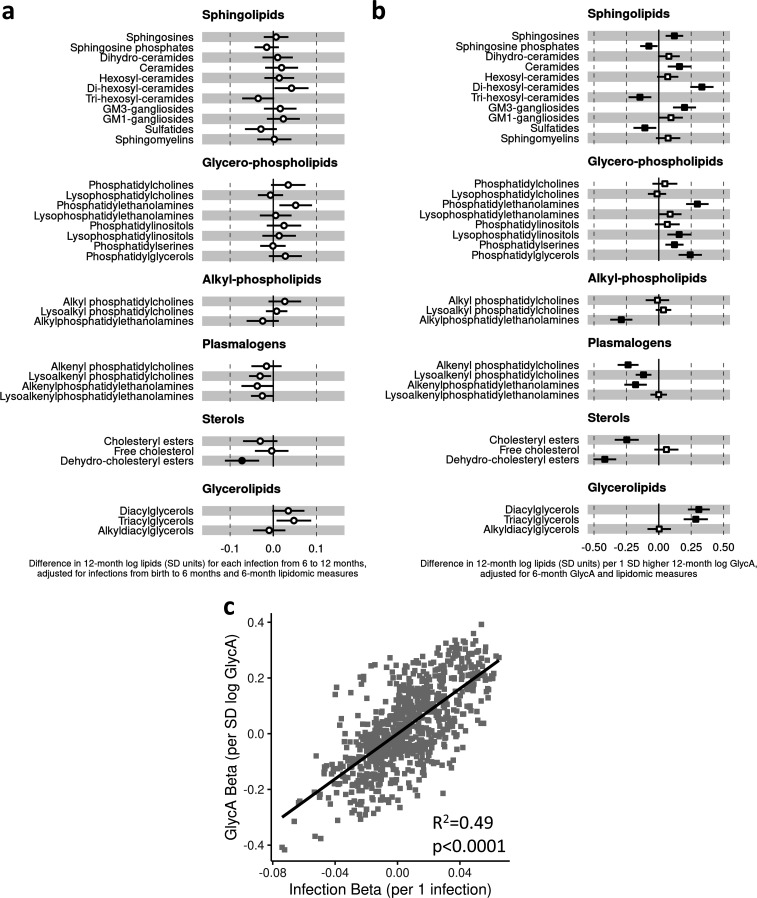
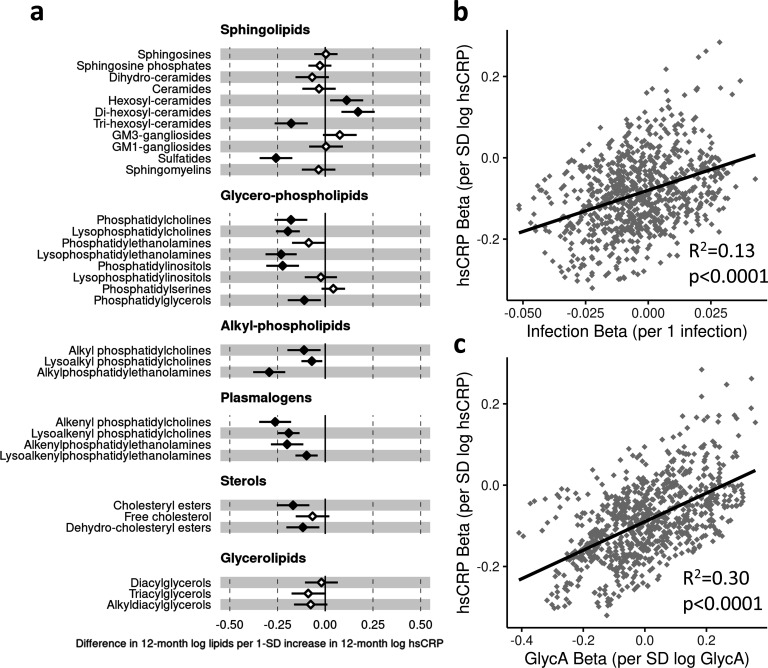
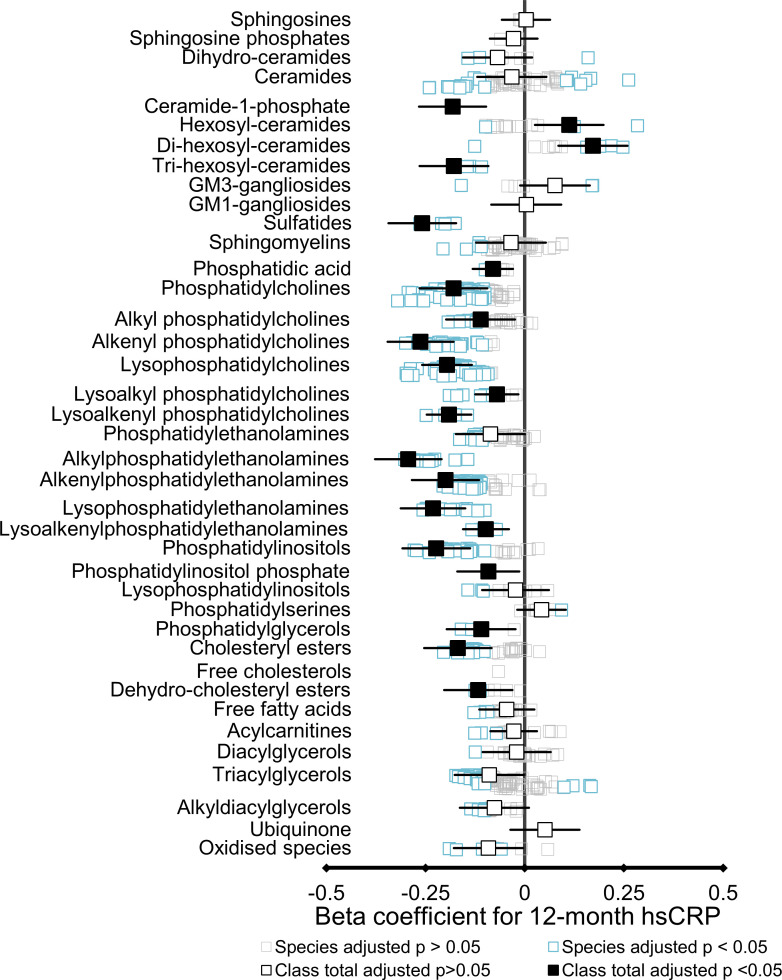
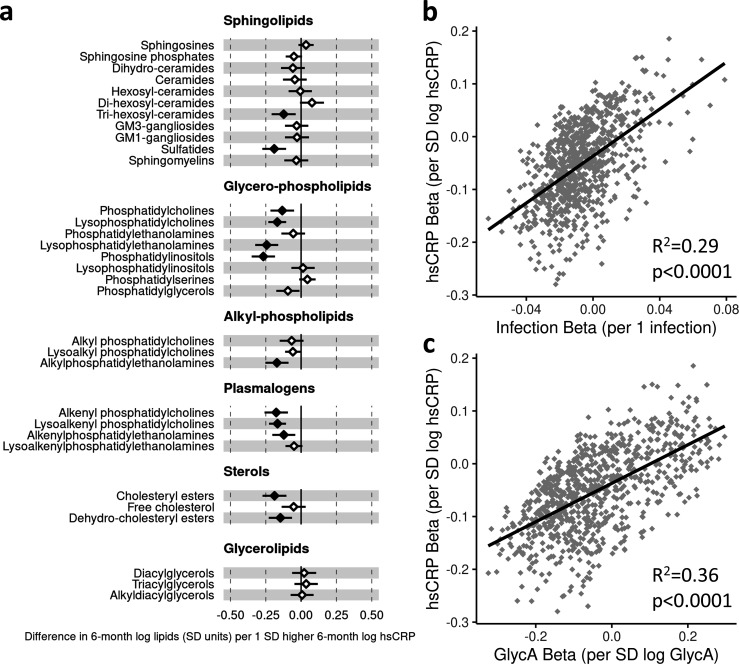
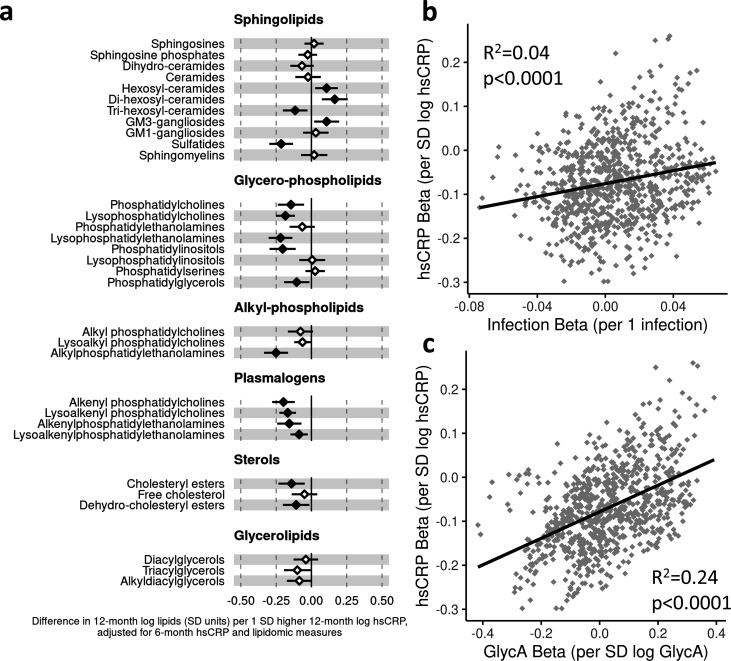
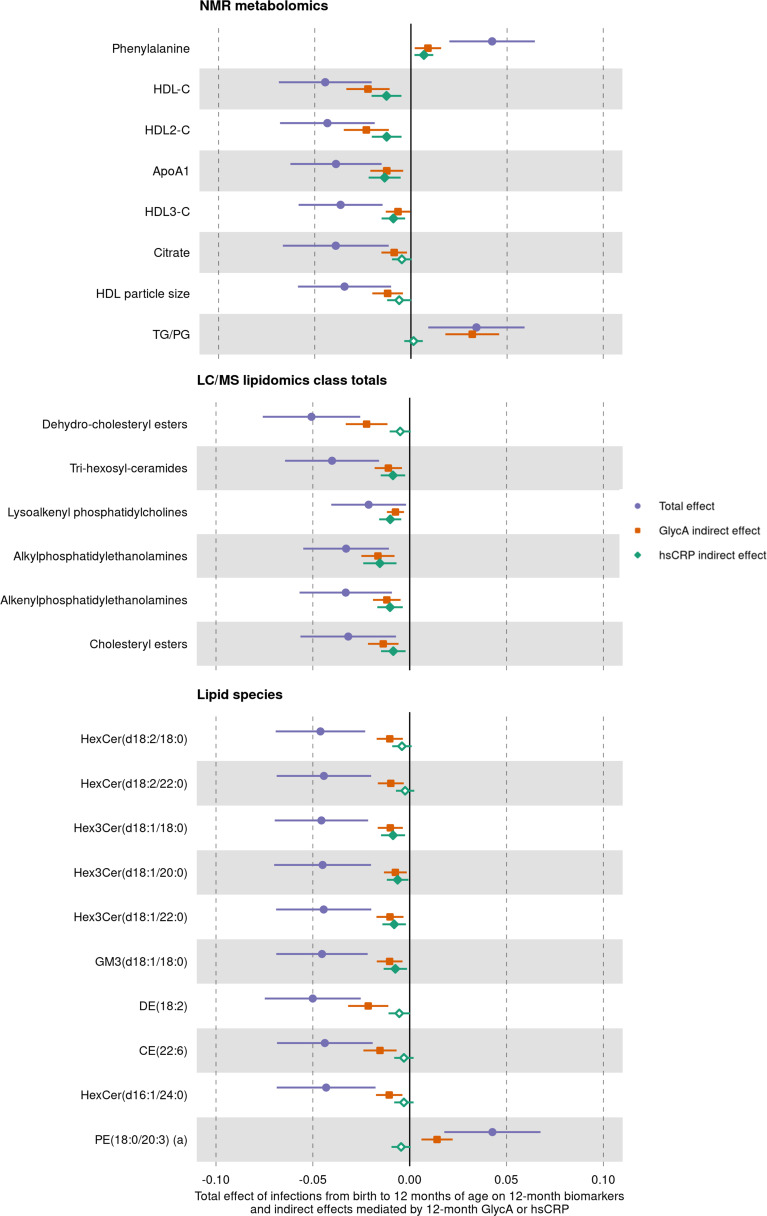
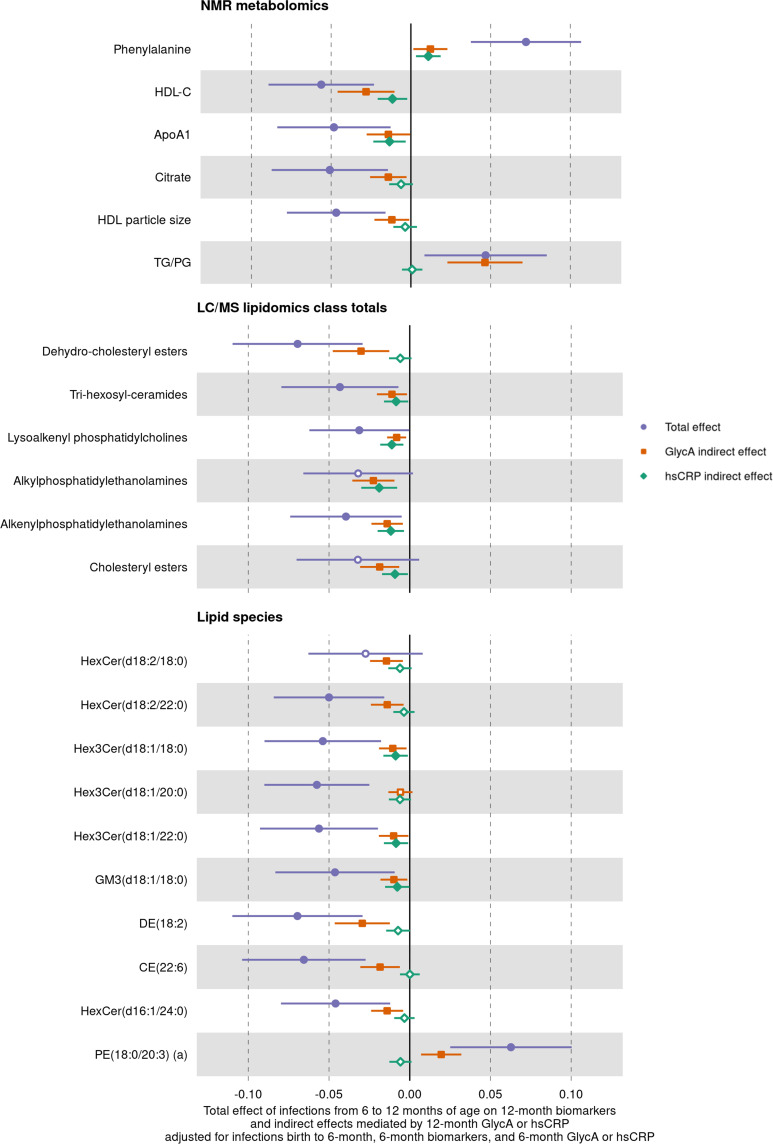
Results: At 12 months, more frequent infant infections were associated with adverse metabolomic (elevated inflammation markers, triglycerides and phenylalanine, and lower high-density lipoprotein [HDL] cholesterol and apolipoprotein A1) and lipidomic profiles (elevated phosphatidylethanolamines and lower trihexosylceramides, dehydrocholesteryl esters, and plasmalogens). Similar, more marked, profiles were observed with higher GlycA, but not hsCRP. GlycA mediated a substantial proportion of the relationship between infection and metabolome/lipidome, with hsCRP generally mediating a lower proportion. Analogous relationships were observed between infection and 6-month inflammation, HDL cholesterol, and apolipoprotein A1.

Conclusions: Infants with a greater infection burden in the first year of life had proinflammatory and proatherogenic plasma metabolomic/lipidomic profiles at 12 months of age that in adults are indicative of heightened risk of cardiovascular disease, obesity, and type 2 diabetes. These findings suggest potentially modifiable pathways linking early life infection and inflammation with subsequent cardiometabolic risk.

Funding: The establishment work and infrastructure for the BIS was provided by the Murdoch Children's Research Institute (MCRI), Deakin University, and Barwon Health. Subsequent funding was secured from National Health and Medical Research Council of Australia (NHMRC), The Shepherd Foundation, The Jack Brockhoff Foundation, the Scobie & Claire McKinnon Trust, the Shane O'Brien Memorial Asthma Foundation, the Our Women's Our Children's Fund Raising Committee Barwon Health, the Rotary Club of Geelong, the Minderoo Foundation, the Ilhan Food Allergy Foundation, GMHBA, Vanguard Investments Australia Ltd, and the Percy Baxter Charitable Trust, Perpetual Trustees. In-kind support was provided by the Cotton On Foundation and CreativeForce. The study sponsors were not involved in the collection, analysis, and interpretation of data; writing of the report; or the decision to submit the report for publication. Research at MCRI is supported by the Victorian Government's Operational Infrastructure Support Program. This work was also supported by NHMRC Senior Research Fellowships to ALP (1008396); DB (1064629); and RS (1045161) , NHMRC Investigator Grants to ALP (1110200) and DB (1175744), NHMRC-A*STAR project grant (1149047). TM is supported by an MCRI ECR Fellowship. SB is supported by the Dutch Research Council (452173113).

Keywords: Barwon Infant Study; epidemiology; global health; human; infection; inflammation; lipidomic; metabolomic; paediatric.


Conflict of interest statement

TM TM has received a postdoctoral fellowship from MCRI, is supported by NHMRC funding, has received travel support from MCRI and the University of Melbourne, and received a PhD scholarship from the University of Melbourne, RS, SB, AS, RR, PS, FC, PM No competing interests declared, AP ALP is an unpaid scientific advisor for, and has shares in, Dysrupt Labs. ALP has shares in Prevatex Pty Ltd, MT MLKT has received funding paid to Murdoch Childen's Research Institute (MCRI) from NHMRC, Prota Theraputics, Abbott Nutrition, the Allergy and Immunology Foundation of Australasia, and the National Children's Research Centre of Ireland, and has received internal research funding from MCRI. MLKT is inventor of 2 patents owned by MCRI relating to allergy treatment and a method to induce tolerance to an allergen. MLKT is a member of the Advisory Boards for Pfizer (has received personal fee) and Anaphylaxis & Anaphylaxis Australia, and of allergy/anaphylaxis-related Committees for the World Allergy Organisation, the International Union of Immunological Societies, the Asia Pacific Association of Allergy Asthma and Clinical Immunology, the American Academy of Allergy Asthma and Immunology, and the Australasian Society of Clinical Immunology and Allergy. MLKT is employee of, and has share options in, Prota Therapeutics. MLKT is an Associate Editor for the Journal of Allergy and Clinical Immunology: Global, MO MOH has stocks in Prevatex Pty Ltd, SB S Bekkering has received postdoctoral grants from the Dutch Heart Foundation and the Dutch Research Council, and travel support from the European Society for Atherosclerosis, SR SR is Director of the Lung Foundation Australia. SR has stocks/options in Prevatex Pty Ltd, PV PV is an inventor on a patent relating to the relationship between maternal carriage of Prevotella. copri and offspring allergic disease, and has stocks/options in Prevatex Pty Ltd, DB DB has received an Investigator Grant and Project Grant from the Australian National Health and Medical Research Council (NHMRC)

Figures

Figure 1.
Figure 1.. Representative directed acyclic graph (DAG) for causal model investigated in this study.
The natural indirect effect (mediated by glycoprotein acetyls [GlycA] or high-sensitivity C-reactive protein [hsCRP]) and natural direct effect (not mediated by GlycA/hsCRP) of parent-reported infections on metabolomic and lipidomic measures were calculated, with adjustment for confounders. Confounders were considered to be confounders for all associations (exposure to outcome, exposure to mediator, and mediator to outcome).
Figure 2.
Figure 2.. Flowchart of Barwon Infant Study participants included this study (bolded boxes).
Included participants had complete infection data from all five time points between birth and 12 months of age, and 12-month plasma nuclear magnetic resonance (NMR) metabolomics data. Almost all included participants (n = 550 out of 555) had 12-month plasma liquid chromatography/mass spectrometry (LC/MS) lipidomics data.
Figure 3.
Figure 3.. Difference in 12-month plasma nuclear magnetic resonance (NMR) metabolomic measures for each increase in parent-reported infection (birth to 12 months) and for each SD increase in 12-month glycoprotein acetyls (GlycA) (n = 555).
Forest plots of the estimated 12-month metabolomic differences for each additional parent-reported infection from birth to 12 months (a, circle points) or SD log 12-month GlycA (b, square points) from adjusted linear regression models, and the correlation of estimated metabolomic differences for these two exposures (c). Error bars are 95% confidence intervals. Closed points represent adjusted p-value < 0.05. All models were adjusted for infant age, sex, gestational age, birth weight, maternal household income, smoking during pregnancy, breastfeeding status, and sample processing time. Infection and GlycA exposure model estimates and details for all NMR metabolomic measures are shown in Figure 3—source data 1.
Figure 3—figure supplement 1.
Figure 3—figure supplement 1.. Difference in 6-month plasma nuclear magnetic resonance (NMR) metabolomic measures for each increase in parent-reported infection from birth to 6 months and for each SD increase in 6-month log glycoprotein acetyls (GlycA) (n = 500).
Forest plots of the estimated 6-month metabolomic differences for each additional parent-reported infection from birth to 6 months (a, circle points) or SD log 6 month GlycA (b, square points) from adjusted linear regression models, and the correlation of estimated metabolomic differences for these two exposures (c). Error bars are 95% confidence intervals. Closed points represent adjusted p-value < 0.05. All models were adjusted for infant age, sex, gestational age, birth weight, maternal household income, smoking during pregnancy, breastfeeding status, and sample processing time. Infection and GlycA exposure model estimates and details for all NMR metabolomic measures are shown in Figure 3—source data 2.
Figure 3—figure supplement 2.
Figure 3—figure supplement 2.. Difference in 12-month plasma nuclear magnetic resonance (NMR) metabolomic measures (adjusted for corresponding 6-month measure) per 1 increase in parent-reported infection from 6 to 12 months of age (adjusted for infections from birth to 6 months) or per SD increase in 12-month log glycoprotein acetyls (GlycA) (adjusted for 6-month GlycA) (n = 500).
Forest plots of the estimated 12-month metabolomic differences for each additional parent-reported infection from 6 to 12 months (a, circle points) or SD log 12-month GlycA (b, square points) from adjusted linear regression models, adjusted for corresponding 6-month metabolomic measures. Infection models were adjusted for number of infections from birth to 6 months of age, and GlycA models were adjusted for 6-month GlycA. The correlation of estimated metabolomic differences for these two exposures (c). Error bars are 95% confidence intervals. Closed points represent adjusted p-value < 0.05. All models were adjusted for infant age, sex, gestational age, birth weight, maternal household income, smoking during pregnancy, breastfeeding status, and sample processing time. Infection and GlycA exposure model estimates and details for all NMR metabolomic measures are shown in Figure 3—source data 3.
Figure 4.
Figure 4.. Difference in 12-month plasma nuclear magnetic resonance (NMR) metabolomic measures for each SD increase in 12-month high-sensitivity C-reactive protein (hsCRP) (n = 555).
Forest plot for the estimated 12-month metabolomic differences for each additional SD log 12-month hsCRP (a, diamond points) from adjusted linear regression models, and the correlation of estimated metabolomic differences for infection and hsCRP (b) and for glycoprotein acetyls (GlycA) and hsCRP (c). Error bars are 95% confidence intervals. Closed points represent adjusted p-value < 0.05. All models were adjusted for infant age, sex, gestational age, birth weight, maternal household income, smoking during pregnancy, breastfeeding status, and sample processing time. hsCRP exposure model estimates and details for all NMR metabolomic measures are shown in Figure 4—source data 1.
Figure 4—figure supplement 1.
Figure 4—figure supplement 1.. Difference in 6-month plasma nuclear magnetic resonance (NMR) metabolomic measures for each SD increase in 6-month log high-sensitivity C-reactive protein (hsCRP) (n = 500).
Forest plot for the estimated 6-month metabolomic differences for each additional SD log 6-month hsCRP (a, diamond points) from adjusted linear regression models, and the correlation of estimated metabolomic differences for infection and hsCRP (b) and for glycoprotein acetyls (GlycA) and hsCRP (c). Error bars are 95% confidence intervals. Closed points represent adjusted p-value < 0.05. All models were adjusted for infant age, sex, gestational age, birth weight, maternal household income, smoking during pregnancy, breastfeeding status, and sample processing time. hsCRP exposure model estimates and details for all NMR metabolomic measures are shown in Figure 4—source data 2.
Figure 4—figure supplement 2.
Figure 4—figure supplement 2.. Difference in 12-month plasma nuclear magnetic resonance (NMR) metabolomic measures (adjusted for corresponding 6-month measure) per SD increase in 12-month log high-sensitivity C-reactive protein (hsCRP) (adjusted for 6-month hsCRP) (n = 500).
Forest plot for the estimated 12-month metabolomic differences (adjusted for corresponding 6-month metabolomic measure) for each additional SD log 12-month hsCRP (adjusted for 6-month hsCRP) (a, diamond points) from adjusted linear regression models, and the correlation of estimated metabolomic differences for infection and hsCRP (b) and for glycoprotein acetyls (GlycA) and hsCRP (c). Error bars are 95% confidence intervals. Closed points represent adjusted p-value < 0.05. All models were adjusted for infant age, sex, gestational age, birth weight, maternal household income, smoking during pregnancy, breastfeeding status, and sample processing time. hsCRP exposure model estimates and details for all NMR metabolomic measures are shown in Figure 4—source data 3.
Figure 5.
Figure 5.. Difference in 12-month plasma liquid chromatography/mass spectrometry (LC/MS) lipidomic class totals for each increase in parent-reported infection (birth to 12 months) and for each SD increase in 12-month glycoprotein acetyls (GlycA) (n = 550).
Forest plots of the estimated 12-month lipidomic differences in class totals for each additional parent-reported infection from birth to 12 months (a, circle points) or SD log 12-month GlycA (b, square points) from adjusted linear regression models, and the correlation of estimated differences for these two exposures across all lipidomic measures (c). In (a) and (b), error bars are 95% confidence intervals. Closed points represent adjusted p-value < 0.05. All models were adjusted for infant age, sex, gestational age, birth weight, maternal household income, smoking during pregnancy, breastfeeding status, and sample processing time. Forest plots depicting individual lipid species within each group are shown in Figure 5—figure supplement 1. Infection and GlycA exposure model estimates and details for all LC/MS lipidomic measures are shown in Figure 5—source data 1.
Figure 5—figure supplement 1.
Figure 5—figure supplement 1.. Forest plots showing the difference in 12-month liquid chromatography/mass spectrometry (LC/MS) lipidomic classes and lipid species per 1 increase in parent-reported infection from birth to 12 months of age and per SD increase in 12-month log glycoprotein acetyls (GlycA) (n = 550).
Forest plots of the estimated 12-month lipidomic differences in lipid class totals (solid boxes) and individual lipid species (pale boxes) for each additional parent-reported infection from birth to 12 months (a) or SD log 12-month GlycA (b) from adjusted linear regression models. Closed points for class totals and blue points for lipid species represent adjusted p-value < 0.05. Error bars are 95% confidence intervals for class totals. All models were adjusted for infant age, sex, gestational age, birth weight, maternal household income, smoking during pregnancy, breastfeeding status, and sample processing time. Infection and GlycA exposure model estimates and details for all LC/MS lipidomic measures are shown in Figure 5—source data 1.
Figure 5—figure supplement 2.
Figure 5—figure supplement 2.. Difference in 6-month plasma liquid chromatography/mass spectrometry (LC/MS) lipidomic measures for each increase in parent-reported infection from birth to 6 months and for each SD increase in 6-month log glycoprotein acetyls (GlycA) (n = 501).
Forest plots of the estimated 6-month lipidomic differences in class totals for each additional parent-reported infection from birth to 6 months (a, circle points) or SD log 6-month GlycA (b, square points) from adjusted linear regression models, and the correlation of estimated differences for these two exposures across all lipidomic measures (c). In (a) and (b), error bars are 95% confidence intervals. Closed points represent adjusted p-value < 0.05. All models were adjusted for infant age, sex, gestational age, birth weight, maternal household income, smoking during pregnancy, breastfeeding status, and sample processing time. Infection and GlycA exposure model estimates and details for all LC/MS lipidomic measures are shown in Figure 5—source data 2.
Figure 5—figure supplement 3.
Figure 5—figure supplement 3.. Difference in 12-month plasma liquid chromatography/mass spectrometry (LC/MS) lipidomic measures (adjusted for corresponding 6-month measure) per 1 increase in parent-reported infection from 6 to 12 months of age (adjusted for infections from birth to 6 months) or per SD increase in 12-month log glycoprotein acetyls (GlycA) (adjusted for 6 month GlycA) (n = 496).
Forest plots of the estimated 12-month lipidomic differences in class totals for each additional parent-reported infection from 6 to 12 months (a, circle points) or SD log 12-month GlycA (b, square points) from adjusted linear regression models, adjusted for corresponding 6-month lipidomic measures. Infection models were adjusted for number of infections from birth to 6 months of age, and GlycA models were adjusted for 6-month GlycA. The correlation of estimated differences for these two exposures across all lipidomic measures (c). In (a) and (b), error bars are 95% confidence intervals. Closed points represent adjusted p-value < 0.05. All models were adjusted for infant age, sex, gestational age, birth weight, maternal household income, smoking during pregnancy, breastfeeding status, and sample processing time. Infection and GlycA exposure model estimates and details for all LC/MS lipidomic measures are shown in Figure 5—source data 3.
Figure 6.
Figure 6.. Difference in 12-month plasma liquid chromatography/mass spectrometry (LC/MS) lipidomic class totals for each SD increase in 12-month high-sensitivity C-reactive protein (hsCRP) (n = 550).
Forest plot for the estimated 12-month lipidomic differences for each additional SD log 12-month hsCRP (a, diamond points) from adjusted linear regression models, and the correlation of estimated differences across all lipidomic measures for infection and hsCRP (b) and glycoprotein acetyls (GlycA) and hsCRP (c). In (a), error bars are 95% confidence intervals. Closed points represent adjusted p-value < 0.05. All models were adjusted for infant age, sex, gestational age, birth weight, maternal household income, smoking during pregnancy, breastfeeding status, and sample processing time. Forest plots depicting individual lipid species within each group are shown in Figure 6—figure supplement 1. hsCRP exposure model estimates and details for all LC/MS lipidomic measures are shown in Figure 6—source data 1.
Figure 6—figure supplement 1.
Figure 6—figure supplement 1.. Forest plots showing the difference in 12-month liquid chromatography/mass spectrometry (LC/MS) lipidomic classes and lipid species per SD increase in 12-month log high-sensitivity C-reactive protein (hsCRP) (n = 550).
Forest plots of the estimated 12-month lipidomic differences in lipid class totals (solid boxes) and individual lipid species (pale boxes) for each SD log 12-month hsCRP from adjusted linear regression models. Closed points for class totals and blue points for lipid species represent adjusted p-value < 0.05. Error bars are 95% confidence intervals for class totals. All models were adjusted for infant age, sex, gestational age, birth weight, maternal household income, smoking during pregnancy, breastfeeding status, and sample processing time. hsCRP exposure model estimates and details for all LC/MS lipidomic measures are shown in Figure 6—source data 1.
Figure 6—figure supplement 2.
Figure 6—figure supplement 2.. Difference in 6-month plasma liquid chromatography/mass spectrometry (LC/MS) lipidomic measures for each SD increase in 6-month log high-sensitivity C-reactive protein (hsCRP) (n = 501).
Forest plot for the estimated 6-month lipidomic differences for each additional SD log 6-month hsCRP (a, diamond points) from adjusted linear regression models, and the correlation of estimated differences across all lipidomic measures for infection and hsCRP (b) and glycoprotein acetyls (GlycA) and hsCRP (c). In (a), error bars are 95% confidence intervals. Closed points represent adjusted p-value < 0.05. All models were adjusted for infant age, sex, gestational age, birth weight, maternal household income, smoking during pregnancy, breastfeeding status, and sample processing time. hsCRP exposure model estimates and details for all LC/MS lipidomic measures are shown in Figure 6—source data 2.
Figure 6—figure supplement 3.
Figure 6—figure supplement 3.. Difference in 12-month plasma liquid chromatography/mass spectrometry (LC/MS) lipidomic measures (adjusted for corresponding 6-month measure) per SD increase in 12-month log high-sensitivity C-reactive protein (hsCRP) (adjusted for 6-month hsCRP) (n = 496).
Forest plot for the estimated 12-month lipidomic differences (adjusted for corresponding 6-month lipidomic measure) for each additional SD log 12-month hsCRP (adjusted for 6-month hsCRP) (a, diamond points) from adjusted linear regression models, and the correlation of estimated lipidomic differences for infection and hsCRP (b) and for glycoprotein acetyls (GlycA) and hsCRP (c). In (a), error bars are 95% confidence intervals. Closed points represent adjusted p-value < 0.05. All models were adjusted for infant age, sex, gestational age, birth weight, maternal household income, smoking during pregnancy, breastfeeding status, and sample processing time. hsCRP exposure model estimates and details for all LC/MS lipidomic measures are shown in Figure 6—source data 3.
Figure 7.
Figure 7.. Total effect of infection on 12-month metabolomic and lipidomic measures (purple, circle points) and the estimated natural indirect effect component of these mediated by glycoprotein acetyls (GlycA) (orange, square points) or high-sensitivity C-reactive protein (hsCRP) (green, diamond points).
Units of change are 1 infection for parent-reported infections, and 1 SD change for GlycA, hsCRP, and metabolomic/lipidomic measures on log scale. Error bars are 95% confidence intervals. Closed points represent p-value < 0.05. All models were adjusted for infant age, sex, gestational age, birth weight, maternal household income, smoking during pregnancy, breastfeeding status, and sample processing time. Model details are in Figure 7—source data 1.
Figure 7—figure supplement 1.
Figure 7—figure supplement 1.. Total effect of infection from 6 to 12 months on 12-month metabolomic and lipidomic measures (purple, circle points) and the estimated natural indirect effect component of these mediated by 12-month glycoprotein acetyls (GlycA) (orange, square points) or high-sensitivity C-reactive protein (hsCRP) (green, diamond points), with adjustment for infections from birth to 6 months of age, 6-month inflammation, and the corresponding 6-month metabolomic/lipidomic measure.
Units of change are 1 infection for parent-reported infections, and 1 SD change for GlycA, hsCRP, and metabolomic/lipidomic measures on log scale. Error bars are 95% confidence intervals. Closed points represent p-value < 0.05. All models were adjusted for infant age, sex, gestational age, birth weight, maternal household income, smoking during pregnancy, breastfeeding status, and sample processing time. Model details are in Figure 7—source data 2.
Author response image 1.
Author response image 1.. Distribution of 12-month plasma processing times for the participants in this study.

Similar articles

Cited by

References

    1. Abella V, Scotece M, Conde J, Pino J, Gonzalez-Gay MA, Gómez-Reino JJ, Mera A, Lago F, Gualillo O. Leptin in the interplay of inflammation, metabolism and immune system disorders. Nature Reviews. Rheumatology. 2017;13:100–109. doi: 10.1038/nrrheum.2016.209. - DOI - PubMed
    1. Akinkuolie AO, Buring JE, Ridker PM, Mora S. A novel protein glycan biomarker and future cardiovascular disease events. Journal of the American Heart Association. 2014;3:e001221. doi: 10.1161/JAHA.114.001221. - DOI - PMC - PubMed
    1. Alvarez C, Ramos A. Lipids, lipoproteins, and apoproteins in serum during infection. Clinical Chemistry. 1986;32:142–145. doi: 10.1093/clinchem/32.1.142. - DOI - PubMed
    1. Behnes M, Brueckmann M, Lang S, Putensen C, Saur J, Borggrefe M, Hoffmann U. Alterations of leptin in the course of inflammation and severe sepsis. BMC Infectious Diseases. 2012;12:1–11. doi: 10.1186/1471-2334-12-217. - DOI - PMC - PubMed
    1. Benjamini Y, Hochberg Y. Controlling the False Discovery Rate: A Practical and Powerful Approach to Multiple Testing. Journal of the Royal Statistical Society. 1995;57:289–300. doi: 10.1111/j.2517-6161.1995.tb02031.x. - DOI

Publication types