. 2022 May 10:11:e73405.
doi: 10.7554/eLife.73405.

Thermosynechococcus switches the direction of phototaxis by a c-di-GMP-dependent process with high spatial resolution

Affiliations

Thermosynechococcus switches the direction of phototaxis by a c-di-GMP-dependent process with high spatial resolution

Daisuke Nakane et al. Elife. .

Abstract

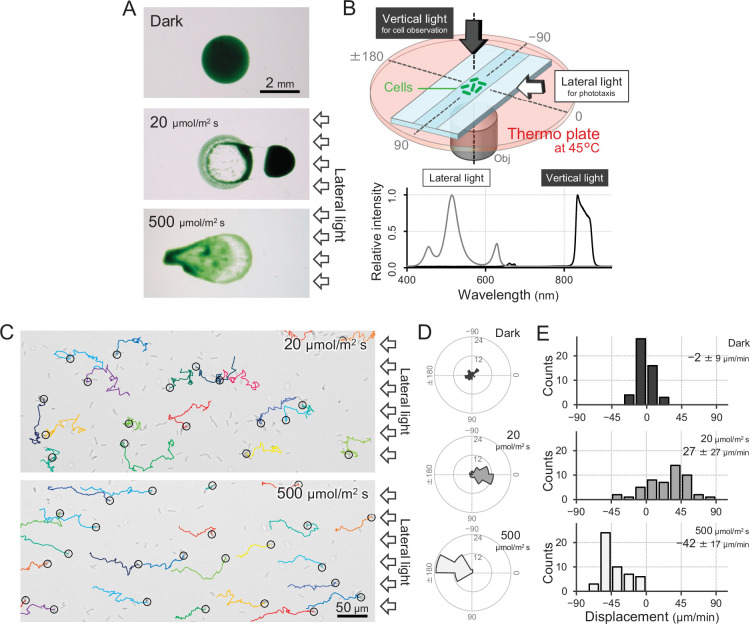
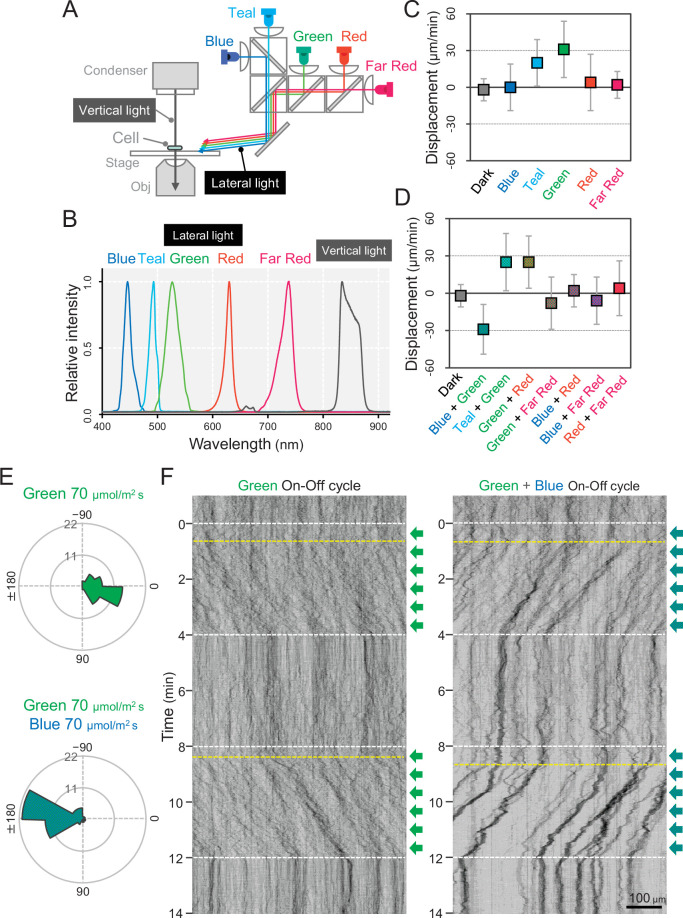
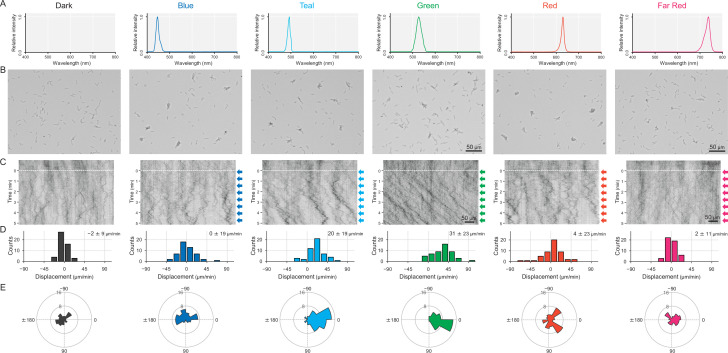
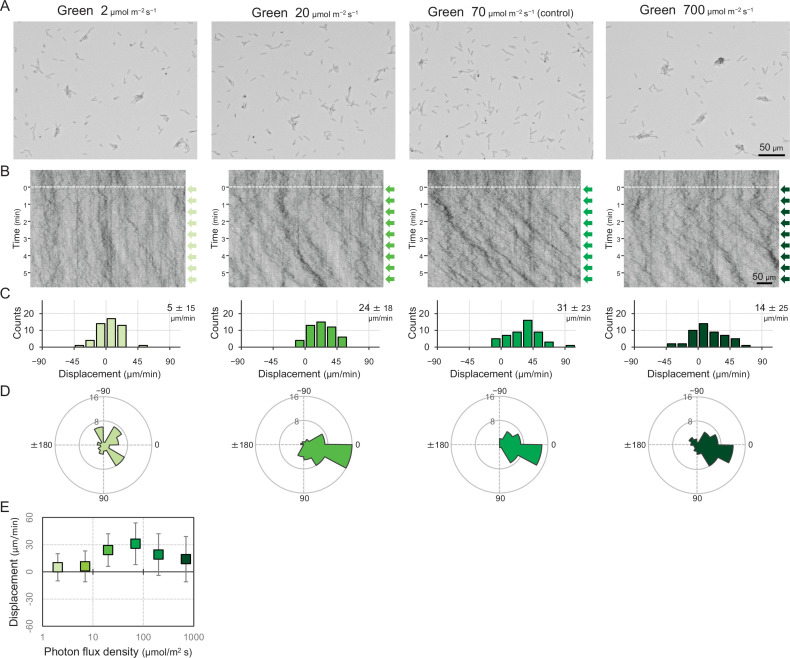
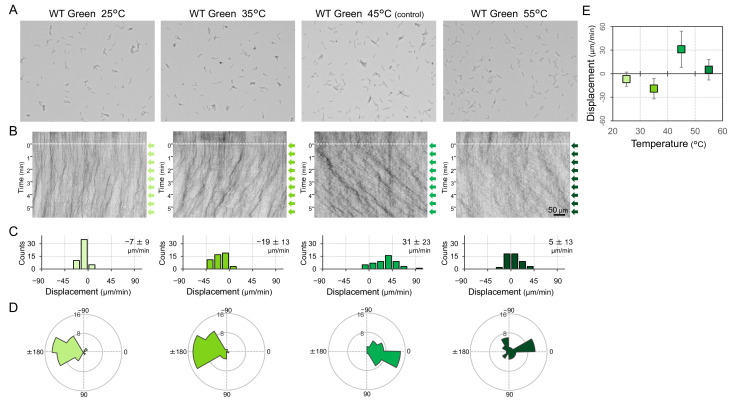
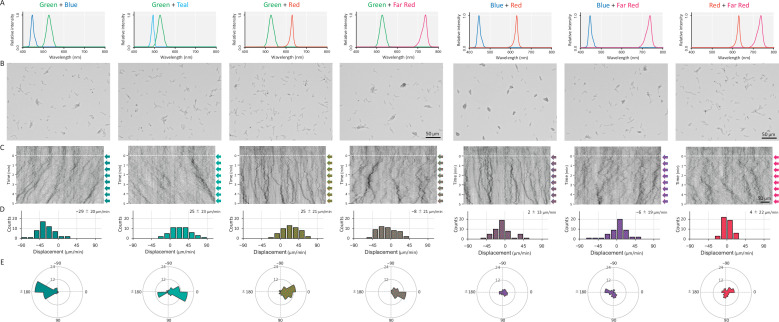
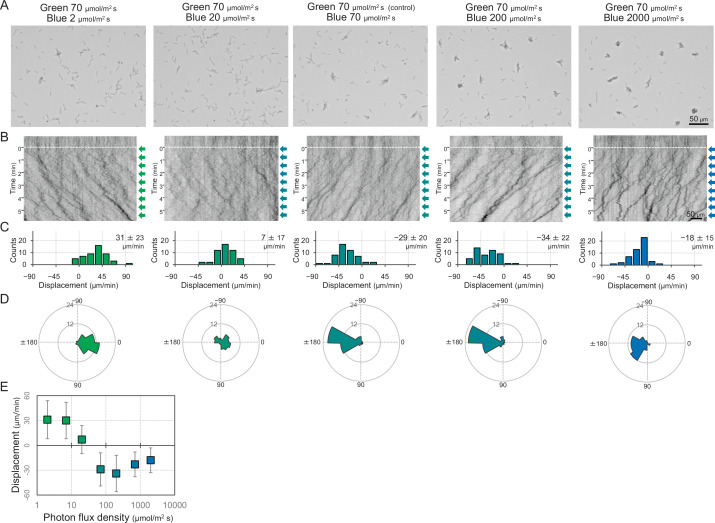
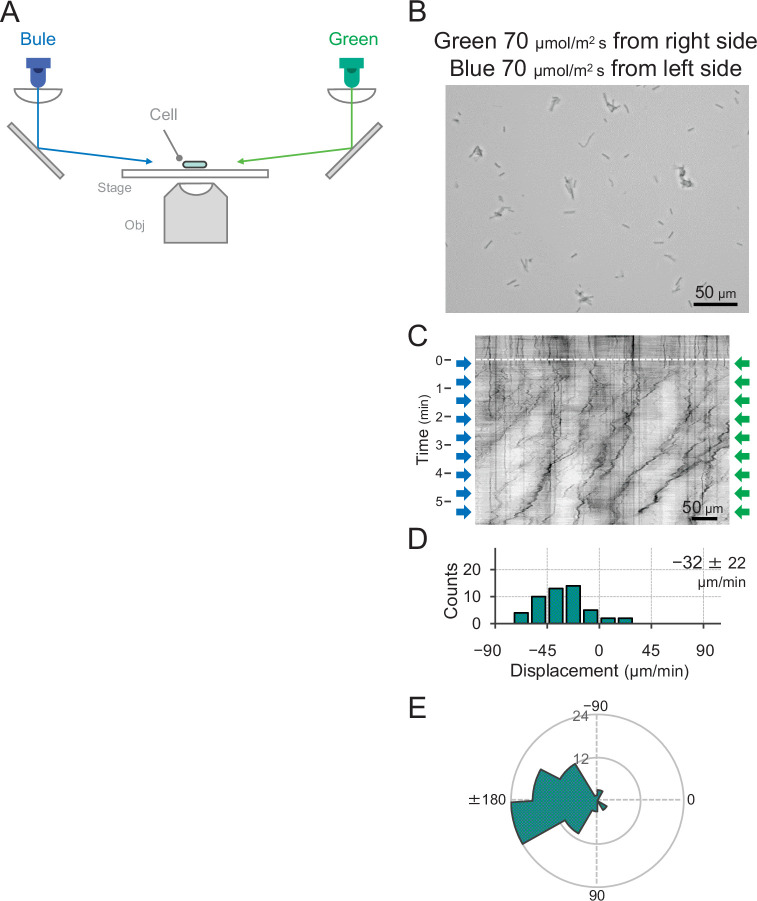
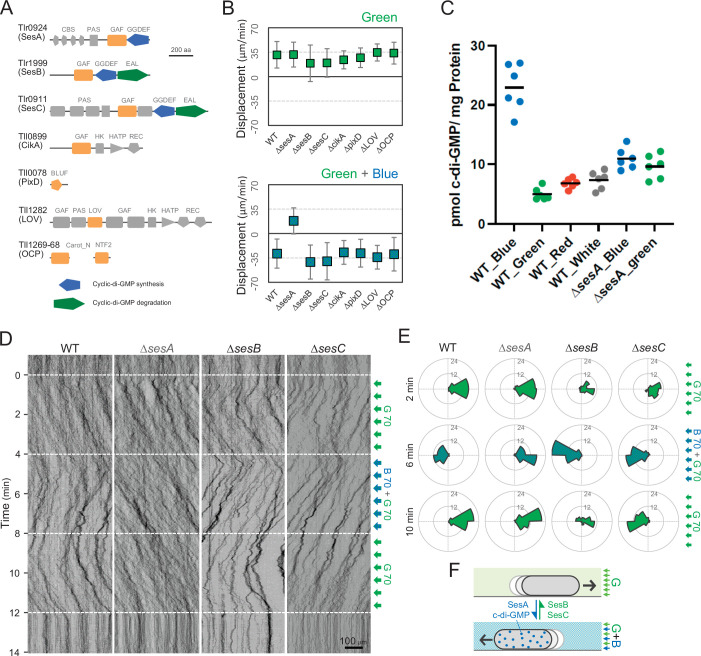
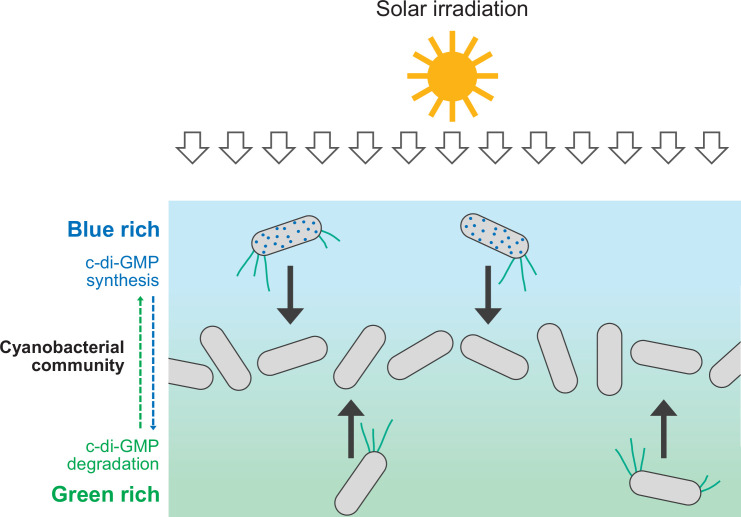
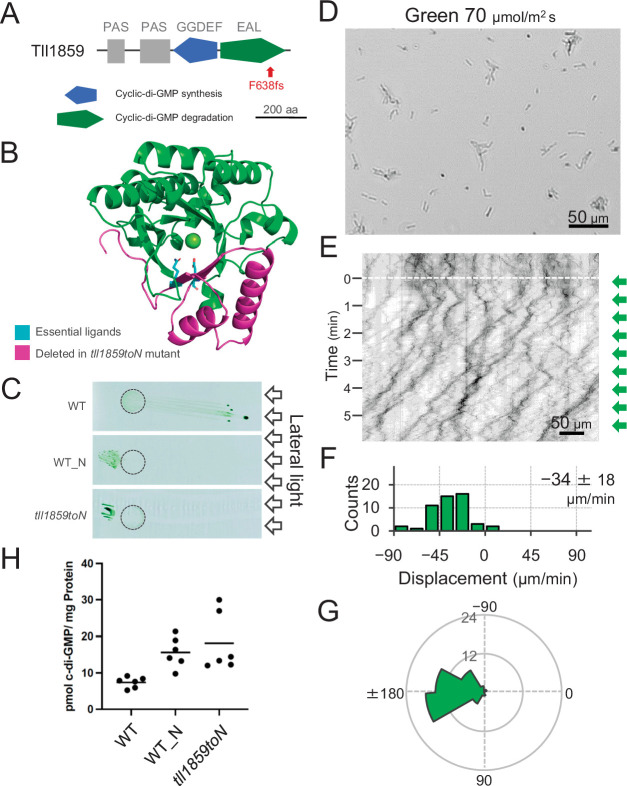
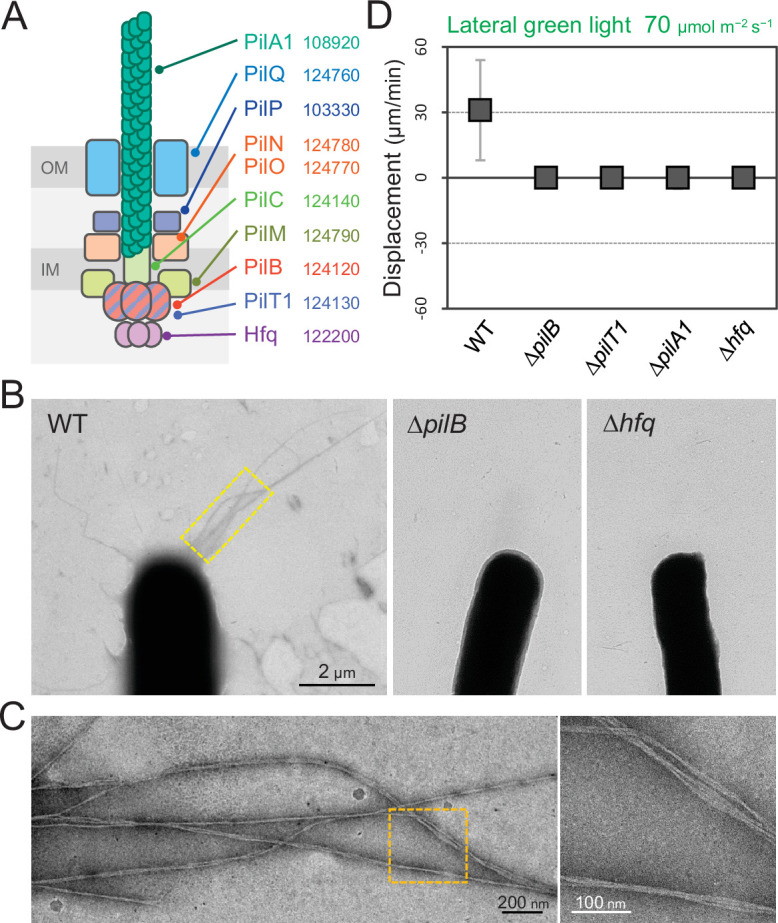
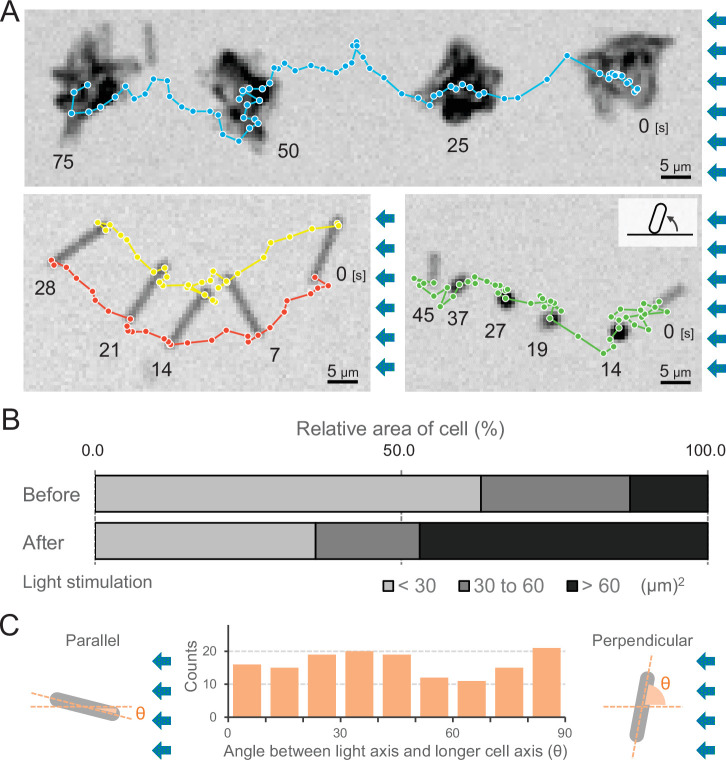
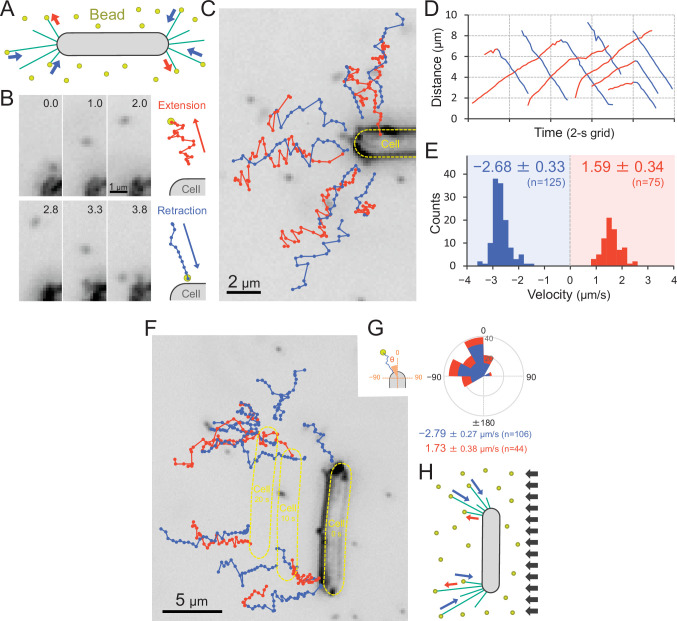
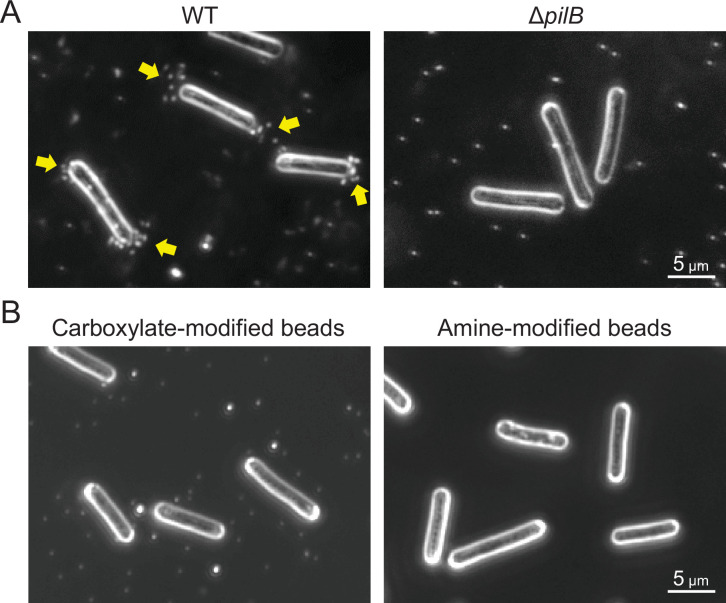
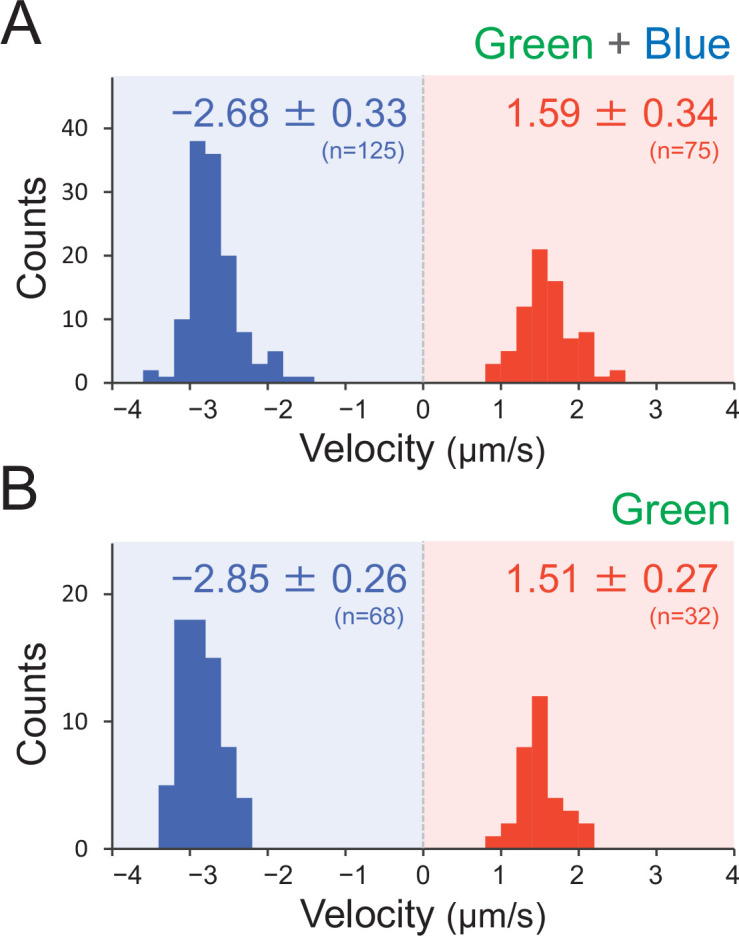
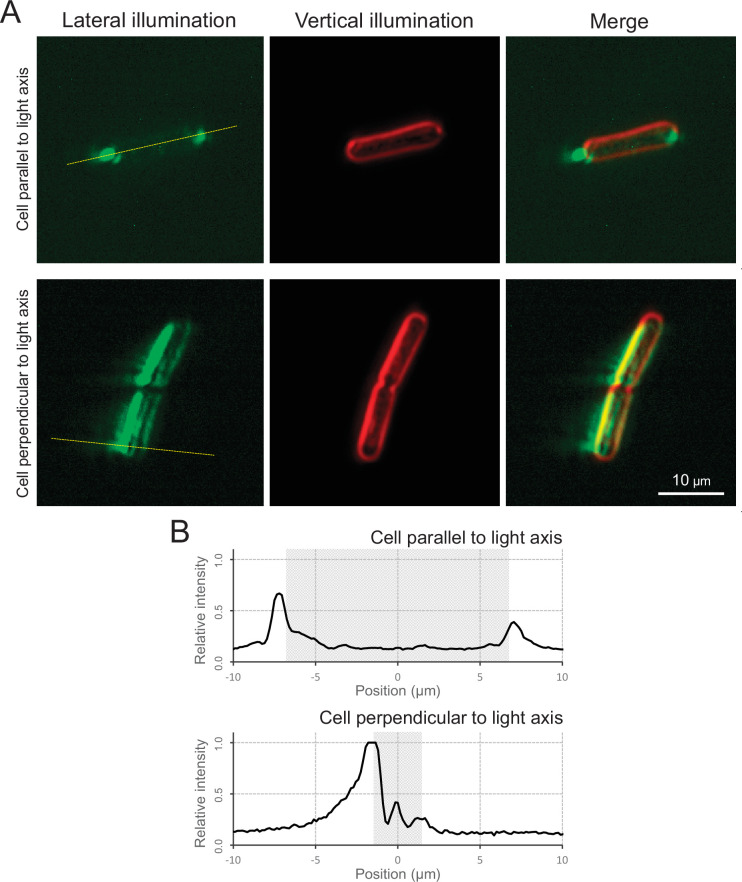
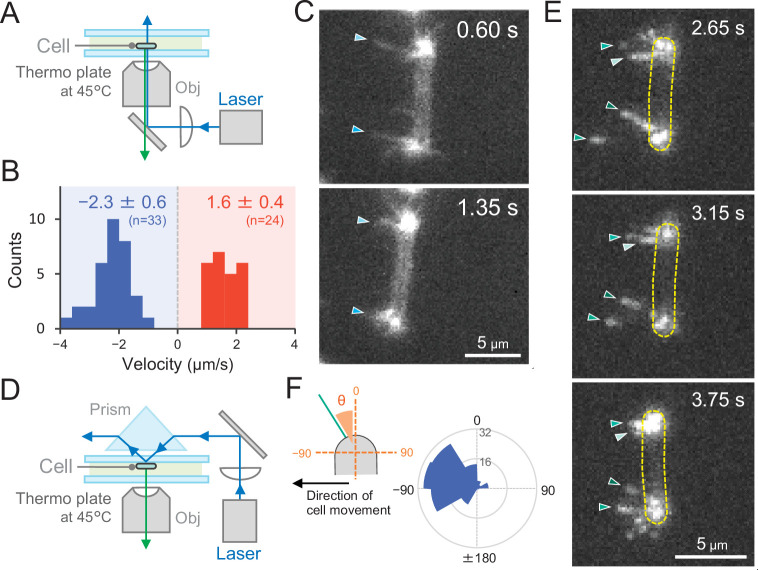
Many cyanobacteria, which use light as an energy source via photosynthesis, show directional movement towards or away from a light source. However, the molecular and cell biological mechanisms for switching the direction of movement remain unclear. Here, we visualized type IV pilus-dependent cell movement in the rod-shaped thermophilic cyanobacterium Thermosynechococcus vulcanus using optical microscopy at physiological temperature and light conditions. Positive and negative phototaxis were controlled on a short time scale of 1 min. The cells smoothly moved over solid surfaces towards green light, but the direction was switched to backward movement when we applied additional blue light illumination. The switching was mediated by three photoreceptors, SesA, SesB, and SesC, which have cyanobacteriochrome photosensory domains and synthesis/degradation activity of the bacterial second messenger cyclic dimeric GMP (c-di-GMP). Our results suggest that the decision-making process for directional switching in phototaxis involves light-dependent changes in the cellular concentration of c-di-GMP. Direct visualization of type IV pilus filaments revealed that rod-shaped cells can move perpendicular to the light vector, indicating that the polarity can be controlled not only by pole-to-pole regulation but also within-a-pole regulation. This study provides insights into previously undescribed rapid bacterial polarity regulation via second messenger signalling with high spatial resolution.

Keywords: infectious disease; microbiology; optical microscopy; photoreceptor; polarity; signal transduction; type IV pili.

Plain language summary

Cyanobacteria, like plants, grow by capturing energy from sunlight. But they have an advantage over their leafy counterparts: they can explore their environment to find the type of light that best suits their needs. These movements rely on hook-like structures, called type IV pili, which allow the cells to pull themselves forward. The pili are usually located at the opposite poles of a rod-shaped cell, allowing the bacteria to move along their longer axis. Yet, the molecular mechanisms that allow cyanobacteria to react to the light are poorly understood. To explore these processes in more detail, Nakane, Enomoto et al. started by shining coloured lights on the rod-shaped cyanobacteria Thermosynechococcus vulcanus. This revealed that the cells moved towards green light but reversed rapidly when blue light was added. The behaviour was disrupted when the genes for three light-sensing proteins were artificially switched off. These molecular players act by changing the levels of cyclic di-GMP, a signalling molecule that may interact with type IV pili. The experiments also showed that T. vulcanus cells were not only moving along their longer axis, but also at a right-angle. This observation contrasts with how other rod-shaped bacteria can explore their environment. A closer look revealed that the cyanobacteria could perform these movements by making asymmetrical adjustment to the way that pili at each pole were working. Further research is now needed to more finely dissect the molecular mechanisms which control this remarkable type of motion.


Conflict of interest statement

DN, GE, HB, YH, AW, TN No competing interests declared

Figures

Figure 1.
Figure 1.. Positive and negative phototaxis of T.
vulcanus. (A) Phototaxis on agar plates. Images were taken 8 hr after spotting the cell suspension. (B) Diagram of the experimental setup to visualize single cellular behaviour under optical microscopy. The glass chamber was heated at 45°C with a thermoplate on a microscope stage. Vertical and lateral light sources were used for cell observation and stimulation of phototaxis, respectively. Light spectra are presented at the bottom. (C) Bright-field cell image and their moving trajectories for 120 s (colour lines) on a glass surface. The cell at the start position of a trajectory is marked by the black circle. The white arrows on the right side of the image represent the direction of the light axis. (D) Rose plots under dark, weak light, and strong light illumination. The moving direction of a cell that translocated more than 6 μm min−1 was counted. Angle 0 was the direction towards the lateral light source (N = 50 cells). (E) Histograms of the cell displacement along the lateral light axis. The cell displacement for a duration of 1 min was measured at 4 min after lateral illumination was turned on (N = 50 cells). Cell movements towards the light source are shown as a positive value.
Figure 2.
Figure 2.. Wavelength dependency of phototaxis via optical microscopy.
(A) Schematics of the lateral illumination for phototaxis. Five LEDs were simultaneously applied through dichroic mirrors from the right side. (B) Spectra of lateral and vertical light for phototaxis. (C) Effects of the monochromatic light source on the phototactic behaviour of cells on a glass surface. (D) Effects of dichromatic light source on the phototactic behaviour of cells over the glass surface. Each lateral light was used at a fluence rate of 70 μmol m−2 s−1. The average and standard deviation (SD) of the cell displacement along the light axis are presented (N = 50). (E) Rose plots under green light at 70 μmol m−2 s−1 (upper) and green and blue light at 70 μmol m−2 s−1 (lower). The moving direction of a cell that translocated more than 6 μm min−1 was counted. Angle 0 was the direction towards the lateral light source (N = 50 cells). (F) On–off control of phototaxis. A kymogram of cell movements along the optical axis of lateral illumination is presented. Directional movements of cells are shown by the tilted lines over time. The tilted lines from the left-upper to the right-lower side and from the right-upper to the left-lower side presented positive and negative phototaxis, respectively. Lateral illumination was applied with a time interval of 4 min and indicated by the dashed white lines (see also Videos 5 and 6). The delay of the cell response after the illumination was turned on is indicated by the dashed yellow lines.
Figure 2—figure supplement 1.
Figure 2—figure supplement 1.. Cell movement after applying a monochromatic light source.
(A) Spectra of each LED used for stimulation. No lateral illumination in the dark condition. Infrared light was used for cell observation from a halogen lamp through a bandpass filter (see more detail in Figure 2A,B and Materials and methods). (B) Cell images at 4 min after the lateral light was turned on. Lateral light from each LED was adjusted at a fluence rate of 70 μmol m−2 s−1 and applied from the right side of the image. (C) Kymograph of cell movements along the optical axis of lateral illumination. Directional movements of cells are presented by the tilted lines over time. Lateral light illumination was turned on at time 0, presented as a dashed white line. (D) Histograms of the cell displacement along the lateral light axis. Cell movements towards the light source are shown as a positive value. (E) Rose plots. The moving direction of a cell that translocated more than 6 μm min−1 was counted. Angle 0 was the direction towards the lateral light source. The cell displacement for a duration of 1 min was measured at 4 min after lateral illumination was turned on (N = 50 cells).
Figure 2—figure supplement 2.
Figure 2—figure supplement 2.. Cell movement at various fluence rates of a lateral green light.
(A) Cell images at 4 min after the lateral light was turned on. (B) Kymograph of cell movements along the optical axis of lateral illumination. Directional movements of cells are presented by the tilted lines over time. Lateral light illumination was turned on at time 0, presented as a dashed white line. (C) Histograms of the cell displacement along the lateral light axis. Cell movements towards the light source are shown as a positive value. (D) Rose plots. The moving direction of a cell that translocated more than 6 μm min−1 was counted. Angle 0 was the direction towards the lateral light source. The cell displacement for a duration of 1 min was measured at 4 min after lateral illumination was turned on (N = 50 cells). (E) Effects of the fluence rate on the phototactic behaviour of cells. The average and standard deviation (SD) of the cell displacement along the light axis are presented (N = 50).
Figure 2—figure supplement 3.
Figure 2—figure supplement 3.. Phototactic behaviour of wild type (WT) cells at various temperatures.
Lateral light from a single LED was adjusted to a fluence rate of 70 μmol m−2 s−1 and applied from the right side of the image. (A) Cell image at 4 min after the lateral light was turned on. (B) Kymograph of cell movements along the optical axis of lateral illumination. Directional movements of cells are presented by the tilted lines over time. Lateral light illumination was turned on at time 0, presented as a dashed white line. (C) Histograms of the cell displacement along the lateral light axis. Cell movements towards the light source are shown as a positive value. (D) Rose plots. The moving direction of a cell that translocated more than 6 μm min−1 was counted. Angle 0 was the direction towards the lateral light source. The cell displacement for a duration of 1 min was measured at 4 min after lateral illumination was turned on (N = 50 cells). (E) Effects of the fluence rate on the phototactic behaviour of WT cells. The average and standard deviation (SD) of the cell displacement along the light axis are presented (N = 50).
Figure 2—figure supplement 4.
Figure 2—figure supplement 4.. Cell movement after applying a dichromatic light source.
(A) Spectra of two LEDs used for stimulation. (B) Cell images at 4 min after the lateral light was turned on. Lateral light from two LEDs was adjusted at a fluence rate of 70 μmol m−2 s−1 for each LED and applied from the right side of the image. (C) Kymograph of cell movements along the optical axis of lateral illumination. Directional movements of cells are presented by the tilted lines over time. Lateral light illumination was turned on at time 0, presented as a dashed white line. (D) Histograms of the cell displacement along the lateral light axis. Cell movements towards the light source are shown as a positive value. (E) Rose plots. The moving direction of a cell that translocated more than 6 μm min−1 was counted. Angle 0 was the direction towards the lateral light source. The cell displacement for a duration of 1 min was measured at 4 min after lateral illumination was turned on (N = 50 cells).
Figure 2—figure supplement 5.
Figure 2—figure supplement 5.. Dose dependency of blue light to induce negative phototaxis.
Lateral blue light was adjusted at various fluence rates, while lateral green light was fixed at 70 μmol m−2 s−1, as presented at the top. (A) Cell images at 4 min after the lateral light was turned on. (B) Kymograph of cell movements along the optical axis of lateral illumination. Directional movements of cells are presented by the tilted lines over time. Lateral light illumination was turned on at time 0, presented as a dashed white line. (C) Histograms of the cell displacement along the lateral light axis. Cell movements towards the light source are shown as a positive value. (D) Rose plots. The moving direction of a cell that translocated more than 6 μm min−1 was counted. Angle 0 was the direction towards the lateral light source. The cell displacement for a duration of 1 min was measured at 4 min after lateral illumination was turned on (N = 50 cells). (E) Effects of the fluence rate of blue light to induce negative phototaxis. The average and standard deviation (SD) of the cell displacement along the light axis are presented (N = 50).
Figure 2—figure supplement 6.
Figure 2—figure supplement 6.. Effect of blue light illumination from the other side of green light on phototaxis.
(A) Schematic of the lateral light illumination. Blue and green light were applied from the left and right sides of the image at 70 μmol m−2 s−1, respectively. (B) Cell images at 4 min after the lateral light was turned on. (C) Kymograph of cell movements along the optical axis of lateral illumination. Directional movements of cells are presented by the tilted lines over time. Lateral light illumination was turned on at time 0, presented as a dashed white line. (D) Histograms of the cell displacement along the lateral light axis. Cell movements towards the light source are shown as a positive value. The average and standard deviation (SD) of the cell displacement along the light axis are presented (N = 50). (E) Rose plots. The moving direction of a cell that translocated more than 6 μm min−1 was counted. Angle 0 was the direction towards the lateral light source of the green light. The cell displacement for a duration of 1 min was measured at 4 min after lateral illumination was turned on (N = 50 cells).
Figure 3.
Figure 3.. Photoreceptors for phototaxis.
(A) Domain composition of candidate photoreceptor-containing proteins in T. vulcanus. (B) Mutant cell behaviour after lateral light illumination. Upper: lateral green light at a fluence rate of 70 μmol m−2 s−1. Lower: lateral green and blue light at a fluence rate of 70 μmol m−2 s−1. The cell displacement for a duration of 1 min was measured at 3 min after lateral illumination was turned on (N = 50 cells). Cell movements towards the light source are shown as a positive value. (C) Intracellular cyclic dimeric GMP (c-di-GMP) concentrations in wild type (WT) and ∆sesA. The cells were cultivated under blue, green, red, or white light illumination for 30 min, and c-di-GMP was extracted and quantified. The shown data are biological triplicates with technical duplicates, and the mean values are given with the bars. (D) Kymograph of cell movements in the WT, ΔsesA, ΔsesB, and ΔsesC mutants along the optical axis of lateral illumination. The cell position was visualized by near-infrared light. Phototaxis was stimulated by the lateral illumination of green and green/blue light. Green light was applied from time 0 to 4 and from 8 to 12 min, and green/blue light was applied from time 4 to 8 min (see also Videos 7–10). (E) Rose plot. The moving direction of a cell that translocated more than 6 μm min−1 was counted. Lateral light was applied from the right side. The cell displacement was measured at each time point, as presented on the left (N = 50 cells). The data come from Panel D. (F) Schematic model of the reversal in phototaxis induced by the intracellular concentration of c-di-GMP.
Figure 3—figure supplement 1.
Figure 3—figure supplement 1.. Schematic illustration of cellular cyclic dimeric GMP (c-di-GMP) levels and cell migration within a dense cyanobacterial community under solar irradiation.
Blue light is rich at the surface of such a community (e.g., a phototrophic mat in a hot spring). Synthesis of c-di-GMP induces downward migration at the surface, while degradation of c-di-GMP induces upward migration inside.
Figure 4.
Figure 4.. Effect of the tll1859 mutation on phototaxis and intracellular cyclic dimeric GMP (c-di-GMP) concentrations.
(A) Domain composition of Tll1859 protein. The WT_N strain has a frameshift mutation in the gene sequence of the EAL domain. (B) Predicted structure of the Tll1859-EAL domain by SWISS-MODEL. The deleted region in WT_N strain is coloured by magenta. The putative ligand residues essential for metal ion binding (Glu669 and Gln689) which are absent in WT_N, are highlighted in cyan. (C) Phototaxis on agar plates under lateral illumination of white light at a fluence rate of 150 μmol m−2 s−1. (D) Intracellular c-di-GMP concentrations in WT, WT_N, and the independently created tll1859toN mutant. The shown data are biological triplicates with technical duplicates, and the mean values are given with the bars. (E) Cell images at 4 min after the lateral green light was turned on. (F) Kymograph of cell movements along the optical axis of lateral illumination. Directional movements of cells are presented by the tilted lines over time. Lateral green-light illumination was turned on at time 0, presented as a dashed white line. (G) Histograms of the cell displacement along the lateral light axis. Cell movements towards the light source are shown as a positive value. The average and standard deviation (SD) of the cell displacement along the light axis are presented (N = 50). (H) Rose plots. The moving direction of a cell that translocated more than 6 μm min−1 was counted. Angle 0 was the direction towards the lateral light source of the green light. The cell displacement for a duration of 1 min was measured at 4 min after lateral illumination was turned on (N = 50 cells).
Figure 5.
Figure 5.. Type IV pili (T4P) machinery and phototaxis.
(A) Schematic of the T4P machinery. Protein components and their gene IDs from the genome of T. vulcanus are indicated. The location of the components is presented in reference to other species (Chang et al., 2016). (B) Electron microscopy (EM) image of a cell. (C) Magnified images of the yellow and orange boxed areas are presented. (D) Effect of lateral light illumination on mutant cells. Lateral green light was applied at a fluence rate of 70 μmol m−2 s−1. The average and standard deviation (SD) of the cell displacement on the glass surface along the light axis are presented (N = 50). Hfq was previously suggested to be involved in the formation of T4P machinery in other cyanobacteria (Schuergers et al., 2014).
Figure 6.
Figure 6.. Moving trajectories of cells during negative phototaxis.
(A) Cell images and moving trajectories. Images were integrated with a single image at each time duration presented (see also Videos 12–14). Upper: movement of microcolonies. Left bottom: cell perpendicular to lateral light axis. Right bottom: cell that stood up and kept binding at a cell pole. (B) Cell–cell interaction. The area of a cell moving as a single unit was measured before and after the induction of negative phototaxis and presented as the ratio by the area (N = 353). (C) Moving direction of a cell in relation to the light source. The orientation of single cells during negative phototaxis was measured, and the distribution is presented (N = 148). The absolute angle of the longer axis of a cell was measured in relation to the lateral light axis. The parallel cellular orientation to the light axis (shown on the left) was taken as 0°, whereas the perpendicular orientation (shown on the right) was ideally 90°.
Figure 7.
Figure 7.. Visualization of type IV pili (T4P) dynamics through nano-beads.
(A) Schematic of the beads’ assay. Sulfate beads (200 nm in diameter) were added to the cells on a glass surface. (B) Typical trajectories of beads. Left: a series of images. Time was presented at the right upper corner of the image. Right: trajectories of the bead moving away from and towards the cell. (C) Trajectories of beads. Red and blue indicate bead movement away from and towards the cell, respectively. The bead trajectories with a time interval of 0.1 s were overlaid onto the cell image. (D) Time course of the distance between the bead and a cell pole. The data came from Panel C. (E) Distribution of the bead velocity. The velocity was measured by the time course of bead displacement. The movement towards the cell was measured as a negative value. The average and standard deviation (SD) of the plus and minus regions are presented (N = 200 in 12 cells). (F) Trajectories of beads during negative phototaxis. Lateral light illumination was applied from the right side of the image. The cell perpendicular to the lateral light axis is presented. The cell showed directional movement towards the left side of the image, and the cell position is presented by the dashed yellow lines every 10 s. The trajectories of beads with a time interval of 0.1 s were overlaid onto the cell image. (G) Distribution of the bead angle. Left: schematic of the angle definition. The cells perpendicular to the lateral light axis were used for analysis. Right: the angle formed by the longer cell axis and the bead trajectories around the cell pole at the upper side were measured (N = 150 in 10 cells). (H) Schematic of T4P dynamics during negative phototaxis of the cell perpendicular to the lateral light axis. T4P was asymmetrically activated on the other side of the light source.
Figure 7—figure supplement 1.
Figure 7—figure supplement 1.. Optimization of beads assay.
(A) Type IV pili (T4P)-dependent bead accumulation at the cell pole. Cell images were observed by dark-field microscopy 2 min after adding 200-nm diameter sulfate beads. Yellow indicates bead accumulation at the cell pole. (B) Preference of bead accumulation. Dark-field images 2 min after adding 200-nm diameter carboxylate- and amine-modified beads are presented.
Figure 7—figure supplement 2.
Figure 7—figure supplement 2.. Effect of the illumination of green and green blue light on type IV pili (T4P) dynamics.
T4P dynamics were visualized through 200-nm diameter sulfate beads. The velocity of bead movement was measured by the time course of bead displacement. The movement towards the cell was measured as a negative value. The average and standard deviation (SD) of the plus and minus regions are presented. (A) Green light at 70 μmol m−2 s−1 (N = 200 in 12 cells). The same data are presented in Figure 7E as a control. (B) Green and blue light at each 70 μmol m−2 s−1 (N = 100 in 10 cells).
Figure 7—figure supplement 3.
Figure 7—figure supplement 3.. Micro-optics effect.
(A) Cell image via optical microscopy. Left: cell image visualized by the lateral illumination of green light from the right side of the image. Middle: cell outline visualized by the vertical illumination of green light. Right: merged image. The cells attached on the glass surface parallel and perpendicular to the lateral light axis are presented at the top and bottom, respectively. (B) Intensity profiles. Light intensity along the yellow dashed line in Panel A is presented. The cell positions were marked by the grey regions.
Figure 8.
Figure 8.. Direct visualization of type IV pili (T4P) dynamics by PilA labelling in living cells.
(A) Schematic of the epi-fluorescent microscopy setup. (B) Distribution of the velocity of T4P dynamics. The velocity of pilus dynamics was measured as the time course of the displacement of the identified tip part of a T4P filament towards or away from a cell pole. The retraction of T4P was measured as a negative value. The average and standard deviation (SD) of the plus and minus values are presented (N = 57 in 10 cells). The non-moving cells under epi-fluorescence microscopy were used for the data analysis. (C) Consecutive time-lapse images of a cell moving towards the left side under epi-fluorescence microscopy. The time is shown at the right upper corner of the image. (D) Schematic of the total internal reflection fluorescence (TIRF) microscopy setup. (E) Image sequence of a cell moving towards the left side under TIRF microscopy. The time frame is presented at the right upper corner of the image. (F) Distribution of the T4P filaments. Left: schematic of the angle definition. The cells moving towards the left side aligned perpendicular to the x axis of the image under TIRF microscopy were used for the data analysis. The angle relative to the cell axis in the direction of movement was measured as a negative value. The angle formed by the longer cell axis and the tip of T4P filaments around the cell pole were measured (N = 119 in 20 cell poles).

Similar articles

Cited by

References

    1. Agostoni M, Koestler BJ, Waters CM, Williams BL, Montgomery BL, Newman DK. Occurrence of cyclic di-GMP-modulating output domains in cyanobacteria: an illuminating perspective. MBio. 2013;4:e00451-13. doi: 10.1128/mBio.00451-13. - DOI - PMC - PubMed
    1. Auwera GAVd OB. Genomics in the Cloud: Using Docker, GATK, and WDL in Terra / Geraldine A. Sebastopol: Van der Auwera and Brian D. O’Connor. O’Reilly; 2020.
    1. Bebout BM, Garcia-Pichel F. UV B-induced vertical migrations of cyanobacteria in a microbial mat. Applied and Environmental Microbiology. 1995;61:4215–4222. doi: 10.1128/aem.61.12.4215-4222.1995. - DOI - PMC - PubMed
    1. Beyer HM, Gonschorek P, Samodelov SL, Meier M, Weber W, Zurbriggen MD. AQUA Cloning: A Versatile and Simple Enzyme-Free Cloning Approach. PLOS ONE. 2015;10:e0137652. doi: 10.1371/journal.pone.0137652. - DOI - PMC - PubMed
    1. Bhaya D, Bianco NR, Bryant D, Grossman A. Type IV pilus biogenesis and motility in the cyanobacterium Synechocystis sp. Molecular Microbiology. 2000;37:941–951. doi: 10.1046/j.1365-2958.2000.02068.x. - DOI - PubMed

Publication types